
記住我


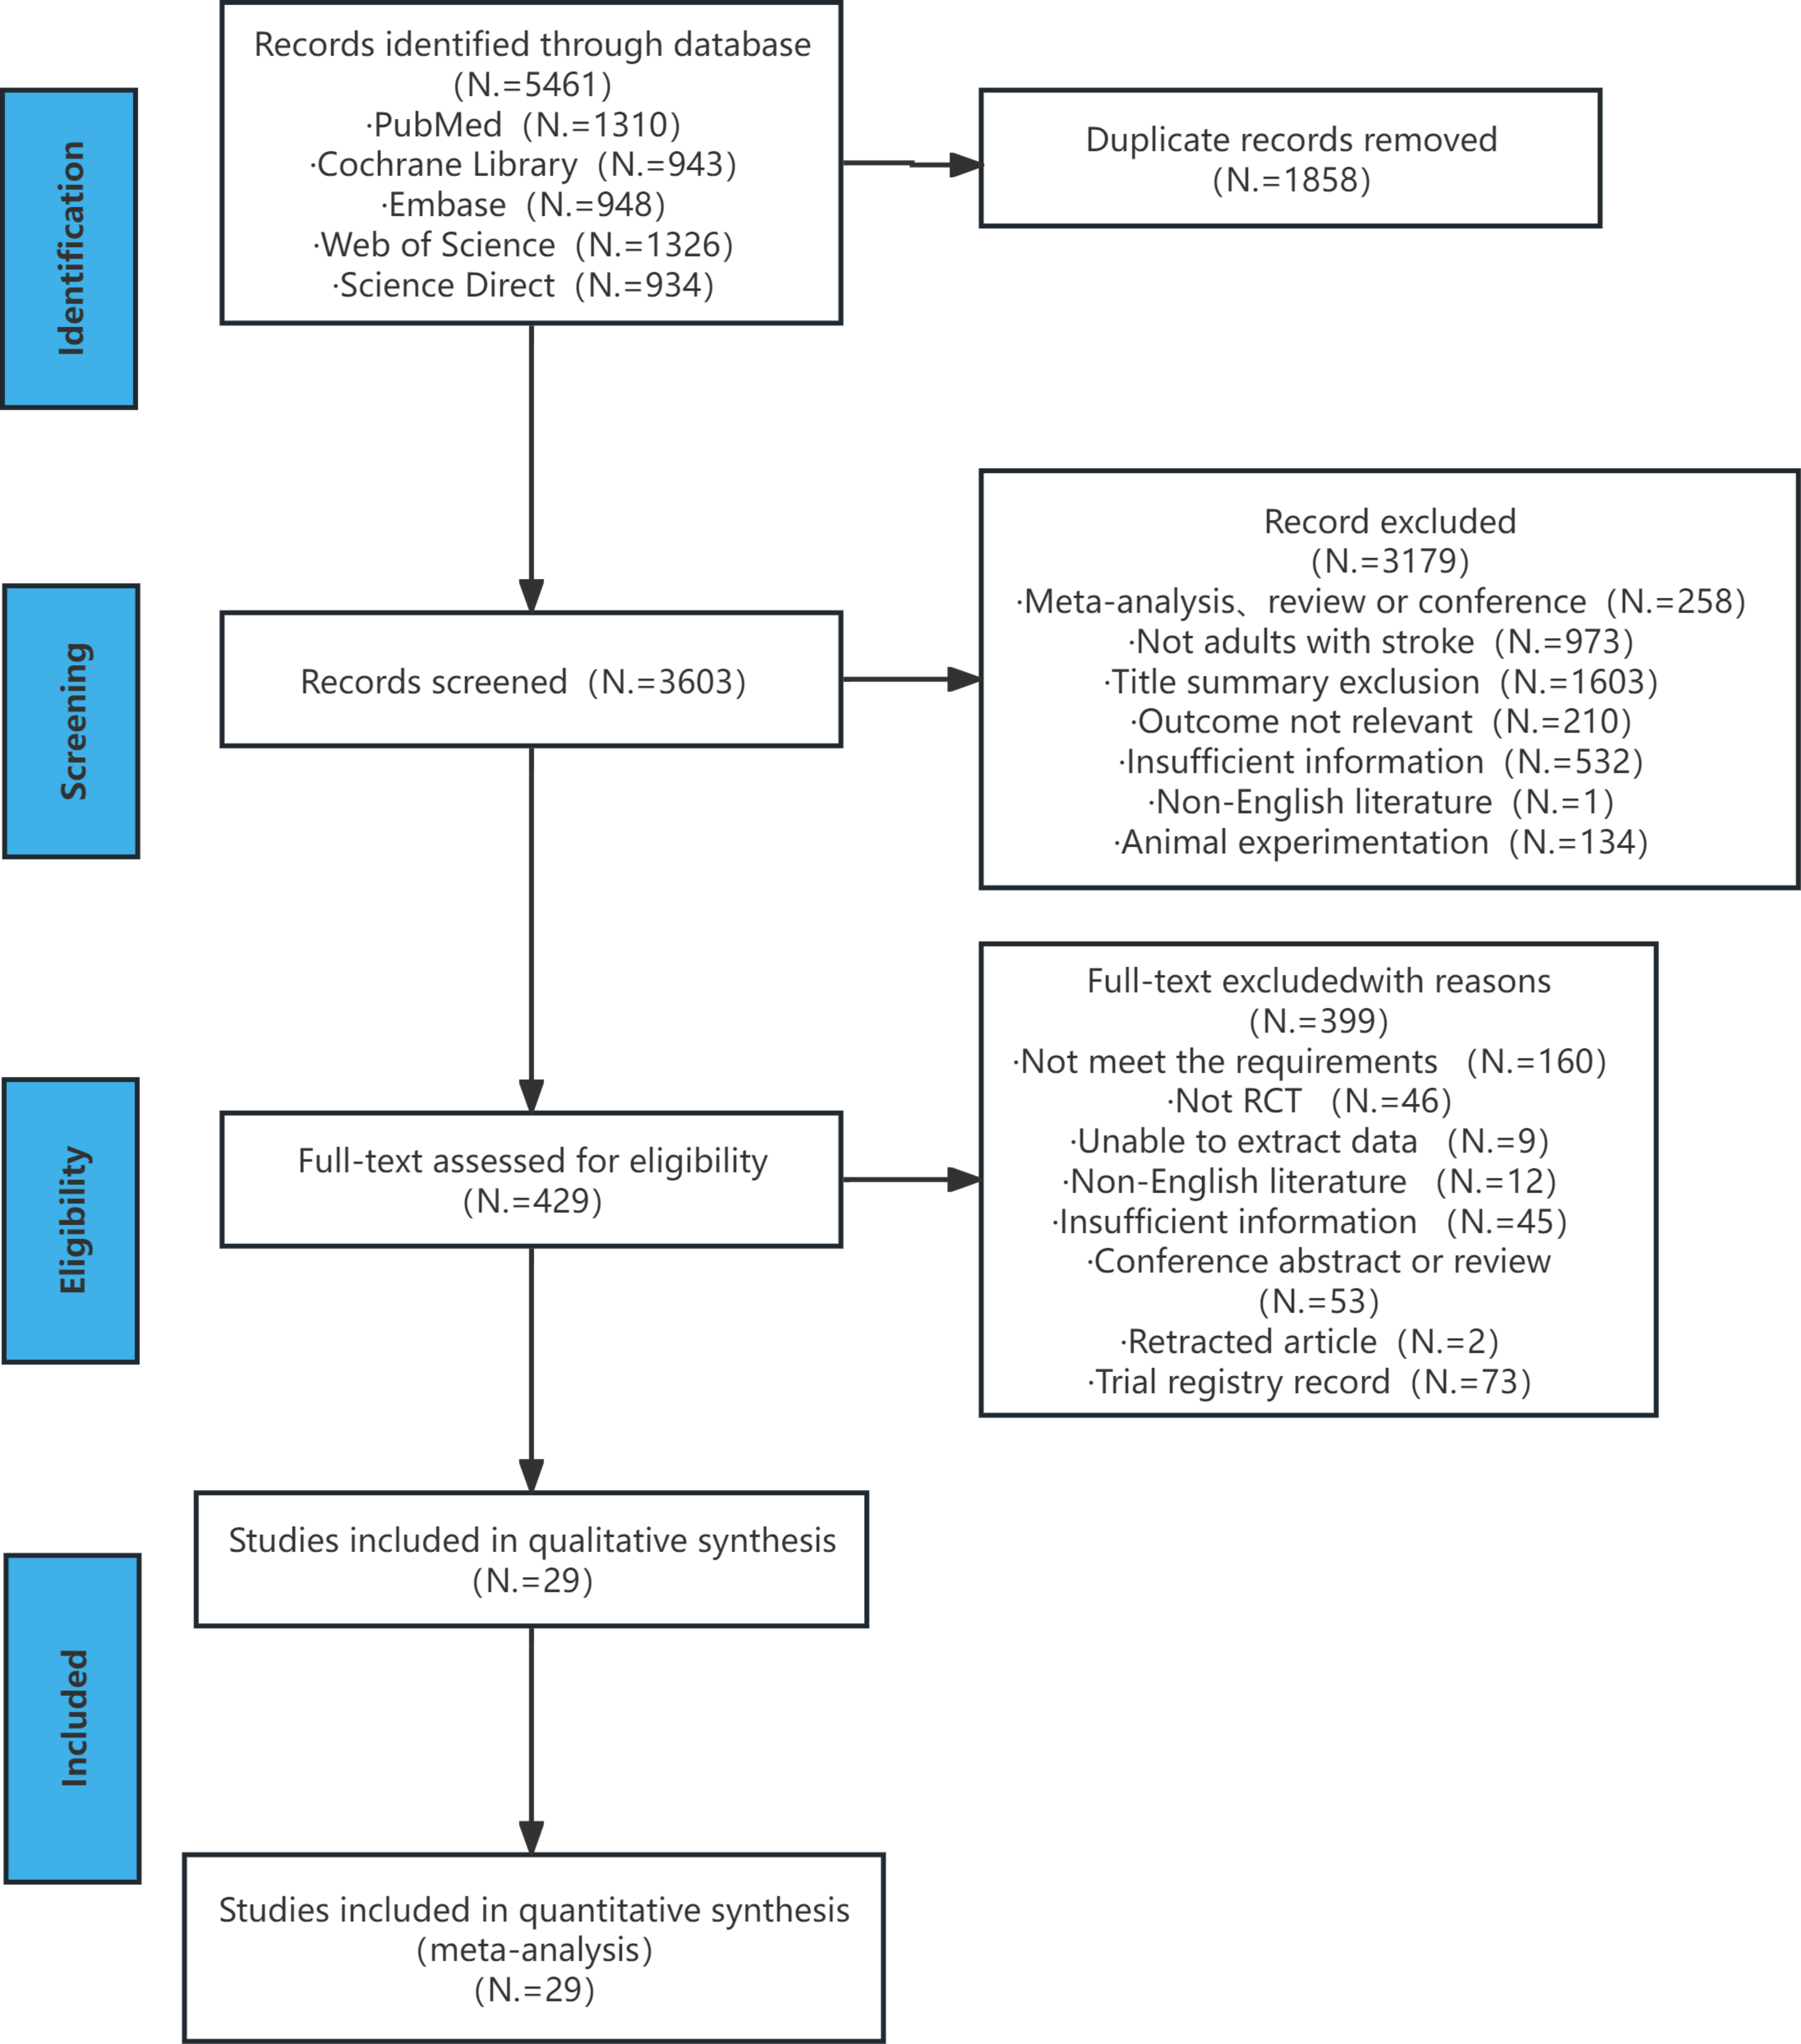


Using the search strategies described above, a total of 5965 studies were retrieved from five databases (1310 from PubMed, 943 from Cochrane Library, 948 from Embase, 1326 from Web of Science and 934 from Science Direct). After eliminating duplicates and screening the remaining literature, 29 eligible studies were included [14, 16,17,18, 29,30,31,32,33,34,35,36,37,38,39,40,41,42,43,44,45,46,47,48,49,50,51,52,53]. A total of 1711 patients were included in the study cohort (848 in the experimental group and 863 in the control group) and their basic information is shown in Appendix 1. Fig. 1 illustrates the literature screening process and results. Except three studies [39, 46, 52] in which NMES was combined with treadmill walking training, the experimental groups in the included studies were either NMES combined with conventional walking training or NMES alone. In addition, four studies [34, 35, 45, 47] pinpointed the use of ankle-foot orthosis in control groups. Moreover, in 89.66% of the included studies, treatment cycles were greater than or equal to four weeks, with a single treatment duration ranging from ten minutes to one and a half hours.
Fig. 1
Literature screening process and results
Risk of biasFigure 2; Table 1 display the risk of bias in the included studies (8 medium-quality and 21 high-quality studies). Among them, 7 studies [16, 29, 34, 42, 46, 49, 53] did not explicitly stated whether a blind method was used, 3 studies [18, 35, 45] did not use blind method, 15 studies [14, 17, 30, 32, 33, 36, 37, 40, 41, 43, 47, 48, 50,51,52] used a single blind method, 3 studies [31, 38, 44] used double blind method and 1 study [39] used triple blind method. Regarding random sequence generation, only 6 studies [29, 34, 36, 44, 51, 53] had unclear methods for random sequence generation, while the rest had clear descriptions. Meanwhile, 9 studies [14, 34,35,36, 39, 43, 44, 51, 53] did not mention allocation concealment, while the rest provided detailed descriptions (including three high-risk studies [18, 30, 50]).Besides, data were completely reported in all studies, except for 1 study [32], which was defined as high-risk due to a serious loss of follow-up in partial outcome indicator. And 1 study [47] was defined as high risk in selection of the reported result due to funding by a corporation. Moreover, 13 studies [14, 16, 30,31,32,33,34, 38, 41, 46, 51,52,53] used electrical stimulation frequencies at 15–50 Hz, 4 studies [37, 43, 44, 48] at 80–100 Hz and the remaining studies did not describe this characteristic.
Fig. 2 Table 1 Summary of PEDro score
The summary of findings in Appendix 1 display the certainty of the evidence (1 high, 4 moderate, 5 low, 3 very low). It was attributed to a moderate degree of heterogeneity, small sample sizes, small confidence interval overlap and high-risk of bias.
Results of individual studiesWalking speedIt can be categorized into QGA speed and 10MWT.
Regarding QGA speed, fourteen studies were included, involving 445 patients with stroke-induced lower limb motor dysfunction. Due to the heterogeneity test results (P = 0.002, I2 = 61%), a random-effect model analysis was used. The results in Fig. 3 indicated that there was a statistical difference between the experimental group and the control group [SMD = 0.53, 95% CI (0.20, 0.85), P = 0.001]. Sensitivity analysis found that the results showed satisfactory robustness (Fig. 4-A).
Fig. 3
Forest plots for the analysis of QGA speed and its subgroups. (A) subgroup analysis on post-stroke time, (B) subgroup analysis on treatment sessions
Fig. 4
Sensitivity analysis plots of QGA speed (subfigure A), 10MWT (subfigure B) and cadence (subfigure C)
Subgroup analysis of post-stroke time indicated that the chronic phase [SMD = 0.61, 95% CI (0.23, 0.99), P = 0.002] showed a higher effect size than the acute and subacute phases [SMD = 0.44, 95% CI (-0.11, 0.98), P = 0.12], as shown in Fig. 3-A. Subgroup analysis of treatment sessions indicated that ≤ 4 weeks [SMD = 0.56, 95% CI (0.12, 1.00), P = 0.01] showed a higher effect size than > 4 weeks [SMD = 0.51, 95% CI (0.00, 1.01), P = 0.05], as shown in Fig. 3-B.
Regarding 10MWT, fifteen studies were included, involving 1250 patients with stroke-induced lower limb motor dysfunction. Due to the heterogeneity test results (P<0.00001, I2 = 78%), a random-effect model analysis was used. The results in Fig. 5 indicated that there was no statistical difference between the experimental group and the control group [WMD = 0.02, 95% CI (-0.03, 0.06), P = 0.47]. Sensitivity analysis found that the results showed satisfactory robustness (Fig. 4-B).
Fig. 5
Forest plots for the analysis of 10MWT and its subgroups
Subgroup analysis of post-stroke time indicated that the chronic phase [WMD=-0.01, 95% CI (-0.01, -0.01), P<0.00001] showed a higher effect size than the acute and subacute phases [WMD = 0.00, 95% CI (-0.01, 0.01), P = 0.99], as shown in Fig. 5.
CadenceTen studies were included, involving 309 patients with stroke-induced lower limb motor dysfunction. Due to the heterogeneity test results (P = 0.0009, I2 = 68%), a random-effect model analysis was used. The results in Fig. 6 indicated that there was a statistical difference between the experimental group and the control group [SMD = 0.76, 95% CI (0.32, 1.20), P = 0.0008]. Sensitivity analysis found that the results showed satisfactory robustness (Fig. 4-C).
Fig. 6
Forest plots for the analysis of cadence and its subgroups. (A) subgroup analysis on post-stroke time, (B) subgroup analysis on number of stimulation sites, (C) subgroup analysis on treatment sessions
Subgroup analysis of post-stroke time indicated that the acute and subacute phases [SMD = 1.04, 95% CI (0.54, 1.54), P<0.0001] showed a higher effect size than the chronic phase [SMD = 0.66, 95% CI (0.10, 1.22), P = 0.02], as shown in Fig. 6-A. Subgroup analysis of the number of stimulation sites indicated that multiple stimulation sites [SMD = 0.79, 95% CI (0.22, 1.36), P = 0.006] showed a higher effect size than a single stimulation site [SMD = 0.74, 95% CI (0.04, 1.44), P = 0.04], as shown in Fig. 6-B. Subgroup analysis of treatment sessions indicated that ≤ 4 weeks [SMD = 0.91, 95% CI (0.46, 1.36), P<0.0001] showed a higher effect size than > 4 weeks [SMD = 0.70, 95% CI (0.09,1.32), P = 0.02], as shown in Fig.
留言 (0)