
記住我


This is a pilot double-blinded randomized controlled trial with a 6-month follow-up. This study aimed to explore the add-on intervention effects of personalized HD-tDCS in addition to EMG-RH training on UE motor function and neuroplasticity. Two groups were designed in this study, including the HDtDCS-group receiving personalized HD-tDCS with EMG-RH training, and the Sham-group receiving sham stimulation with EMG-RH training. Each participant received 20 sessions of intervention, with an average of 1–3 sessions per week. Each session began with 20 min of HD-tDCS or Sham stimulation, followed by 60 min of EMG-RH training. The assessments included clinical scales, MRI scanning, EEG-EMG, and EMG to evaluate the motor function improvement and the potential neuromodulation effects. The fMRI assessment was conducted at three timepoints, including Pre (within 3 days before intervention), Post (within 3 days immediately after 20 sessions of intervention), and 6 m Follow-up (within 3 days at 6 months after the intervention). In addition to fMRI, the EEG-EMG, clinical scales, and EMG assessments were also performed at these three timepoints, and these assessments were arranged on different days from fMRI but still within the 3-day window. The recruitment, assessments, intervention, and follow-up were conducted in Hong Kong between 2021 and 2022. This study was approved by the Joint Chinese University of Hong Kong-New Territories East Cluster Clinical Research Ethics Committee (No. 2018.661). This study was registered with an identifier NCT05638464.
ParticipantsThe recruited subjects met the following inclusion criteria: (1) first-ever stroke, the duration after stroke exceeds 6 months; (2) mild to moderate UE motor function deficit, with Fugl-Meyer assessment of upper extremity (FMAUE) scores between 15 and 53 [38]; (3) detectable voluntary EMG signal from flexor digitorum (FD) and extensor digitorum (ED); (4) scored below 4 in the Modified Ashworth Score (MAS) of FD and ED; (5) sufficient cognitive function to follow instructions, with Mini-Mental State Examination scores more than 21. (6) no experience with robotic hand training, tDCS, HD-tDCS, or transcranial magnetic stimulation before. The participants were excluded with a history of epilepsy or any other contradictions of tDCS and MRI scans. All participants gave their written informed consent before the experiments. This study was conducted under the principles of the Declaration of Helsinki.
The expected benefits and risk of the recently developed personalized HD-tDCS with robotic hand training on chronic stroke patients are not available in previous studies. Taking into consideration ethical concerns and available resources [39], we estimated the sample size based on our recent EMG-driven robotic hand training, the mean expected improvement in FMAUE was around 3.31 with a standard deviation of 3.79 points [40]. The mean expected improvement after tDCS with robotic arm training was referred to as 8.73 points from work by Triccas et al. [41] with a similar group sample size (around 10 subjects in a group). A power calculation with P = 0.05 and 80% power suggested that at least 8 subjects per group would detect a significant difference between the two groups in terms of FMAUE. In this pilot randomized controlled trial, we screened 60 subjects from local community and enrolled 19 subjects.
Standard envelope randomization was utilized to ensure the unbiased 1:1 ratio allocation of subjects to two groups. Before the trial, the randomization sequence was computer generated by a research team member (who did not participate in group assignment of enrolled participants), and opaque envelopes containing two different colored cards were sealed following this sequence. At the start of the trial, the envelopes were opened one by one in a predetermined order by the enrolled subjects following the instructions of investigator. The color of the card that each subject chose indicated the group to which they were allocated for the study. Subjects and the outcome raters were blinded to the allocation.
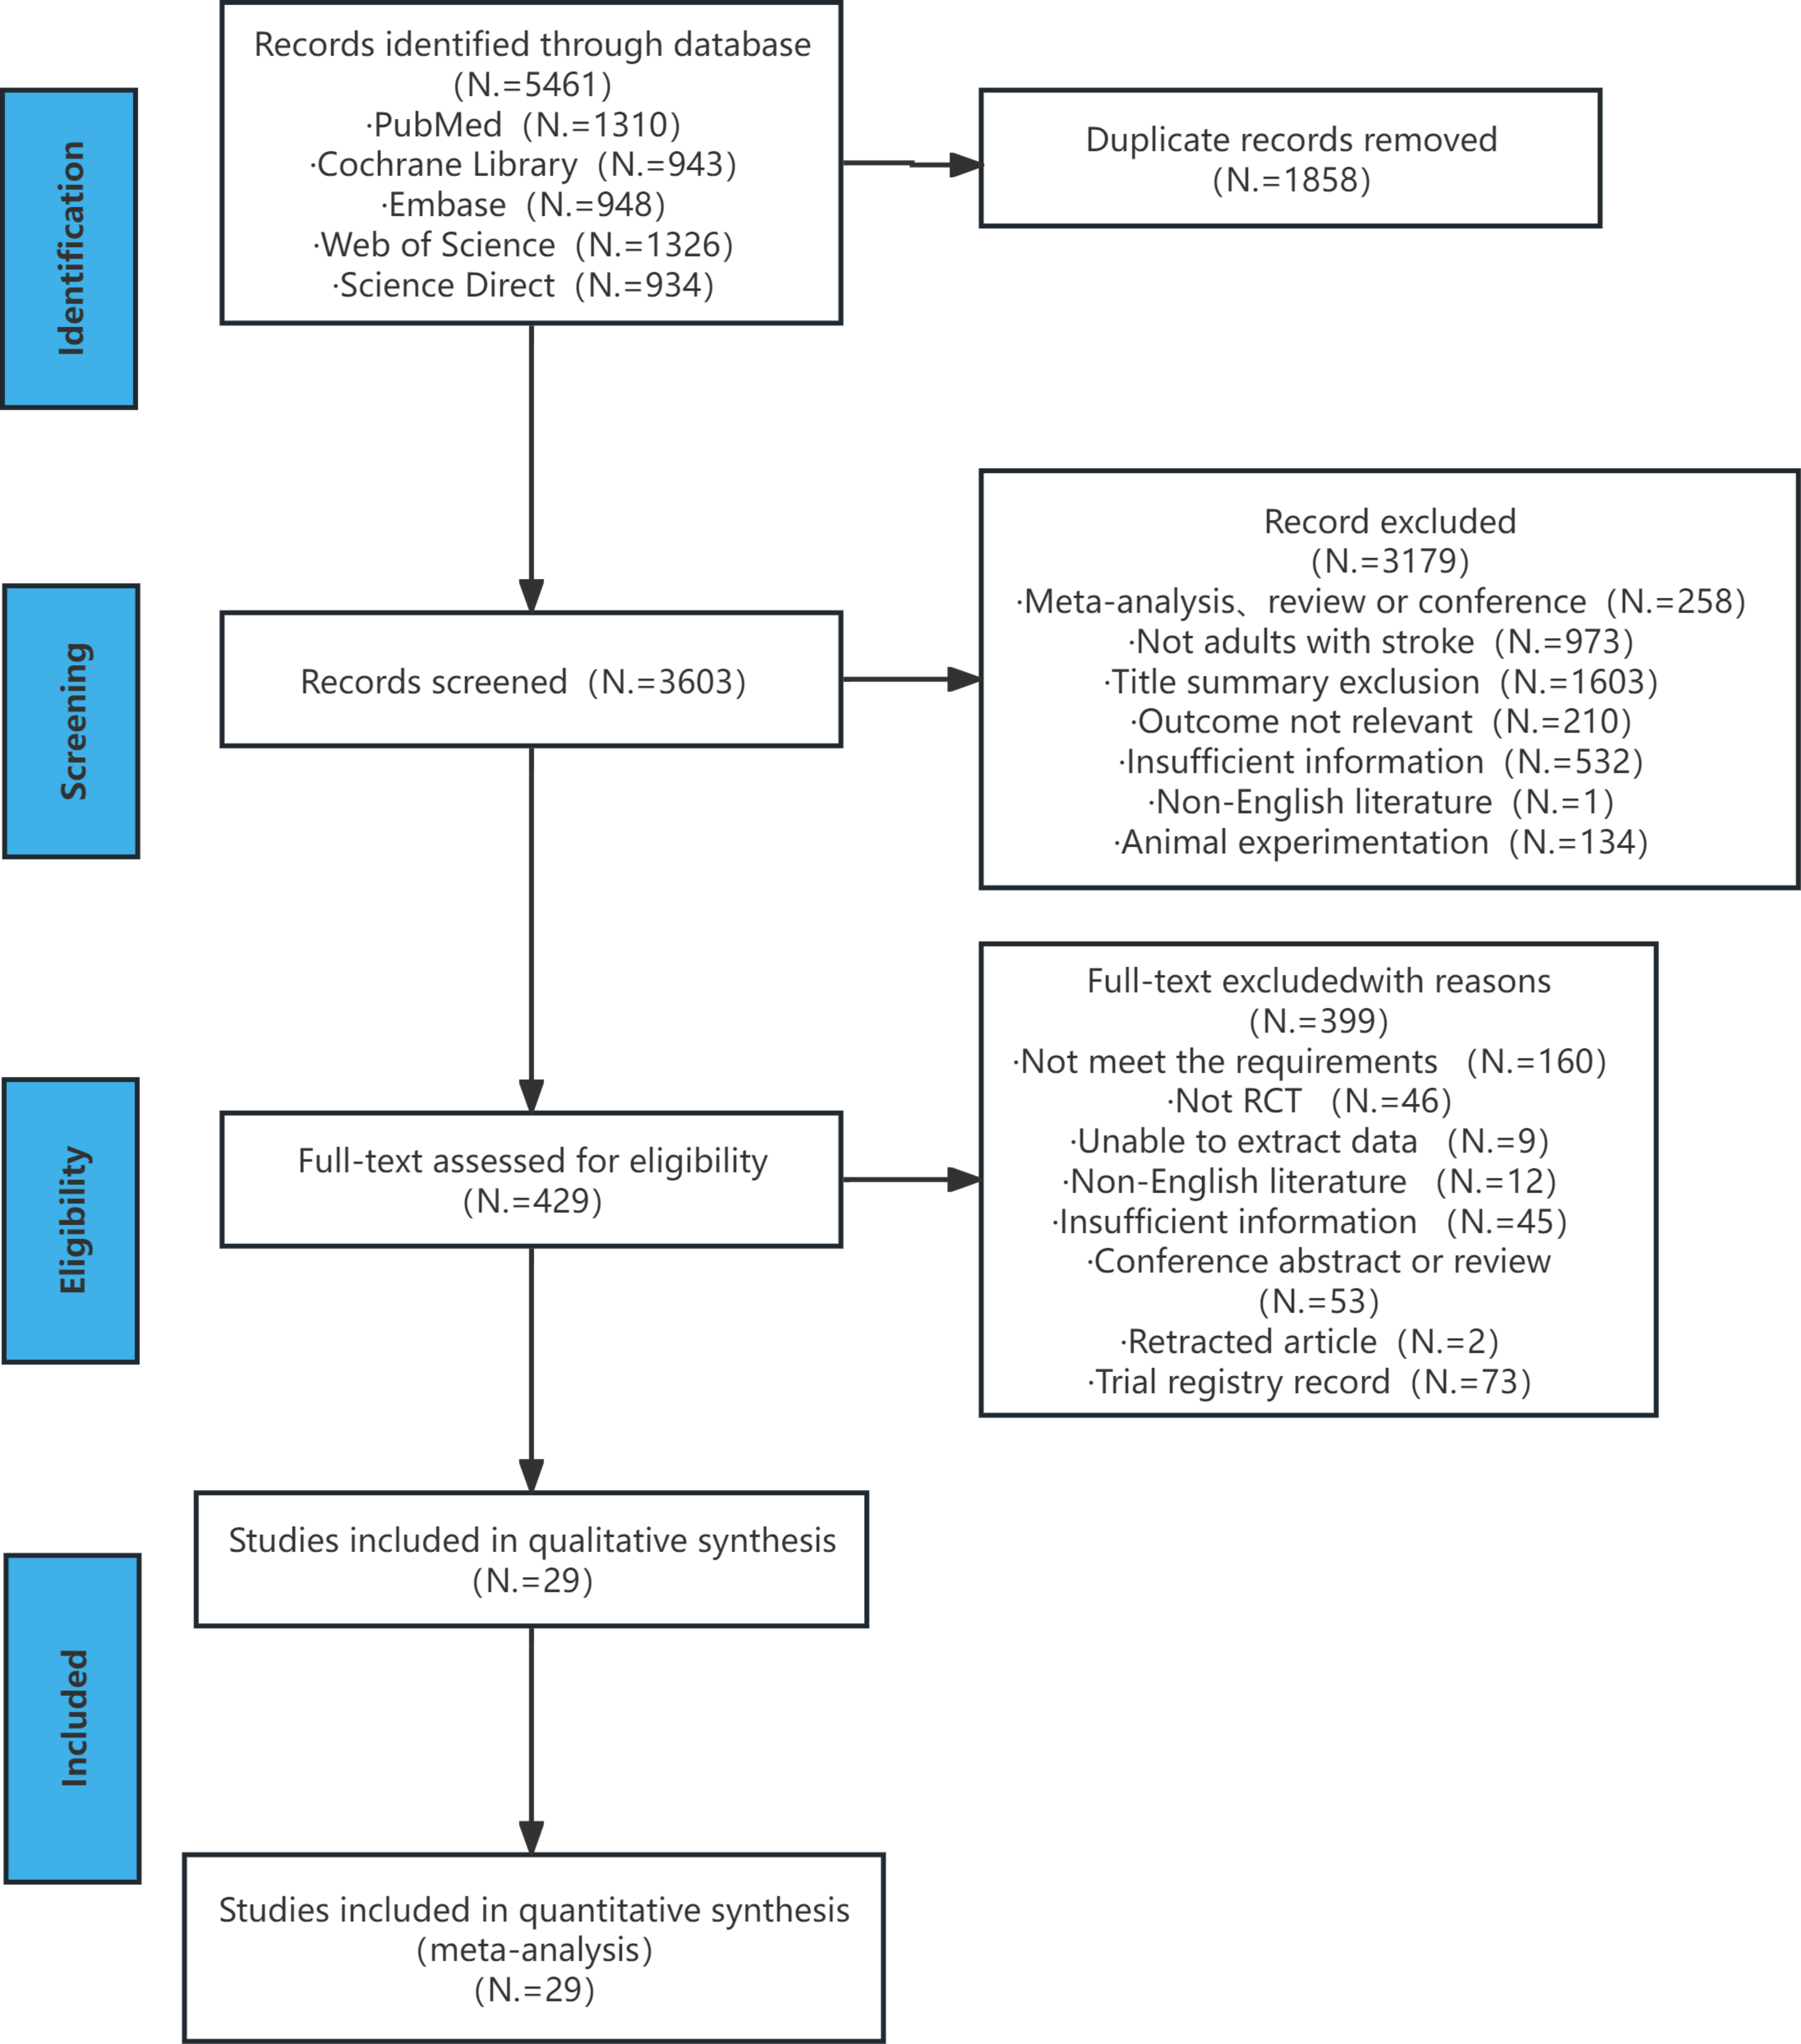
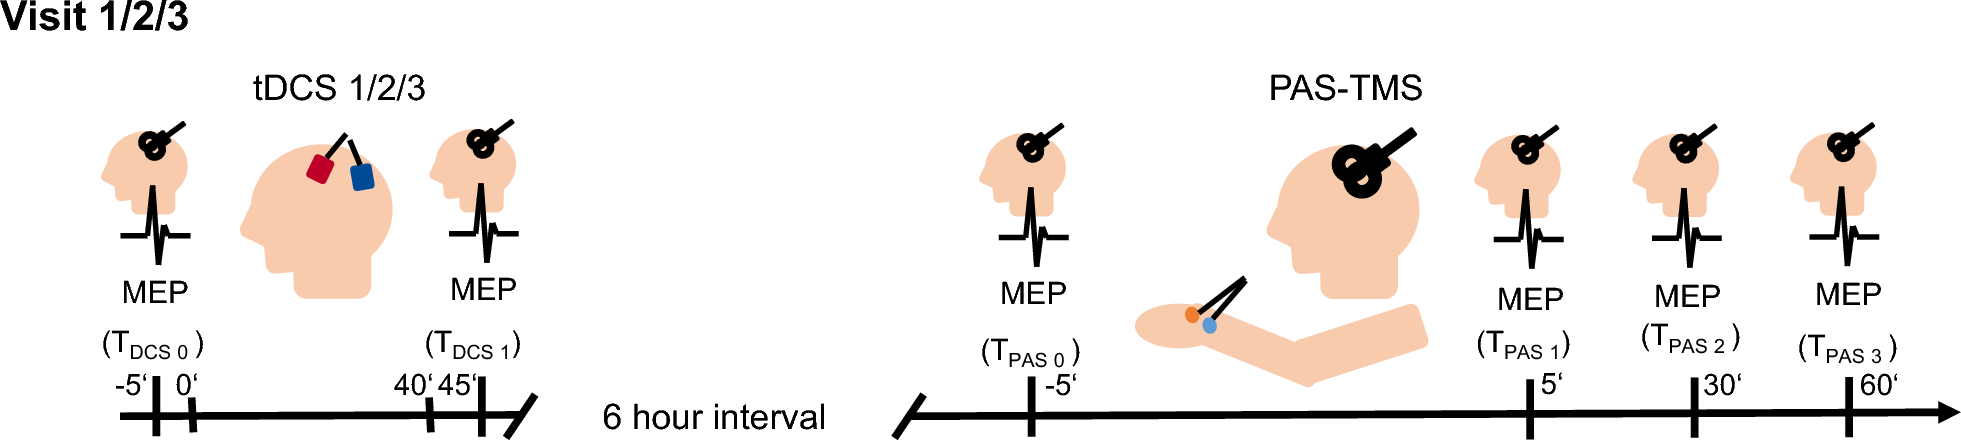
Nineteen chronic stroke subjects were randomly allocated to HDtDCS-group (n = 9) and Sham-group (n = 10). The baseline demographics and clinical scores are demonstrated in Table 1. One subject in the HDtDCS-group dropped out because of COVID-19 restrictions. One subject from HDtDCS-group missed the 6 m Follow-up assessment because of personal reasons. Figure 1 (a) shows the flowchart of this study. Figure 1 (b) shows the workflow of the assessments and the intervention.
Table 1 Clinical demographic at baseline and training informationFig. 1
Flow chart of this study. (a). Flowchart of this pilot randomized controlled trial. (b). Workflow of this intervention study, including timelines of assessments and intervention. Abbreviation HDtDCS-group High-definition transcranial direct stimulation with EMG-driven robotic hand group; Sham-group sham stimulation with EMG-driven robotic hand group
MRI data acquisition and processingMRI data was acquired before intervention MRI scans were acquired using a 3T Siemens Prisma MRI scanner (Siemens Healthcare, Erlangen, Germany) with an 8-channel head coil, including T1-weighted anatomical images (TR/TE = 1900/2.93ms, flip angle = 9°, 176 slices, voxel size = \(\:0.9\times\:0.9\times\:1.0\:^\)) using a T1-MPRAGE, and BOLD fMRI images ( TR/TE = 1200/30 ms, flip angle = 68°, 48 slices, voxel size = \(\:3.0\times\:3.0\times\:3.0\:^\)) using an EPI-FID sequence. The sequences for task-based fMRI (tb-fMRI) were displayed using EPrime 3.0 (Psychology Software Tools, PA USA). Motor execution (ME) tasks were designed based on the EMG-RH training. During the ME task, two tennis balls were placed in the subject’s left hand and right hand respectively in advance. In case the ball fell out of the affected hand, adhesive tape was used to fix the tennis ball in the affected hand. Subjects were asked to grasp the corresponding hand when a mark of “left hand” or “right hand” appeared on the screen and were asked to maintain 6 s until a “rest” mark appeared. An event-related design was adopted with a randomized inter-trial interval ranging from 12 to 20 s. A total of 20 ME tasks including 10 using the affected hand and 10 using the unaffected hand were randomized adopted during the scanning, and it took around 7 min for tb-fMRI scanning [42]. The MRI scanning was performed for each subject at Pre, Post, and 6 m Follow-up assessments.
The details of data processing are illustrated in Supplementary 1.1. As a result of the data processing, the t-maps during affected hand tasks were generated at Pre, Post, and 6 m Follow-up to evaluate cortical activation [43]. The tb-fMRI data of one subject in Sham-group was excluded from the analysis because of excessive motion artifacts. In addition, the MRI data acquired before intervention were also used to generate personalized HD-tDCS montages. Specifically, the t-maps acquired at Pre were recognized as the individual motor hotspot allocation, and the structural MRI acquired at Pre was used to determine individual lesion profiles and brain structure information.
Personalized stimulation montage for multisite-HD-tDCSThe personalized stimulation montage was generated using MRI data for each subject from both HDtDCS-group and Sham-group. Details of optimization can be found in Supplementary 1.2. Briefly, a FEM was generated from individual structural T1 and T2 images (Fig. 2a), including six compartments (scalp, skull, cerebrospinal fluid, grey matter, white matter, and stroke lesions). Each compartment was assigned corresponding isotropic electrical conductivity values [44, 45]. Optimization of montages was then performed on individual FEM models following the procedures described in previous studies [46, 47]. Specifically, the individual fMRI t-map was used as target map to guide the EF distribution and generate the best-match montages (Fig. 2c). The Error Relative to No Intervention (ERNI) value was calculated to evaluate the optimization performance. A negative ERNI represents EFs approaching the target maps, indicating a better fit. Montages were set with the following constraints: (1) The number of electrodes is less than or equal to 8. (2) The total current inside the brain does not exceed 4 mA. (3) The current of each electrode does not exceed 2 mA. (4) The sum of the total current equals zero. The results of optimization were quantified by the total ERNI and the weighted cross-correlation (WCC) between the target EF and simulated EF, using the definition in a previous study [46]. The targeting Index and Miss-hit Index were calculated to show the stimulation details. The Targeting Index reveals the proportions of the regions in the ipsilesional activation map that were stimulated; the Miss-hit Index means the percentage of unactivated regions that were stimulated. The optimization generated the individual stimulation montage, including the location and current intensity of each electrode (Supplementary Table 2.1).
Fig. 2
Optimization procedures and training protocol. (a) Generation of individualized finite element model. Segmentation of tissues was obtained from high-resolution structural T1 and T2 images and converted into volume conductor models consisting of six compartments. Simulation of the electric field was performed by solving the Laplace Equation using FEM solver after placing modeled electrodes at the desired locations. (b) Generation of leadfield matrix. Leadfield was generated by performing simulations with bipolar configurations, with anodes (red) placed at a defined set of locations (39 in total) and Cz (blue) as the cathode. The figure showed seven channels for illustration purposes. The column of the matrix represents the electric field in \(\:\overrightarrow_},\:\overrightarrow_},\overrightarrow_}\) direction over the volume conductor models. (c) Optimization of HD-tDCS montages. Stimulation targets were defined using individual fMRI activations during paretic motor tasks. Optimization was based on a distributed constrained maximum intensity method, which minimizes the Error Relative to No Intervention (ERNI). A value of higher -ERNI (red) indicates a smaller difference between the simulated and desired target electric field. (d) The stimulation montage of one subject was generated with the amplitude and location of each electrode. After 20 s of active/sham stimulation, the subject accepted robotic hand training. The active-assisted opening and grasping hand movements were cued by the instructions on the screen in front of the subject and triggered by the muscle contraction of the Extensor digitorum (ED) and Flexor digitorum (FD) respectively
Personalized HD-tDCS montagesThe optimization results for subjects from HDtDCS-group were demonstrated in Fig. 3. The reorganized brain activation varied across individuals (Fig. 3a), including the M1, SMA, ventrolateral and dorsolateral PMC, and superior and inferior parietal cortex. The location in the MNI space of individual hotspot was summarized, with an average shifted distance of 18.5 mm from the standard primary motor cortex (Table 2). The individual lesion profiles were demonstrated in Supplementary Table 2.2. Figure 3b shows the optimized individual EF using the generated montage. Figure 3c demonstrates the individual local ERNI maps to show the performance of the optimization, where the maps depicted focal stimulation on the targets with promising matching performance. An average value of \(\:-685\) and 0.215 was achieved for ERNI and WCC respectively, which yielded comparable results with other optimization simulation studies [28]. Figure 4a shows the group-level overlapped electric field of HDtDCS-group, which indicates the M1, SMA, PMC, and inferior parietal cortex were targeted for all subjects in HDtDCS-group.
Fig. 3
Optimization results of personalized high-definition-tDCS montages. Electric field simulation results using the optimized montages of eight chronic stroke subjects from the HDtDCS-group. (a) Individual target map from task-based fMRI. The map was generated from the grasping hand task-fMRI activation map. Individual hotspot locations can be found in Table 2. (b) Stimulated electric field. Normal EF component for optimized stimulation montages. Electrodes in red and blue represent the anode and cathode respectively, details of the individual montage information can be found in Supplementary Table 2.1. (c) Match results between target map and electric field. The optimization performance for each subject was quantified by Error Relative To No Intervention (ERNI). Positive values (red) indicate a better fit than no intervention, and negative values (blue) mean a worse fit than no intervention
Table 2 Information of individual motor hotspot and optimization performance for HDtDCS-groupFig. 4
FMRI results. (a) Group level of the overlapped stimulated area of subjects from the HD-tDCS group, regions in red represent the area that all the subjects from the HDtDCS-group were stimulated. (b) Group level motor activation at Pre, Post, and 6-month Follow-up sessions. The activation maps were generated from the HDtDCS-group and Sham-group during grasping the paretic hand. (c) Violin plots with mean and standard deviation showing the comparison of laterality index for the HDtDCS-group and Sham-group at Pre, Post, and 6-month Follow-up. (d) The demonstration of the overlaps between activated and stimulated regions (red), and the activated regions that were not stimulated (green) at Pre, Post, and 6-month Follow-up sessions. Activations were focused on the stimulated regions and reduced in the non-stimulated regions after intervention, and continuously at 6-month follow-up for HDtDCS-group, indicating an enhanced Specificity of stimulation. (e) The violin plots with mean and standard deviation show the comparison of specificity in both groups at Pre, Post, and 6-month Follow-up. Abbreviation HDtDCS-group High-definition transcranial direct stimulation with EMG-driven robotic hand group; Sham-group sham stimulation with EMG-driven robotic hand group; contra contralesional hemisphere; ipsi ipsilesional hemisphere; Pre before training; Post immediately after the training; 6 m Follow-up six-month follow-up. *: P < 0.05. The yellow dot and black bars represent the mean and standard deviation of the corresponding group
HD-tDCS combined EMG-RH trainingAfter we optimized the montage for the personalized HD-tDCS, we applied it to the intervention. During the intervention, both groups underwent 20 sessions of training, each session began with 20 min of HD-tDCS (Personalized HD-tDCS/Sham) and was then followed by 60 min of robotic hand training. An average of 1–3 sessions of training were delivered each week, and the average and standard deviation of training duration was 71.8 ± 30.0 days for the HDtDCS-group and 79.4 ± 18.8 days for Sham-group. The cost of the MRI scan for building stimulation montage was around USD 500 for each subject.
In this study, a brain electrical stimulation device (StarStim, Neuroelectrics, Barcelona, Spain) and a robotic hand (Hand of Hope, Rehab-Robotics, Hong Kong) were applied. In each training session, HD-tDCS was conducted before EMG-RH training, where subjects received 20-minute personalized stimulation with the optimized stimulation montages, including a 1-minute ramp-up and ramp-down period. For the Sham-group, only ramp-up and ramp-down stimulation was applied.
After HD-tDCS, EMG-RH training was conducted for both groups. In each session, EMG-RH training involved three blocks with 15 min of training in each block. Between two blocks, subjects took 5 min of rest. During EMG-RH, the EMG signals collected from voluntary contraction of the FD and ED muscles were used to trigger the active powered assistance for grasping and opening of the robotic hand, respectively. Movements were triggered when the EMG level exceeded pre-set threshold (10% of the Maximal Voluntary Contraction (MVC) measured before each session), at which our chronic stroke participants could comfortably and consistently trigger the activation of the robotic hand with their residual EMG during voluntary contraction. The threshold can be adjusted based on the participant’s performance and feedback to meet the best intervention effect adjusted by our experienced staff. Each power-assisted movement would take 5 s to complete. During the assistive training, subjects were instructed to keep contracting muscles until the robot hand stopped, and then perform the next movement following the instruction on the screen (Fig. 2d). The repetitions of both grasping- and opening-hand were between 100 and 180 times for each session. The details of the intervention protocol are demonstrated in Supplementary 1.3.
Outcome measuresTo evaluate the intervention effects on upper extremity motor function, the primary outcome was the FMAUE which measures motor skill, coordination, and speed of the UE. FMAUE consists of 33 items, each of which adopts a 3-point scoring system from 0 to 2 points, with a total score of 66 points [48]. The secondary outcomes included MAS for finger (MASf) and wrist (MASw), Action Research Arm Test (ARAT), and neuroimaging measures including tb-fMRI, EEG-EMG, and EMG assessments. Clinical assessments were conducted by a licensed physical therapist who was blinded from the training procedure and other evaluations.
Task-based fMRI analysisTo explore the interhemispheric activation pattern after the intervention, lateralization index (\(\:LI\)) during the ME tasks at Pre, Post, and 6 m Follow-up were computed. \(\:LI\) refers to the normalized difference between the number of activated voxels in the ipsilesional and contralesional hemispheres. The voxels located in the sensorimotor areas (motor, premotor, and somatosensory regions) were masked for the \(\:LI\) calculation [49]. The \(\:LI\) value was computed using formula (1).
$$\:LI=\:\:\frac_\:-\:_}_\:+\:_}$$
(1)
where \(\:_\) stands for the number of activated voxels in the ipsilesional hemisphere. \(\:_\)stands for the number of activated voxels in the contralesional hemisphere. Therefore, the range of \(\:LI\) value was between − 1 and 1. A LI value of 1 represents the activation lies purely in the ipsilesional hemisphere and − 1 represents the activation purely relies on the contralesional hemisphere.
To investigate how the stimulation affected the activation patterns after training, the Specificity was calculated to quantify the specificity of the HD-tDCS by using the simulated EFs and the tb-fMRI activation maps at Pre, Post, and 6 m Follow-up according to formula (2).
$$\:_=\frac__|_\right)}\times\:__|_\right)}\right)}__|_\right)}+__|_\right)}}$$
(2)
where subscripts i and j denote the individuals and evaluation sessions respectively. \(\:_\) represents the electric field of subject i, \(\:_\) represents the activation mask of subject i in j evaluation session. \(\:__\right)}\) represents the the proportion of activated regions that are stimulated by tDCS, and \(\:__|E\right)}\) represents the proportion of activation given the stimulated regions. Specificity value ranges from 0 to 1, and measures how well the simulated EFs and tb-fMRI align with each other. A value 1 representing a perfect overlap between the EF and activation map, and value 0 representing no overlapping. The calculation of \(\:LI\) and Specificity were detaily illustrated in Supplementary 1.4.
EEG-EMG measurement and cortico-muscular coherence (CMC)To evaluate the connection between the central neural system and peripheral muscles during motor tasks, EEG-EMG assessments were conducted at Pre, Post, and 6 m Follow-up assessments for each subject. During the data acquisition, the 128-channel Neuroscan amplifier (SynAmps2, Neuroscan Inc, Herndon, USA) was used to collect EEG and EMG signals, and a 128-channel Quik-Cap EEG cap was used. Two pairs of bipolar EMG electrodes were carefully placed over the affected FD and ED muscles. The EEG and EMG data were simultaneously collected from two motor tasks: isometric contraction of the grasping and opening paretic hand, each task lasted around 5 min, including 3 contraction trials with each trial lasting 40 s and two 1-minute intermediate breaks. Subjects were instructed to maintain a steady 30% MVC contraction. An online EMG feedback interface was shown in front of subjects to ensure muscle contraction stability (Supplementary Fig. 1.2).
After data acquisition, the time-aligned EEG and EMG signals were offline processed and CMC parameters were calculated (See details in Supplementary Methods 1.5). Cortico-muscular coherence (CMC) reflects the functional connection between cortical and muscles based on the spectral correlation between EEG and EMG signals [50]. The magnitude-squared coherence spectrum was calculated based on the power spectral density estimation with formula (3),
$$\:_\left(F\right)=\frac_^}_\left(f\right)_\left(f\right)\:}$$
(3)
where \(\:_\left(f\right)\) and \(\:_\left(f\right)\) were the auto-power spectral density (PSD) of EEG and EMG signals (represented as X and Y) throughout segments for a given frequency f, and \(\:_\left(f\right)\) is the cross-power spectral density between them [51]. The CMC values range from 0 to 1, with higher values indicating stronger cortico-muscular interaction.
For chronic stroke survivors, the CMC-related motor function might shift away from the ipsilesional M1 area as reported in previous studies [52]. To mitigate this effect, a cluster of five channels (C4, FCC4H, FCC6H, CCP4H, and CCP6H) located at the primary motor cortex, was selected as the target region. The frequencies of interest were defined in Alpha band (8–13 Hz), Beta band (13–30 Hz), and low Gamma band (30–45 Hz). The CMC value was defined as the “Peak” coherence, namely the largest coherence in the given frequency band. The CMC topographies generated at the peak-CMC-relative frequency from selected channels were averaged in different frequency bands at three evaluation sessions. Two CMC parameters were computed, including CMC value of FD during grasping hand (\(\:_\)) and CMC value of ED during opening hand (\(\:_\)). The detailed description of EEG-EMG set-up, procedures, and preprocessing were demonstrated in Supplementary 1.5.
EMG assessmentMuscle activation was measured using EMG. During assessments, participants were instructed to perform unassisted, repetitive, full-hand grasping and opening with a comfortable muscle contraction. At the same time, EMG signals were recorded from FD and ED. The co-contraction index (CI) was calculated during grasping and opening tasks between FD and ED as computed with formula (4):
$$\:_=\:\frac_^_\left(t\right)dt$$
(4)
where \(\:_\) was the overlapping activity of normalized EMG linear envelopes for the FD/ED muscle pair during the movement k (i.e. hand grasping and opening), and T was the length of the signal. The CI of FD/ED muscle varied from 0 (no overlapping of muscle contractions) to 1 (complete overlapping of two maximal muscle contractions with both EMG activation levels kept at 1 during relative movement). A higher CI value indicates enlarged co-contraction phase of two muscles, which leads to less energy-efficient movement, whereas a lower CI suggests improved muscle coordination [53, 54]. The details of EMG assessments are demonstrated in Supplementary 1.6.
Statistical analysisStatistical analysis was performed using SPSS 20 (IBM, Armonk, NY, USA). Violin plots with mean and standard deviation were used to demonstrate the variables. MASf and MASw were reported as sum of flexion and extension of fingers and wrist, respectively. Intention-to-treat analysis was used to handle the missing data. The Shapiro-Wilk test was used to check data distribution properties. The demographic and baseline characteristics were compared between two groups using t-test (or Mann-Whitney U test) or Fisher exact tests. For normally distributed datasets, two-way repeated measures analysis of variance (ANOVA) was performed to explore the effect of time (Pre, Post, and 6 m Follow-up), group (HDtDCS-group and Sham-group), and time × group interaction. Then paired t test was used for within-group multiple comparison. Partial Eta Squared (η2) and Cohen’s d value were reported to demonstrate the effect size [55]. η2 greater than 0.138 represented a large effect. η2 greater than 0.059 represented a moderate effect, and η2 greater than 0.01 represented a small effect. For non-parametric datasets, the Friedman test was applied for repeated measurements and the Wilcoxon’s signed-rank test was used for multiple comparisons, in addition, the effect size (rank biserial correlation, r) was calculated from the z-value of the Wilcoxon signed-rank test. Within-group comparisons were performed for the outcomes, including Pre vs. Post, Pre vs. 6 m Follow-up, and Post vs. 6 m Follow-up. The alpha level for significance was set at P < 0.05. Bonferroni correction was used when investigating multiple within-group comparisons, resulting in P < 0.0166 as the significance threshold [56].
留言 (0)