
記住我
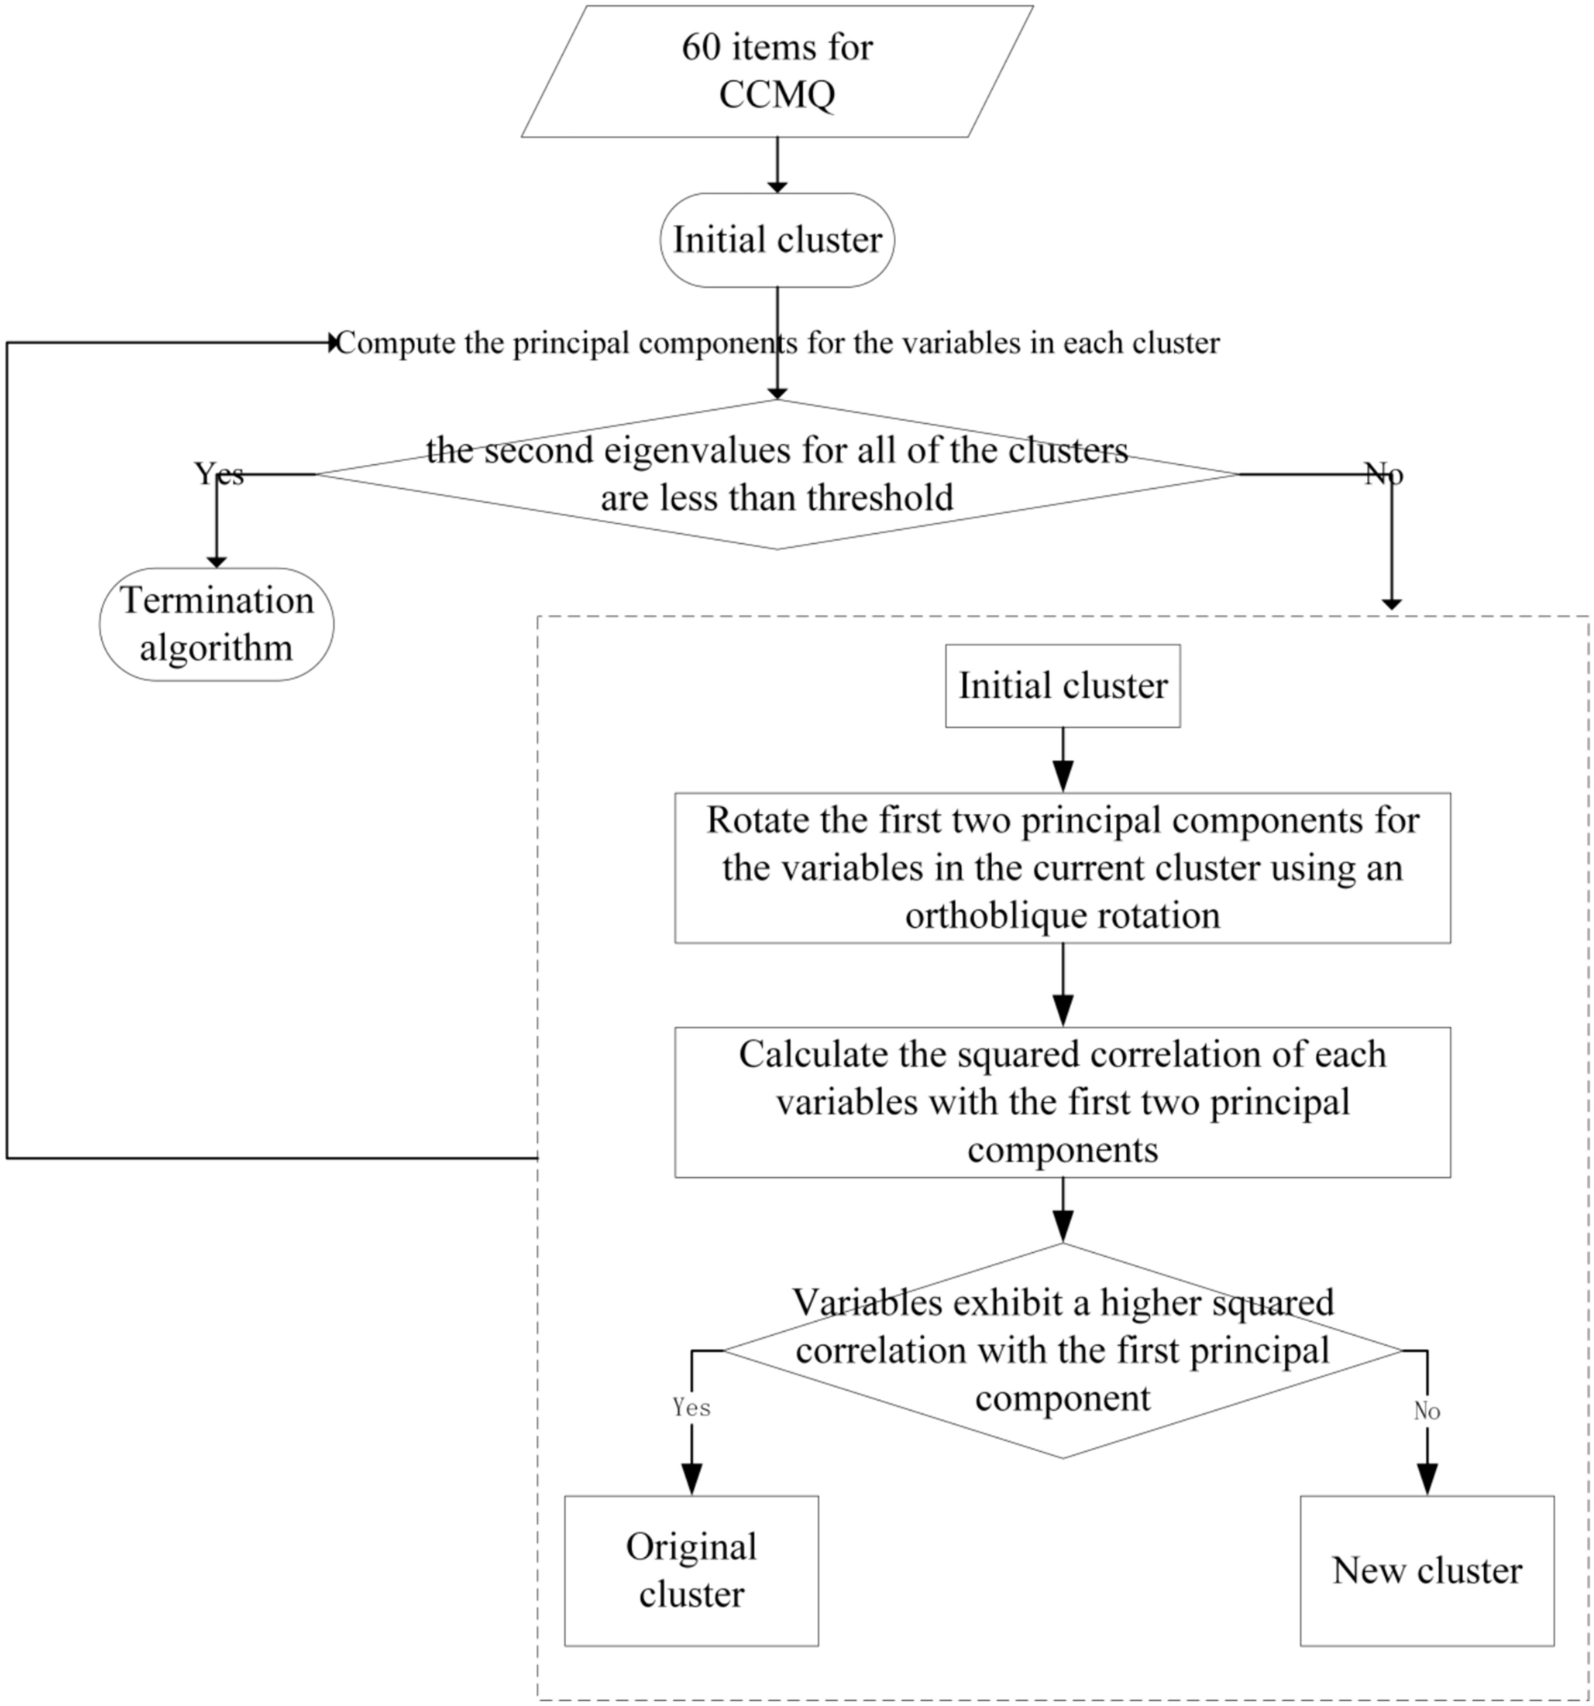


Figure 2 shows that the scores for the eight biased BCs exhibit a pronounced left-skewed distribution. Among the seven biased BCs (i.e., QDC, YaDC, YiDC, PDC, DHC, BSC, and QSC), there was a greater number of individuals in the 20–50 score range.
Fig. 2
Distribution of scores for the BCs
Only 13.66% of the population exhibited GTC, 36.15% were classified as QDC, 30.34% as YaDC, 20.02% as YiDC, 25.07% as PDC, 27.83% as DHC, 22.66% as BSC, 27.08% as QSC, and 8.51% as SDC. It should be noted that some individuals may exhibit multiple biased BCs simultaneously.
Item selection based on automated machine learningThe optimal performance of the supervised machine learning item selection models, utilizing BC classifications as the dependent variable across various item combinations, is presented in Table 1, with the corresponding algorithms detailed therein. Figure 3 illustrates the improvement in the AUC for the optimal item combinations for predicting each BC classification.
Table 1 The optimal item combinations for BC classifications as the dependent variable and their corresponding algorithmsFig. 3
AUC for different item combinations. Note. For the GTC, QDC, YaDC, YiDC, PDC, DHC, BSC and SDC, elbow points were selected where the item combination maximized the improvement in the AUC. For QSC, the curve was relatively smooth, so we selected the item combination with the fewest number of items when the AUC exceeded 0.8
For all models except the QSC model, the AUC plots revealed elbow points for either two or four items: GTC: item 2 (i.e.,tiredness; abbreviated form throughout; items, questions, and question abbreviations are provided in Table S1), item 8 (i.e., depression), item 21 (i.e., cold intolerance), item 27 (i.e., forgetfulness); QDC: item 3 (i.e., breathlessness), item 6 (i.e., quietude); YaDC: item 19 (i.e., cold aversion), item 52 (i.e., cold sensitivity); YiDC: item 20 (i.e., localized hotness), item 35 (i.e., dryness); PDC: item 49 (i.e., sticky mouth), item 50 (i.e., flabby abdomen); DHC: item 39 (i.e., oily skin), item 59 (i.e., urethral heat); BSC: item 40 (i.e., hyperpigmentation), item 43 (i.e., dark circles); and SDC: item 24 (i.e., chronic rhinitis), item 31 (i.e., urticaria). Remarkably, the QSC model achieved the predefined threshold of AUC = 0.8 with the inclusion of only one item (item 9: anxiety). The selected items achieved AUC values ranging from 0.857 to 0.946 (shown in Table 3). In general, predictive models are considered excellent when their AUC values fall between 0.8 and 0.9 and outstanding when they exceed 0.9 [21]; therefore, all these models demonstrated excellent predictive performance, with some even reaching outstanding levels. Additionally, the accuracy and F1 scores of these models' predictions were calculated, with accuracy values ranging from 0.819 to 0.936 and F1 scores ranging from 0.417 to 0.807.
Table 2 presents the optimal performance of the supervised machine learning item selection models with the BC score as the dependent variable. Figure 4 demonstrates the improvement in R2 performance for these optimal models.
Table 2 The optimal item combinations for the BC score as the dependent variable and their corresponding algorithmsFig. 4
R2 for different item combinations. For YaDC, an elbow point was selected where the item combination maximized the improvement in the AUC. For GTC, QDC, YiDC, PDC, DHC, BSC, QSC and SDC, the curves were relatively smooth, so we selected the item combination with the fewest number of items when the AUC exceeded 0.8
In Fig. 4, a clear elbow point is shown for the YaDC model with a two-item combination (item 19: cold aversion and item 52: cold sensitivity). Other BC score predictive models did not exhibit significant elbow points. Accordingly, the item combinations for the final BC scores prediction were selected from the models with an R2 exceeding 0.8 that used the fewest predictors. Specifically, the models for GTC, QDC, YiDC, PDC, DHC, and BSC included the first four items (GTC: item 2: tiredness, item 8: depression, item 21: cold intolerance, item 53: adaptability; QTC: item 3: breathlessness, item 5: dizziness, item 6: quietude, item 26: hyperhidrosis; YiDC: item 20: localized hotness, item 44: dry eyes, item 46: thirstiness, item 57: constipation; PDC: item 15: lethargy, item 28: oily T-zone, item 49: sticky mouth, item 50: flabby abdomen; DHC: item 39: oily skin, item 48: bitter mouth, item 56: sticky stools, item 60: wet scrotum/yellowing leukorrhea; BSC: item 27: forgetfulness, item 37: pain, item 40: hyperpigmentation, item 43: dark circles, respectively). Meanwhile, the QSC and SDC models incorporated the first three items (QSC: item 9: anxiety, item 10: vulnerability, item 14: sighing; SDC: item 24: chronic rhinitis, item 30: allergies, item 34: dermatographism, respectively), aligning with this criterion. For predicting BC scores, the models yielded R2 values ranging from 0.785 to 0.879 (shown in Table 3). According to general guidelines that R2 values of 0.75 and 0.50 are considered substantial and moderate, respectively, of predictive performance [20], all of these models had excellent predictive capacities. The range of RMSE values for these models was between 6.241 and 9.877, and the MAPE values ranged from 10.868 to 39.337.
Table 3 Evaluation of the automated machine learning results based on the appropriate supervised machine learning methodsItem selection based on the unsupervised machine learning algorithmFor all possible numbers of clusters, the average variance contribution of all representative items within their respective clusters is illustrated in Fig. 5. When the number of clusters was set to 29, the representative items accounted for 80% of the variance within each cluster, on average. To further assess the predictive capability of these items for BC classification or score, the appropriate supervised machine learning models were constructed by TPOT, with these 29 items as independent variables and BC classifications or scores as dependent variables. The specific predictive algorithms and their corresponding performances are detailed in Table 4.
Fig. 5
The average variance contribution of the representative items
Table 4 Evaluation of varclus results based on the appropriate supervised machine learning methodsIn terms of predicting BC classifications, the selected items achieved AUC values ranging from 0.847 to 0.965, prediction accuracies ranging from 0.820 to 0.950 and F1 scores from 0.294 to 0.858. For predicting BC scores, the models yielded R2 values from 0.549 to 0.888, RMSE values from 5.602 to 12.135 and MAPE values from 14.470 to 48.239 (shown in Table 4). According to the criteria mentioned above [20, 21], most models exhibited outstanding predictive performance, while a few were considered to have moderate predictive capability.
Comparison between automated machine learning and unsupervised machine learningWe conducted three types of item selection procedures from the CCMQ: items selected by automated machine learning algorithms with classifications as the target variables, items selected by automated machine learning algorithms with scores as the outcome variables, and representative items selected by unsupervised learning. Figure 6A illustrates the frequency of items selected based on the three types of item selection procedures. As shown in Fig. 6A, item 2 (i.e., tiredness), item 6 (i.e., quietude), item 19 (i.e., cold aversion), item 20 (i.e., localized hotness), item 27 (i.e., forgetfulness), item 39 (i.e., oily skin), item 43 (i.e., dark circles), item 50 (i.e., flabby abdomen), and item 52 (i.e., cold sensitivity) were consistently chosen by these three types of item selection procedures, indicating that they contain multiple pieces of information, including associations with BC classifications and scores, as well as relationships with other items. Additionally, the supervised machine learning algorithms consistently selected item 3 (i.e., breathlessness), item 8 (i.e., depression), item 9 (i.e., anxiety), item 21 (i.e., cold intolerance), item 24 (i.e., chronic rhinitis), item 40 (i.e., hyperpigmentation), and item 49 (i.e., ticky mouth) for predicting BC classifications and scores. Different from the items selected by the supervised machine learning algorithms, the varclus algorithm selected item 16 (i.e., palmar-plantar hot), item 22 (i.e., susceptibility to colds), item 23 (i.e., frequent sneezing), item 25 (i.e., sensitivity cough), item 29 (i.e., reddened lips), item 33 (i.e., unexplained bruising), item 36 (i.e., facial telangiectasia), item 51 (i.e., excess phlegm), item 55 (i.e., cold-induced diarrhea), and item 58 (i.e., thick tongue coating) to predict the BC classifications or scores.
Fig. 6
Comparison of prediction performance using the appropriate supervised machine learning for items selected based on TPOT and varclus. A The frequency of items selected based on TPOT and varclus. B Performance of items selected based on TPOT and varclus in predicting BC classifications using the appropriate supervised machine learning method. C Performance of items selected based on TPOT and varclus in predicting BC scores using the appropriate supervised machine learning method. In C, the RMSE measure is represented as RMSE/RMSEmax, and the MAPE is represented as MAPE/MAPEmax
In the prediction of classifications, the items selected based on TPOT and those selected by varclus, using the appropriate prediction models, demonstrated similar AUCs, accuracies and F1 scores (Fig. 6B). However, except for the GTC model, TPOT selected fewer items for the biased BC classifications compared to varclus.
In the prediction of scores for BC, such as GTC, PDC, DHC, QSC, and SDC, the items selected based on TPOT demonstrated notable advantages in comparison with those selected by varclus (Fig. 6C). However, in the prediction of scores for BC types such as QDC and YaDC, selections made by varclus and its corresponding predictive algorithms exhibited superior performance. For the YiDC and BSC score predictions, the performances of the items chosen by TPOT and varclus were similar. Overall, while the number of items selected by TPOT and varclus remains similar, the selections made by TPOT yield a higher average R2 and lower average RMSE and MAPE.
留言 (0)