Subjects and data
The included subjects were above the age of 18 years with known CYP2D6 genotype and a history of therapeutic drug monitoring (TDM) of risperidone and 9-hydroxyrisperidone serum concentrations following oral administration of risperidone. Data were collected from routine clinical analyses of patient samples performed at the Center for Psychopharmacology, Diakonhjemmet Hospital (Oslo, Norway) between 2005 and 2022.
Dosing regimen and pharmacokinetic sampling
The TDM requisition forms filled out by the treating physician specified information on dosing history and time between last dose and blood sampling. Samples were considered only if this information was clearly provided. The requisition form suggests blood sampling 12 to 24 h after the last dose as recommended for antipsychotics [25]. To increase the sample size, samples taken between 9 and 30 h after the last dose were eligible for inclusion. Samples were included regardless of dose and dosing frequency (i.e., once- or twice-daily risperidone) as the individual dosing history was specified in the dataset for pharmacokinetic analysis. The TDM samples were assumed to be taken at steady state unless otherwise recorded on the requisition forms.
Samples were excluded if the requisition form indicated concomitant use of the CYP2D6-inhibiting drugs paroxetine, fluoxetine, or bupropion or the CYP3A-inducing drugs phenobarbital, phenytoin, or carbamazepine, or if long-acting formulations of risperidone or 9-hydroxyrisperidone (paliperidone) had been injected during the last 9 months.
Serum concentration analysis
Serum concentration analysis of risperidone and 9-hydroxyrisperidone was carried out as part of the routine therapeutic drug monitoring service at the Center for Psychopharmacology. The method was based on ultrahigh-performance liquid chromatography high-resolution mass spectrometry (UHPLC-HRMS). Briefly, serum samples were purified by protein precipitation mixing 200 μL of serum aliquot with 400 μL of acetonitrile-methanol (90/10 vol/vol), which included the isotope-labelled internal standards. Following centrifugation, the supernatants were diluted 1:1 with ultrapure water, and 4 μL of purified sample was then injected into a Vanquish Binary UHPLC system coupled to a Q Exactive Orbitrap HRAM MS with electrospray ionization operated in positive ionization mode (Thermo Scientific, Waltham, MS, USA). Chromatographic separation was performed on a XBridge BEH C18 column (2.5 μm, 2.1 × 75 mm; Waters). The mobile phase gradient comprised a mixture of acetonitrile and ammonium acetate buffer (pH 4.8).
All the calibration curves were linear (R2 > 0.99) in validated ranges: risperidone, 1–200 nmol/L; 9OH-risperidone, 2.5–300 nmol/L. Imprecision and inaccuracy parameters of the assays were lower than 15%. The lower limit of detection was 0.4 nM for risperidone and 1 nM for 9-hydroxyrisperidone, and concentrations above this limit were reported and available for pharmacokinetic modelling analysis. During population modelling, values below the detection limit were handled by imputing the half of the lower limit of detection due to a proportion of < 10% [26, 27].
Pharmacogenetic analyses
Genotyping of CYP2D6 had previously been performed by TaqMan-based real-time PCR assays implemented for routine pharmacogenetic analysis at the Center for Psychopharmacology. The routine panel for CYP2D6 genotyping included the null alleles CYP2D6*3 (rs35742686), CYP2D6*4 (rs3892097), CYP2D6*5 (whole gene deletion), and CYP2D6*6 (rs5030655) and the reduced function alleles CYP2D6*9 (rs5030656), CYP2D6*10 (rs1065852), and CYP2D6*41 (rs28371725), as well as copy number analysis to identify multiplication of the CYP2D6 gene giving rise to ultrarapid metabolism.
In addition to CYP2D6 variant alleles, other gene variants or haplotypes may also affect risperidone clearance, including a variant in the gene encoding the nuclear factor I B (NFIB), which has been shown to regulate the expression of the CYP2D6 gene [28, 29], and CYP3A4*22, which may alter CYP3A4-mediated risperidone clearance [30].
To get a better coverage of variant alleles that may affect risperidone clearance, the DNA samples were reanalyzed with predesigned TaqMan-based real-time PCR assays (Thermo Fisher Scientific, Waltham, MA, USA) to detect CYP2D6*2 (rs16947; C__27102425_10), CYP2D6*35 (rs769258; C__7102444_F0), rs5758550 (C_29692254_10), NFIB (rs28379954; C_59359617_10), and CYP3A4*22 (rs35599367; C__59013445_10). Subjects carrying CYP2D6*2 and rs5758550 G and A were defined as carriers of haplotypes CYP2D6*2-rs5758550G and CYP2D6*2-rs5758550A, respectively.
Exploratory data analysis
Initially, the metabolic ratios (MR) between the measured 9-hydroxyrisperidone and risperidone concentrations were calculated at each observation and considered a raw data-based approximation of enzyme activity. The relationship between the various CYP2D6 diplotypes and the median MR for each subject was visually explored using box plots and by pairwise comparisons using the Mann–Whitney U test. Any apparent relationship between CYP2D6 allele or haplotype and risperidone clearance was then quantified using population pharmacokinetic modelling of all data observations.
Population pharmacokinetic modelling
The time courses of risperidone and 9-hydroxyrisperidone serum concentrations were analyzed using population pharmacokinetic modelling (i.e., non-linear mixed effects modelling). The model was developed to simultaneously describe the pharmacokinetics of the parent and the metabolite and to quantify parameter variability and covariate effects.
Structural and stochastic model
The structural model consisted of one compartment for risperidone (parent) and one compartment for 9-hydroxyrisperidone (metabolite), both with linear elimination. Due to the sparsely sampled data, additional compartments were not considered. The absorption of risperidone into the first compartment was described using a first-order absorption rate constant fixed to a previously reported value of 2.01 h−1 [31]. As only data after oral administration were available, the oral bioavailability (F) of risperidone and the fraction of risperidone converted into 9-hydroxyrisperidone (fmet) were not identifiable, and the reported disposition parameters of the parent and metabolite are therefore reported as apparent values (e.g. CL/F, CLmet/[F × fmet]) [32].
Between-subject variability (BSV) was estimated for the clearance parameter of both the parent and metabolite using exponential models:
where CLi is the risperidone or 9-hydroxyrisperidone clearance for the ith individual, and ηiCL denotes the difference between individual and population typical value (TVCL), which was assumed normally distributed with mean zero and variance ωCL2. The correlation between the individual clearances of risperidone and 9-hydroxyrisperidone was also estimated, while no BSV was estimated for the volume of distribution parameters due to the sparse sampling design. BSVs are reported as coefficients of variations, calculated as the square root of e(ω2−1). The residual variability in concentration measurements (one submodel for each analyte) was initially modeled using combined additive and proportional error structures:
$$}_=}_ \left(1+ _\right)+ _$$
where Obsij is the jth observed concentration in the ith individual, Predij is the corresponding model prediction, and ε1 and ε2 are random error terms with means of zero and variances of σ12 and σ22, respectively. The residual error was considered simplified into proportional or additive submodels based on parameter estimate values and parameter significance levels.
Covariate model
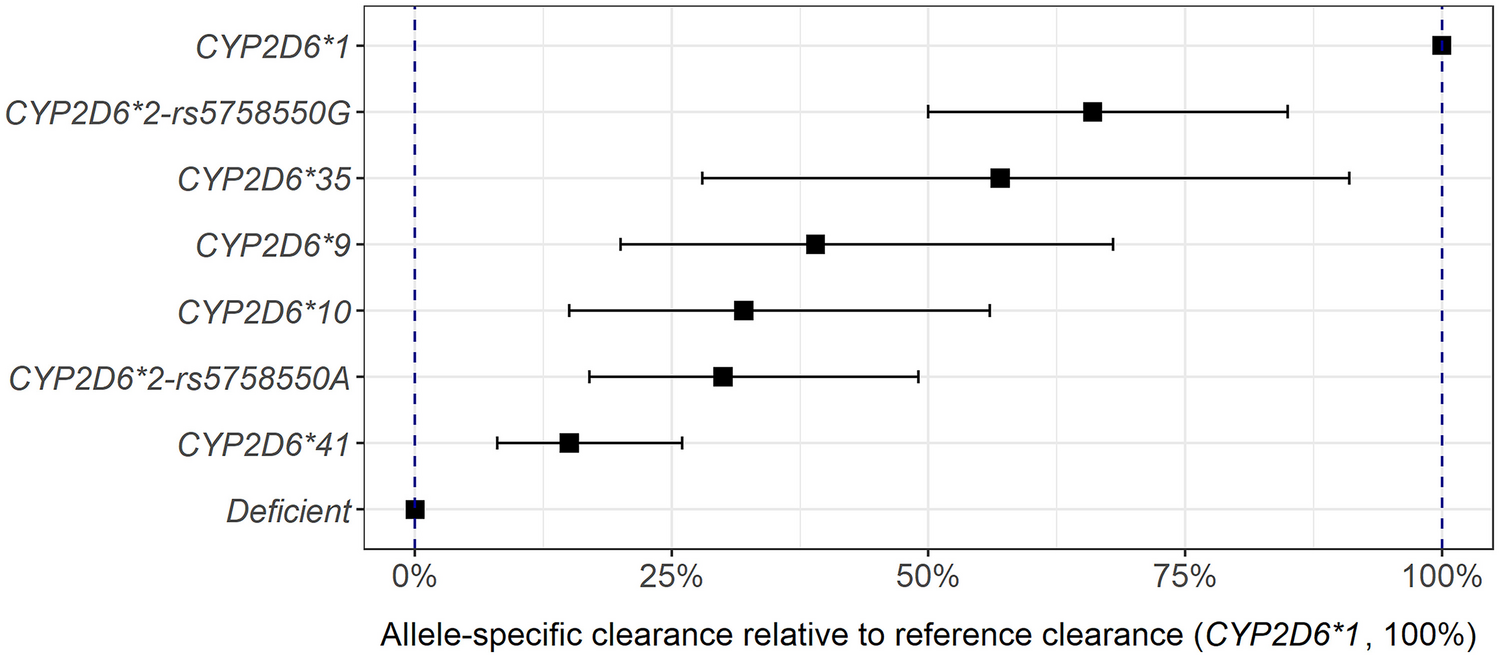
To evaluate the effect of the various CYP2D6 genotypes on risperidone clearance (CL), the clearance of risperidone was modeled as the sum of a CYP2D6-independent clearance term (base clearance: CLbase) and the estimated clearances attributable to each of the CYP2D6 alleles determined for the subject:
$$}_}= }_}+ }_2\text6\text1}+ }_2\text6\text2}$$
As an example, the total risperidone clearance for a subject with CYP2D6 diplotype of *1/*35 was predicted by the sum of the estimated parameters CLbase, CLCYP2D6*1, and CLCYP2D6*35. Allele-specific clearances for CYP2D6*2 (subsequently subdivided into new haplotypes based on rs5758550A/G), *9, *10, *35, and *41 relative to CYP2D6*1 were estimated, while the contribution to risperidone clearance from the deficient CYP2D6 alleles *3, *4, *5, and *6 was a priori fixed to zero. Further, NFIB genotype was tested as a covariate on total clearance or CYP2D6-mediated clearance, and gene variation in CYP3A4 was tested as a covariate on the base clearance term (which is expected to be primarily mediated by CYP3A4). Heterozygous and homozygous carriers of CYP3A4*22 and the NFIB-C variant allele were merged due to minor proportions of homozygous carriers. In cases of unknown CYP3A4 or NFIB genotype, the unknown genotype was tested either as a distinct covariate category or grouped together with the wildtype genotype.
In addition to gene variation, sex and age were evaluated as covariates on the clearance of risperidone. Sex and age were also evaluated on volumes of distributions and clearance of 9-hydroxyrisperidone, which has primarily renal elimination and is not a substrate for the enzymes under evaluation. Categorical covariates were evaluated by estimating the relative change in the pharmacokinetic parameter compared with the reference group. The impact of continuous covariates (i.e., patient age) was initially visually explored by estimating the relative change in the pharmacokinetic parameter of interest across age bins defined as 18–29 years, 30–39 years, 40–49 years, and so on. The relationship was then described in the final model using a mathematical function mimicking the observed relationship with age as a continuous covariate, such as linear, exponential, power, or piecewise linear functions.
The assessment of covariate relationships was undertaken using the forward inclusion and backward elimination procedure, which involves stepwise including the covariate with largest improvement in model fit for each round of covariate search until no more covariates significantly improve the model fit [33]. During the inclusion of covariates, p < 0.05 was used as the significance level, while during the backward elimination of covariates from the full covariate model, a more stringent significance level of 0.01 was required for the covariate to be retained in the final model.
Model evaluation
Model selection was primarily based on the differences in objective function value (ΔOFV), where ΔOFV of ≥ 3.84 when adding one parameter corresponds to a p-value of < 0.05 (χ2 distribution, 1 degree of freedom). Models were also evaluated by inspecting standard goodness-of-fit plots (observed vs. predicted concentrations and conditional weighted residuals vs. predicted concentrations and time after dose), prediction-corrected visual predictive checks (pcVPCs, generated from 1000 simulations) [34], biological plausibility of the parameter estimates and parameter uncertainty (95% confidence intervals derived from 5000 non-parametric bootstrap replicates) [35]. Finally, the observed metabolic ratios that were used for the initial exploratory analysis were overlaid with the model-predicted typical metabolic ratio in each CYP2D6 diplotype group.
Software and estimation method
Population pharmacokinetic modelling was performed using the non-linear mixed effects modelling software NONMEM (v. 7.5.1, ICON Development Solutions, Hanover, MD, USA) with the first-order conditional estimation method with interaction (FOCE-I). Piraña [36] was used as graphical user interface. Data management, model evaluation, and graphical assessments were assisted by the R software, v. 4.2.1 [37], and the Perl-Speaks-NONMEM (PsN) toolkit [38].
Haplotype analysis
Variants in high linkage disequilibrium (LD) with rs5758550 were assessed using LD-link [39]. LD-link is based on whole-genome sequence (WGS) data from 2504 individuals in the 1000 Genomes Project. The European cohort (EUR n = 503, i.e., 1,006 alleles) was used as a reference population for the haplotype assessment in this study. Variants with high LD (R2 values > 0.85) together with the SNPs identifying CYP2D6*2, CYP2D6*35, and CYP2D6*41 (rs16947, rs1135840, rs769258 (*35), rs28371725 (*41)) were used for haplotype analysis.


留言 (0)