
記住我

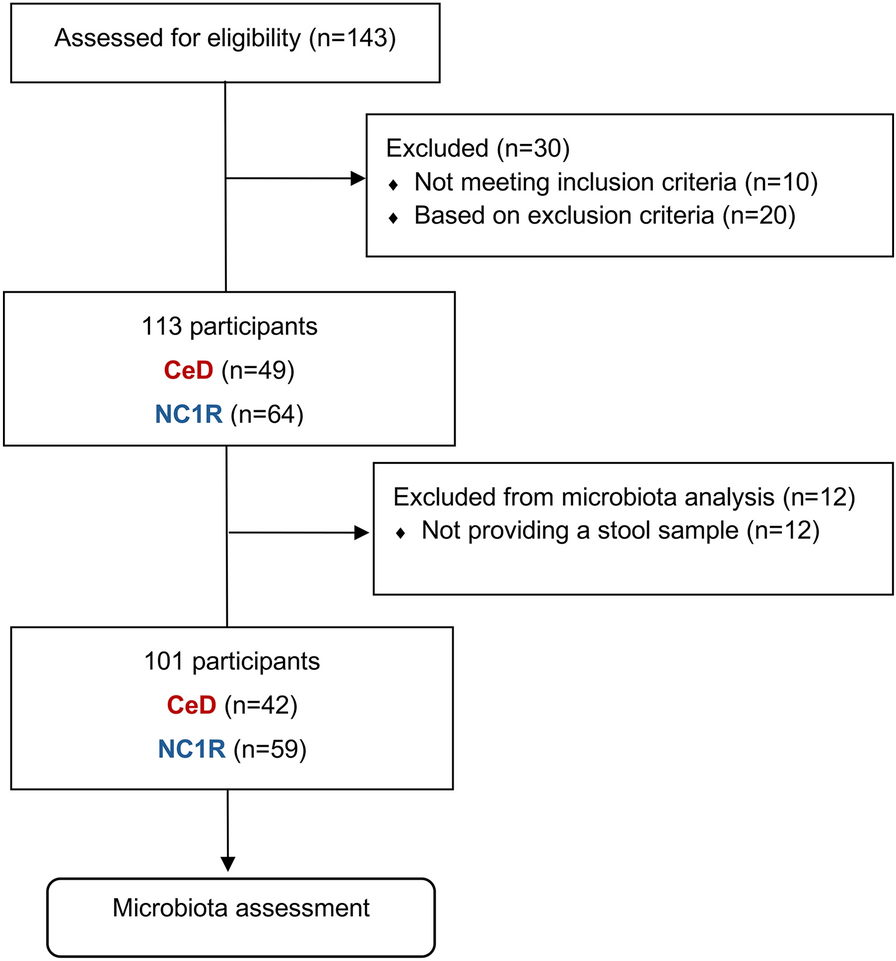


This study included 131 patients with moderately to severely active UC, who were administered ADA, and 40 healthy controls (HC). The mean age of the HC was 40.6 years, and 42.5% were men. Table 1 summarizes the baseline clinical characteristics of patients with UC. The mean age of the patients with UC was 44.7 years (range: 18–74 years), and 35.1% of the patients were men. Statistical analysis showed no significant difference in the proportion of males between healthy controls (HC) and patients with UC, indicating that the gender variable did not significantly influence the microbiome findings. The baseline mean Mayo and endoscopic subscores were 8.7 and 2.5, respectively. The clinical response rates were 52.1% (29/146) and 37.7% (36/146) at weeks 8 and 56, respectively. The clinical remission rates were 24.0% (35/146) and 22.0% (32/146) at weeks 8 and 56, respectively [19]. Clinical outcomes were assessed for 146 patients, while fecal samples for microbiome analysis were available from 131 patients.
Table 1 Baseline demographic and clinical characteristics of participantsAnalysis of the gut microbiota between HC and patients with UC at baselineDNA was extracted and sequenced from 244 samples (99, 100, and 45 samples at 0, 8, and 56 weeks, respectively) of 131 patients with UC and 40 samples of HC. The results on diversity showed a significant reduction in Shannon diversity and Faith’s phylogenetic diversity in patients with UC compared to HC, while there was no significant difference in Simpson’s evenness. This suggests that UC is associated with both a loss of species diversity and a reduction in phylogenetic richness. However, the impact of UC may not extend to the dominance structure of the bacterial communities. Principal component analysis of beta diversity showed significantly different clustering between the HC and UC groups (ANOSIM, R = 0.369, P = 0.001) (Fig. 1A). LEfSe was used to identify important bacterial taxa that contributed to classifying HC and patients with UC. ASVs related to the Bacilli, Peptostreptococcaceae, Lactobacillus, and Bifidobacterium were predominant in patients with UC (Fig. 1B).
Fig. 1
Characterization of the gut microbiome of healthy controls (HC) and patients with ulcerative colitis (UC) at baseline (week 0). A Biodiversity was calculated using Shannon’s diversity, Faith’s phylogenetic diversity, and Simpson’s evenness indices. Principal coordinate analysis (PCoA) plot of the microbiome profile of all participants was conducted using Unifrac unweighted distance matrix. The statistical significance of alpha diversity was tested using the non-parametric Wilcoxon rank sum test (*P < 0.05; **P < 0.01, ***P < 0.001), and the PCoA was evaluated using the analysis of similarities (ANOSIM) test. B Heatmap showed the significantly different amplicon sequence variants (ASVs) obtained from the linear discriminant analysis effect size (LEfSe) analysis. Only linear discriminant analysis scores > 3.2 are shown in this figure. Relative abundance was normalized to a Z-score,to show relative changes across the samples. Blue on the heat map indicates low abundance and red indicates high abundance. The row represents the taxonomic classification level from phylum to species of ASV, and the column is each sample
No significant differences were observed in alpha diversity and beta diversity based on the severity and extent of the disease (see figure, Supplementary Data Content 1). To determine the differentially abundant ASVs in HC and patients according to the severity and extent of UC, we conducted a LEfSe analysis. The 20 ASVs showing higher abundance in patients with severe UC included ASVs belonging to Bacilli, Sporosarcina, Streptococcus thermophilus TH1435, Pediococcus, and E. coli. Extensive colitis bacteria are characterized by a high abundance of ASVs, including Blautia (ASV5214), Lactobacillus (ASV3095), Peptostreptococcus (ASV6142), and Bacilli (ASV2551) (see figure, Supplementary Data Content 2).
A significant difference was observed between patients with high (≥ 500 mg/kg) and low (< 500 mg/kg) [28, 29] FC levels (R = 0.092, P = 0.001). Baseline fecal samples were stratified based on high and low ADA drug levels (trough level, serum ADA drug level of 5 ug/mL), showing no significant differences in the gut microbiome between these groups (R = 0.031, P = 0.098) (see figure, Supplementary Data Content 3) [28, 29].
Dynamics and diversity of microbes throughout the course of ADA treatmentLEfSe analysis revealed significant differences in bacteria at each time point during the 56-week ADA treatment period (see figure, Supplementary Data Content 4).
To examine the dynamics and diversity of microbes throughout the course of ADA treatment, we classified samples based on the attainment of clinical remission at each time point. The distribution of samples is presented in the Supplementary Table (see table, Supplementary Data Content 5). Baseline samples were divided according to the attainment of clinical remission at week 8.
The bacterial diversity of HC was higher than that of all other groups, regardless of the time point and remission. The principal coordinate analysis plot revealed distinct gut microbiome differences between HC and remitters at week 8 (R = 0.184, P = 0.001), and significant differences were also observed between HC and remitters at week 56 (R = 0.208, P = 0.001) (Fig. 2A). Unlike non-remitters, baseline dissimilarities significantly decreased in remitters at week 8, with levels lower than those at week 56 (Fig. 2A). The dissimilarities between remitters were significantly different, whereas no significant difference was observed among non-remitters (Fig. 2A and B). Furthermore, a notable reduction in dissimilarities was observed among remitters at week 8 when compared to non-remitters at the same time point (Fig. 2C and D).
Fig. 2
Diversity and dissimilarity of the gut microbial community in each time point (week 0, 8, and 56) after adalimumab treatment to patients with ulcerative colitis (UC). Characterization of the gut microbiomes of remitters (A) and non-remitters (B) at each time point. Biodiversity was calculated using Shannon’s diversity and Faith’s phylogenetic diversity indices. Richness indices showed no significant difference based on the time point in patients with UC who showed clinical remission. Beta diversities comparing healthy controls (HC) and remitters (A) or non-remitters (B) at each time point and dissimilarities between the groups were calculated using Unifrac unweighted distance matrices. The comparison of dissimilarities between remitters was significantly different but not for non-remitters. Comparison of the gut microbiome of remitters and non-remitters at weeks 8 (C) and 56 (D)
After 56 weeks of ADA treatment, the gut microbiota composition of patients who achieved clinical remission showed distinct differences compared to that of HC. Figure 3 shows significantly different genera between 56-week remitters and HC, as confirmed by LEfSe analysis.
Fig. 3
Unique gut microbiome of patients with ulcerative colitis (UC) treated with adalimumab (ADA) at 56 weeks. Heatmap showing different gut microbiomes between healthy controls (HC), remitters (A), and non-remitters (B) who were treated with ADA and showed clinical remission or no remission at week 56 at the amplicon sequence variants (ASV) level. Relative abundance was normalized to a Z-score, and blue (lower) or red (higher) on the Z-score bar represents the calculated relative abundance. Each row represents the ASV, and the column represents each sample
We explored the distinctive microbes identified in remitters at each time point and examined the changes in their abundance. In the baseline samples with remission at week 8, we noted an increase in Burkholderia-Caballeronia-Paraburkholderia, Staphylococcus, and Murdochiella; Lachnospiraceae UCG-008 in the remitters at week 8, and Bifidobacterium, Dorea, [Ruminococcus] torques group, and Lachnospiraceae FCS020 in the remitters at week 56 (Fig. 4A). Notably, decreased relative abundances were found in Burkholderia-Caballeronia-Paraburkholderia and Staphylococcus with time, and increased relative abundances of Bifidobacterium and Dorea in the remitters (Fig. 4B). However, in the non-remitters, the relative abundances of these four genera remained consistent across each time point, except for Burkholderia-Caballeronia-Paraburkholderia, which exhibited the highest abundance at baseline and the lowest at week 56.
Fig. 4
Distinctive microbes identified in remitters at each time point and changes in their abundance. A The x-axis is the linear discriminant analysis score from a linear discriminant analysis effect size (LEfSe) analysis, and the y-axis represents each significantly different genus. B The relative abundances of continuously increased or decreased genera over time in the gut microbiome of remitters and non-remitters. Two genera, Burkholderia-Caballeronia-Paraburkholderia and Staphylococcus, decreased in remitters, and two genera, Bifidobacterium and Dorea, increased in remitters with a change of time point. The x-axis indicates the group, including baseline, week 8, and week 56, and the y-axis indicates the relative abundance of each genus
Potential biomarker predicting clinical remission to ADA treatmentTo predict clinical remission following ADA treatment at week 8 using the gut microbiome, we compared different ASVs between remitters and non-remitters. We compared the ASV tables of baseline samples with and without remission at week 8 (Fig. 5A). The baseline samples of remitters at week 8 showed a higher abundance of 40 ASVs, including Sporosarcina (ASV2803), Bacteroides sp. (ASV1298, ASV1490), Enterobacter (ASV9330, ASV9332), Prevotella bivia DSM 20514 (ASV2051), [Eubacterium] sp. (ASV6247, ASV6259), and E. coli (ASV9259), than those of non-remitters. On the other hand, they showed a lower abundance of 8 ASVs, including Bifidobacterium (ASV236, ASV396, and ASV509), Blautia (ASV5128), Enterococcus (ASV2914 and ASV2922), Anaerostipes (ASV5000), and Lachnospiraceae (ASV4860).
Fig. 5
Amplicon sequence variants (ASVs) as biomarkers for predicting clinical remission at week 8. A Different 48 ASVs were identified by comparing baseline samples of week-8 remitters vs non-remitters (Linear discriminant analysis score 2.0). B Bar graph of the positive and negative ASVs related to remission to adalimumab (ADA) treatment in patients with ulcerative colitis (UC). The positive and negative ASVs were included in the 48 different ASVs shown in A. The positive ASVs were the ASVs highly found in the samples with a clinical remission shown in the upper part of the heat map, and the negative ASVs were found in the samples of non-remitters shown at the bottom of the heat map. Each bar represents the value obtained by the log ratio of the average relative abundance of positive ASVs/average relative abundance of negative ASVs. C The receiver operating characteristic curve (ROC-curve) based on the log ratio of Avg. relative abundance of positive ASVs/Avg. relative abundance of negative ASVs. Using the ROC function in the Epi package in the R v4.0.2, the ROC curve was plotted with the area under the curve (AUC)
Considering the 48 ASVs with high or low relative abundances in the baseline samples of patients in clinical remission at week 8, we identified the distribution of these ASVs. The mean relative abundance of positive ASVs at week 0 for a patient was divided by the mean relative abundance of negative ASVs (Fig. 5B). The log value was higher for remitters than for non-remitters. The log ratio of positive ASVs/negative ASVs for predicting remission at week 8 was 0.348, with a sensitivity of 65.5% and specificity of 91.4% on the ROC curve (AUC, 0.851; Fig. 5C). Similarly, we attempted to determine positive and negative ASVs and evaluate the effect of ADA on clinical remission at week 56 using baseline and week-8 samples (see figure, Supplementary Data Content 6). However, a prediction model was not obtained (data not shown).
留言 (0)