Expression vectors
Throughout the Methods, Aire indicates human Aire, unless mentioned otherwise. See the Supplementary Note for information on all expression vectors used in this study.
Cell culture and transfection
Sources of cell lines were generous gifts from Dan Stetson (University of Washington) and Diane Mathis (Harvard Medical School). 293T cells were maintained in DMEM supplemented with 10% FBS, 1% l-glutamine. 293T cells were transfected with polyethyleneimine (3.75 μg per well of a 6-well plate with 1.5 μg of DNA) or Lipofectamine 2000 (Invitrogen; 1 μg of DNA per well of a 12-well plate) according to the manufacturer’s protocol. 4D6 cells were maintained in RPMI supplemented with 10% FBS, 1% l-glutamine, and transfected with Lipofectamine 2000 or 3000 (Invitrogen) according to the manufacturer’s protocol (1 μg of DNA per well of a 12-well plate).
For inhibitor treatments, 4D6 cells were Dox-induced for indicated amounts of time. At 4 h before collection, Dox-treated cells for different assays and an equal volume of DMSO, A-485 (3 μM final concentration, Tocris Bioscience), dCBP-1 (0.25 μM final concentration, MedChemExpress), dBET6 (100 nM final concentration, MedChemExpress) or JQ1 (1 μM final concentration, Selleck Chemical) were added.
Stable 4D6 cell line generation is described in detail within the Supplementary Note. For each 4D6 clone, a Dox titration curve was used to determine the appropriate Dox concentrations to use to have similar expression levels of Aire-FLAG variants compared with WT Aire-FLAG expression with 1 μg ml−1 Dox. We used 1, 0.1, 0.1, 0.1, 0.05, 1 μg ml−1 Dox on 4D6 clones expressing Aire-FLAG K83E, G228W, C311Y, ΔCARD, ΔPHD1, ΔCTT, respectively. We used 1, 1 and 0.1 μg ml−1 Dox on 4D6 clones expressing Aire-FLAG ΔCTT.R1–R3, respectively. For ChIP–seq experiments with 4D6 cells treated with dCBP-1 for 4 h, 0.55 μg ml−1 Dox was used to induce the same expression levels of WT Aire as 4D6 cells treated with 1 μg ml−1 Dox + DMSO.
Antibodies
Antibodies used for IF microscopy were mouse anti-FLAG (M2, Sigma-Aldrich, cat. no. F1804), mouse anti-FLAG conjugated with FITC (M2, Sigma-Aldrich, cat. no. F4049), rabbit anti-p300 (D8Z4E, Cell Signaling Technology, cat. no. 86377S), rabbit anti-CBP (D6C5, Cell Signaling Technology, cat. no. 7389S), rabbit anti-MED1 (Novus Biologicals, cat. no. NB100-2574), Alexa Fluor 488 AffiniPure donkey anti-mouse IgG (Jackson ImmunoResearch, cat. no. 715-545-151), Alexa Fluor 647 AffiniPure donkey anti-rabbit IgG (Jackson ImmunoResearch, cat. no. 711-605-152). Antibodies used for immunoblotting were rabbit anti-beta-actin (Cell Signaling Technology, cat. no. 8457S), rabbit anti-HA (C29F4, Cell Signaling Technology, cat. no. 3724S), mouse anti-FLAG-HRP (M2, Sigma-Aldrich, cat. no. A8592), mouse anti-Lamin A (133A2, Cell Signaling Technology, cat. no. 86846), mouse anti-Histone H3 (Cell Signaling Technology, cat. no. 14269S), rabbit anti-Histone H3K27ac (D5E4, Cell Signaling Technology, cat. no. 8173S), rabbit anti-Histone H3K18ac (D8Z5H, Cell Signaling Technology, cat. no. 13998), rabbit anti-p300 (D8Z4E, Cell Signaling Technology, cat. no. 86377S), rabbit anti-CBP (D6C5, Cell Signaling Technology, cat. no. 7389S), rabbit anti-actyl-p300/CBP (Cell Signaling Technology, cat. no. 4771S), anti-rabbit IgG-HRP (Cell Signaling Technology, cat. no. 7074), anti-mouse IgG-HRP (Cell Signaling Technology, cat. no. 7076). Antibodies used for ChIP–seq were mouse anti-FLAG (M2, Sigma-Aldrich, cat. no. F1804), rabbit anti-Histone H3K27ac (D5E4, Cell Signaling Technology, cat. no. 8173S), rabbit anti-Histone H3K4me1 (D1A9, Cell Signaling Technology, cat. no. 5326S), rabbit anti-Histone H3K27me3 (C36B11, Cell Signaling Technology, cat. no. 9733S), rabbit anti-Histone H3K4me0 (Active Motif, cat. no. 91317), rabbit anti-p300 (D2X6N, Cell Signaling Technology, cat. no. 54062), spike-in antibody (Active Motif, cat. no. 61686).
CRISPR–Cas9 screening and analysis
The 4D6 cell line was transduced with lentiCas9-Blast (Addgene plasmid no. 52962)55, selected under 10 mg ml−1 blasticidin, and clones were picked for homogeneous Cas9 expression. Cas9-expressing 4D6 cells were transduced with FuGW-G5p-mKate2 (Addgene plasmid no. 105183)56 and selected clones were verified for UAS-mKate2 genomic insertion by PCR. Then, the Cas9 + UAS-mKate2-expressing cells were transduced with pInducer20-EGFP-P2A-Gal4DBD-mouse Aire CTT and picked clones with homogenous EGFP expression after 1 μg ml−1 Dox treatment were further verified for Aire CTT-dependent mKate2 expression by expressing sgRNAs that target mouse Aire CTT. See Supplementary Table 2 for sequences of PCR primers and sgRNAs used.
The engineered 4D6 cells were transduced with a lentiviral Human Brunello CRISPR knockout pooled sgRNA library (a gift from David Root and John Doench (Addgene no. 73178-LV)57) at a multiplicity of infection of 0.4, aiming for 500-fold representation of each sgRNA. Library-transduced cells were selected under 1 mg ml−1 puromycin for 2 d and further expanded for another 7 or 10 d. Cells were treated with 1 μg ml−1 Dox 24 h before sorting to induce EGFP-P2A-Gal4DBD-Aire CTT expression; then the top 5% and bottom 5% of the population were sorted based on mKate2/EGFP ratios on the SH800S Cell Sorter (Sony Biotechnology). Genomic DNA was extracted using DNeasy Blood and Tissue Kit (QIAGEN, cat. no. 69504) and cleaned using OneStep PCR Inhibitor Removal Kit (Zymo Research, cat. no. D6030). Sequencing libraries were generated by PCR amplification as described57, pooled at an equal molar concentration, purified using MinElute Reaction Cleanup Kit (Qiagen, cat. no. 28204) to enrich for 350–360-base pair (bp) amplicons and subsequently sequenced on an Illumina sequencing platform (GENEWIZ). Demultiplexed sequencing reads were trimmed using Cutadapt (v.2.5)58, yielding only 20-bp sequences corresponding to sgRNAs. The statistical analysis of sgRNA enrichment (Supplementary Table 3) was performed using MAGeCK-VISPR (v.0.5.6) with the ‘MAGeCK-RRA’ experimental configuration and visualized using the MAGeCKFlute R package (v.2.0.0)59.
RNA-seq and analysis
Dox-inducible Aire-expressing 4D6 cells were cultured in the absence or presence of 1 μg ml−1 Dox for 24 h. Total RNA was extracted with Direct-zol RNA Miniprep Kit (Zymo Research, cat. no. R2052). RNA-seq libraries were prepared using NEBNext Ultra II RNA Library Prep Kit (New England Biolabs, cat. no. E7775S) with ribosomal RNA depletion using NEBNext rRNA Depletion Kit v2 (New England Biolabs, cat. no. E7405L) and sequenced on an Illumina NovaSeq 6000 (Novogene) with 150-bp paired-end reads.
Quality control (QC) was performed on demultiplexed sequencing files using FASTQC (v.0.11.3)60. Sequencing reads were trimmed using Trimmomatic (v.0.36) and aligned to reference genome (GRCh38 primary assembly, release v.43) using STAR (v.2.7.0a)61. Read counting across genomic features was performed using the featureCounts function within Rsubread R package (v.2.12.3) with duplicated reads ignored (ignorDup = T)62. Differential gene expression analysis was performed using the DEseq2 R package (v.1.38.3) and visualized using the ggplot2 R package (v.3.4.1)63,64. BAM files generated during the STAR alignment were converted to bigwig files using deepTools (v.3.5.1)65 with the following settings: bamCoverage --scaleFactor “scale factor” --smoothLength 150 --binSize 50 -e 200. “scale factor” was calculated as 1 divided by the size factor that was obtained during DEseq2 analysis. After verification of consistency between replicates, bigwig files were averaged using WiggleTools (v.1.2.2) and bedGraphToBigWig (v.366) and imported into Integrative Genomics Viewer (IGV, v.2.15.1) for visualization at specific loci66,67,68.
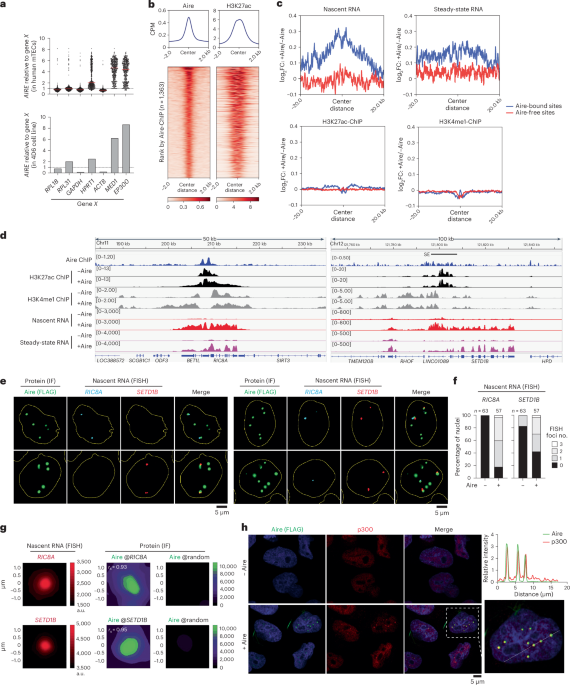
For Fig. 1a, bulk RNA-seq performed on 4D6 cells was compared with previously published single-cell RNA-seq data of human thymic epithelial cells (n = 477 AIRE+ mTECs)30.
5EU-seq and analysis
Dox-inducible Aire-expressing 4D6 cells were cultured in the absence or presence of 1 μg ml−1 dox for 24 h. DMSO or 3 μM A-485 was added to cells 4 h before, and 0.5 mM 5′-ethynyl uridine (5′-EU) was added to the cell culture 30 min before RNA extraction. Total RNA was immediately extracted by using Direct-zol RNA Miniprep Kit. Ribosomal RNA was depleted using NEBNext rRNA Depletion Kit v2 (New England Biolabs, cat. no. E7405L). 5′-EU-labeled nascent RNA was biotinylated and pulled down using Click-iT Nascent RNA Capture Kit (Invitrogen, cat. no. C10365) according to the manufacturer’s protocol. 5′-EU-labeled RNA captured on streptavidin-beads was then immediately used for sequencing library preparation with NEBNext Ultra II RNA Library Prep Kit (New England Biolabs, cat. no. E7775S). Libraries were sequenced on Illumina NovaSeq 6000 (Novogene) with 150-bp paired-end reads.
QC, trimming, reference genome alignment, BAM file conversion, average bigwig file generation and visualization were performed as described for bulk RNA-seq. Bigwig files showing log2 fold-changes between two groups were generated using deepTools (v.3.5.1) with the bigwigCompare function.
ChIP–seq and analysis
4D6 cells were seeded on 150-mm plates with or without Dox and grown for 24 h. For drug-treated samples, an equal volume of DMSO, 3 μM A-485 or 0.25 μM dCBP-1 was added to cells 4 h before collection. For anti-FLAG and anti-p300 ChIP–seq, cells were washed three times with PBS and then crosslinked with 2 mM disuccinimidyl glutarate in PBS for 45 min at 22 °C. Cells were then washed again three times with PBS and crosslinked with 1% formaldehyde (Sigma, Thermofisher and Electron Microscopy Sciences) in PBS for 10 min at 22 °C. For anti-histone mark ChIP–seq, cells were crosslinked with 1% formaldehyde in fresh media for 10 min at 22 °C. After formaldehyde crosslinking, all cells were washed once with PBS and quenched with 0.125 M glycine in PBS for 5 min at 22 °C. Quenched cells were washed with ice-cold PBS, and then collected in ice-cold PBS supplemented with 0.5 mM PMSF. Cells were spun down at 500g for 5 min and cell pellets were supplemented with 1 μl of 100 mM PMSF and 1 μl of 1 × mammalian protease inhibitor cocktail (G-Biosciences), and then flash-frozen in liquid nitrogen and stored at −80 °C until ready to use. For one ChIP–seq pull-down, ~15 × 106 cells were used. See the Supplementary Note for more details on ChIP–seq pull-downs, library generation, and sequencing and data analyses.
ATAC-seq and analysis
4D6 cells ±Dox were collected at 24 h post-induction. A total of 100,000 cells were used for each replicate. ATAC-seq libraries were prepared using the ATAC-seq library prep kit (Active Motif) according to the manufacturer’s protocol. Deep sequencing was performed using a NovaSeq sequencer (Illumina) with paired-end 150-bp reads.
QC and trimming were performed as for bulk RNA-seq. Sequencing reads were aligned to reference genome (GRCh38 primary assembly) using bwa (v.0.7.17). The resulting SAM files were converted to BAM files, sorted and indexed, and reads mapped to mitochondrial DNA were removed using Samtools (v.1.6). Read fragment sizes were checked using ATACseqQC R package (v.3.19)69. Post PCR duplicate removal, reads were shifted +4 bp and −5 bp for positive and negative strands, respectively, and were further split into NFRs or mono- or di-nucleosome regions using the alignmentSieve function in deepTools (v.3.5.1). Peak calling was performed on bam files containing reads mapped to NFRs using MACS2 (v.2.2.7.1). NFRs that overlapped with Aire peaks and showed strong Aire ChIP–seq signals were selected as Aire-bound NFRs (n = 542, Supplementary Table 1), whereas NFRs that had similar ATAC-seq read pileups as those in Aire-bound NFRs but showed no Aire ChIP–seq signals were selected as Aire-free NFRs (n = 658, Supplementary Table 1).
IF microscopy
4D6 or 293T cells were seeded onto glass coverslips in 12-well plate format. Cells at ~70% confluence were transiently transfected with indicated plasmids. 4D6 cells were seeded in the presence or absence of Dox. For inhibitor treatments, 4D6 cells were first induced with Dox for 4 h; then DMSO, A-485 (3 μM final concentration), dCBP-1 (0.25 μM final concentration), dBET6 (100 nM final concentration) or JQ1 (1 μM final concentration) was added to medium for a total of 4 h of inhibitor treatment and 8 h of Dox induction. At 24 h post-transfection or after Dox treatment for indicated amounts of time, cells were washed with PBS, and then fixed with 2% paraformaldehyde in PBS for 10 min. Cells were washed again with PBS and then permeabilized with 0.5% Triton X-100 in PBS for 10 min. Cells were blocked with 1% BSA in PBS-T (PBS + 0.2% Tween-20) for 15 min at 22 °C or 16 h at 4 °C, and then probed with antibodies. Cells were then counterstained with DAPI (Life Technologies). Coverslips were mounted using Fluoromount-G (SouthernBiotech) or Vectashield (Vector Laboratories, cat. no. H-1000-10). Two-dimensional images were captured on a wide-field Zeiss Axio Imager M1. Image z-stacks were captured on a wide-field Nikon Ti2 equipped with a Nikon DS-Qi2 large-format CMOS camera (11 frames per stack, 0.3-μm z-step), or a Yokogawa spinning disk confocal Nikon Ti equipped with a Hamamatsu ORCA-Fusion BT sCMOS camera (9 frames per stack, 0.3-μm z-step).
All quantitative IF imaging analyses were performed with Fiji Is Just ImageJ (FIJI, ImageJ2 v.2.14.0/1.54f). See the Supplementary Note for details of quantitative imaging analyses.
IF with RNA-FISH
Cells were plated on coverslips in 12-well tissue culture plates and grown for 24 h. For inhibitor treatment experiments, Dox and DMSO, A-485 or dCBP-1 were supplemented as described for IF microscopy. For all other experiments, Dox was supplemented to media for 24 h. Cells were washed with PBS and fixed using 4% paraformaldehyde (Electron Microscopy Sciences, cat. no. 15714) in PBS for 10 min. After washing cells twice in PBS, permeabilization of cells was performed using 0.5% Triton X-100 in PBS for 10 min, followed by washing with PBS-T twice. Cells were blocked with 1% RNase-free BSA (Sigma-Aldrich, cat. no. 126609) in PBS-T for 30 min, and then incubated with the FITC-conjugated anti-FLAG antibody (10 μg ml−1 in PBS-T with 1% BSA) at 22 °C for 1 h. After washing in PBS-T twice and PBS once, cells were re-fixed using 4% PFA in PBS for 10 min. After two PBS washes, cells were pre-incubated in Buffer A (20% Stellaris RNA-FISH buffer A (Biosearch Technologies, cat. no. SMF-WA1-60) and 10% deionized formamide (Millipore, cat. no. S4117) in RNase-free water (Thermofisher, cat. no. 10977023)) for 5 min. Cells were then incubated with 125 nM nascent RNA probes in hybridization buffer (90% Stellaris RNA-FISH hybridization buffer (Biosearch Technologies, cat. no. SMF HB1-10) and 10% deionized formamide) overnight in a humidified chamber at 37 °C. After washing with Buffer A for 30 min at 37 °C, nuclei were stained with DAPI in Buffer A for 5 min, followed by a Stellaris RNA-FISH buffer B (Biosearch Technologies, cat. no. SMF-WB1-20) wash for 5 min. Coverslips were mounted onto glass slides with Vectashield and sealed with nail polish. Nascent RNA-FISH probes were custom-designed to target RIC8A, SETD1B and UBTF intronic regions using Stellaris probe designer and manufactured at Biosearch Technologies. Sequences of RNA-FISH probes are listed in Supplementary Table 2.
Three-dimensional images were acquired on a Nikon Ti2 fluorescence microscope with ×60 objective using NIS-Elements acquisition software, at a resolution of 9.2308 pixels per μm and voxel size of 0.1083 × 0.1083 × 0.3 μm3. Microscope specifications can be found at https://nic.med.harvard.edu/microscopes/george_michael/.
Images were post-processed using FIJI or MATLAB for further analyses. See the Supplementary Note for details of quantitative imaging analyses.
Aire protein expression and chromatin fractionation assays
4D6 and 293T cells were transfected with plasmids expressing indicated proteins for assaying expression levels and chromatin fractionation assays in 12-well and 6-well plate formats, respectively. 4D6 cells induced with 0.1–1 μg ml−1 Dox were also seeded in 12-well format for expression level determination. At 24 h after transfection or Dox induction, cells were collected in PBS and washed one time with PBS. For samples expressing mouse Aire variants that were sensitive to protein degradation and/or histone deacetylation, washed cells were immediately lysed in 1% SDS Buffer (50 mM Tris pH 7.5, 150 mM NaCl, 1% SDS, 0.3 mM dithiothreitol; 75–100 μl per sample), boiled for 5 min and processed for western analyses as described below. For all other samples, washed cells were incubated in Hypotonic Buffer (20 mM HEPES pH 7.5, 0.05% IGEPAL, 1.5 mM MgCl2, 10 mM KCl, 5 mM EDTA and 1 × mammalian protease inhibitor cocktail; 50 μl and 100 μl per sample for 12-well and 6-well plate formats, respectively) for 15 min at 4 °C. The lysed cells were spun down at 500g for 5 min at 4 °C and the supernatant (cytoplasmic fraction) was removed. The pellet (nuclear fraction) was washed two times with ice-cold PBS.
For comparing mouse Aire variant expression levels, the PBS-washed nuclear fraction was lysed in 1% SDS Buffer and boiled for 5 min. BCA assay was used to determine the total protein concentration of lysates. See the Supplementary Note for Aire chromatin fractionation assay details.
Luciferase reporter assay
4D6 cells (∼80% confluence) were transfected with 200 ng of pGL4.31 (Firefly luciferase reporter plasmid under 5XUAS box promoter), 1 ng of phRLCMV (a constitutive Renilla luciferase reporter plasmid) and 25 ng of plasmid expressing Gal4-DBD fusion variants by using Lipofectamine 2000 in a 48-well plate format. At 24 h post-transfection, Gal4DBD-CTT transcriptional activity was measured by using Dual Luciferase Reporter assay (Promega) with a Synergy2 plate reader (BioTek). Firefly luciferase activity was normalized against Renilla luciferase activity.
RT–qPCR and 5EU–qPCR
4D6 cell lines expressing Aire variants were collected for RNA extraction 24 h post Dox treatment or transfection, respectively. For RT–qPCR, total RNA was extracted using Direct-zol RNA Miniprep Kit with DNase I digestion and reverse-transcribed using SuperScript II (Life Technologies) with oligo(dT18).
For 5EU–qPCR, 0.5 mM 5′-EU was added to cells 30 min before Direct-zol RNA extraction. Extracted 5′-EU-labeled RNA was biotinylated and pulled down using the Click-iT Nascent RNA Capture Kit (Invitrogen, cat. no. C10365) according to the manufacturer’s protocol. 5′-EU-labeled RNA captured on streptavidin-beads was then reversed transcribed using SuperScript II with oligo(dT18).
qPCR was performed using Power SYBR Green PCR Master Mix (Invitrogen) on a CFX-Connect detection system (Bio-Rad). The expression levels of Aire-induced genes and RPL31 (Aire-independent gene control) were normalized against the Aire-independent gene RPL18 using the ∆∆Ct method. qPCR primer sequences are listed in Supplementary Table 2. All statistical analyses were performed in Prism (GraphPad).
Escherichia coli expression and purification of recombinant proteins
See the Supplementary Note for methods used to prepare recombinant proteins in this study.
MS of Aire CTT binding partners
Equal amounts of His6-GST and His6-GST-mouse Aire CTT in MS Lysis Buffer (50 mM Tris pH 8, 300 mM NaCl and 10% glycerol, 1 mM PMSF) were captured onto glutathione Sepharose beads (Cytiva) for 1 h at 4 °C. GST-protein-bound beads were washed three times with MS Lysis Buffer. 293T cells were lysed in Hypotonic Buffer and Nuclear Extraction Buffer to obtain nuclear ‘soluble’ extracts as described above for chromatin fractionation assays. 293T nuclear extracts were incubated with GST-protein-bound beads for 16 h at 4 °C. Beads were washed with ice-cold PBS + 0.05% IGEPAL and three times with ice-cold PBS. Bound proteins were eluted with Laemmli sample buffer and boiled for 5 min. The eluted proteins were run on SDS–PAGE gel and stained with Coomassie Blue. A gel band around ~250 kDa was extracted for each lane containing either proteins interacting with His6-GST-CTT or His6-GST (negative control). Extracted gel bands were sent to Taplin Mass Spectrometry Facility at Harvard Medical School for in-gel protease digestion and micro-capillary liquid chromatography with tandem MS analysis. Protein interaction candidates identified from MS were ranked from high to low based on their coverages (%) in His6-GST-CTT pull-down samples where there were no coverages in His6-GST pull-down samples (Supplementary Table 4).
GST-Aire CTT-FLAG pull-downs
All pull-downs were performed at 4 °C unless specified. Equal amounts of His6-GST-FLAG and His6-GST-mouse Aire CTT-FLAG variants in SEC Buffer (25 mM HEPES pH 7.5, 100 mM NaCl, 5 mM BME) were captured onto glutathione Sepharose beads for 30 min. GST-protein-bound beads were washed three times with SEC Buffer, and then blocked with 0.1% BSA in SEC Buffer for 30 min until ready to mix with 293T nuclear extracts or purified recombinant proteins.
For 293T lysate pull-downs, 293T cells were transiently transfected with HA-p300 variant expression vectors in a 6-well plate format. At 48 h post-transfection, cells were lysed in Hypotonic Buffer and Nuclear Extraction Buffer to obtain nuclear ‘soluble’ extracts as described above for chromatin fractionation assays. Nuclear fractions were mixed with BSA-blocked GST-protein-bound beads for 1 h. For recombinant FLAG-tagged full-length p300 (Active Motif) pull-downs, p300 was diluted into 25 mM HEPES pH 7.5, 100 mM NaCl, 1.5 mM MgCl2, 5 mM BME and added to BSA-blocked GST-protein-bound beads for 1 h. Pull-downs were eluted by boiling beads in Laemmli sample buffer for 5 min.
For pull-downs with recombinant CBP TAZ2, CBP TAZ2 was mixed with BSA-blocked GST-protein-bound beads in SEC Buffer for 1 h; then beads were washed three times with SEC Buffer. Bound CBP TAZ2 was eluted with the addition of 25 mM glutathione (Sigma) in SEC Buffer. Elutions were passed through a Costar Spin-X centrifuge tube 0.22-μm filter (Millipore) to prevent contaminating beads from entering samples.
NMR spectroscopy
Please see the Supplementary Note for details on the NMR spectroscopy methods used in this study.
Fluorescence polarization peptide binding assay
N-terminal 5,6-carboxyfluorescein (5,6-FAM) FAM-labeled H3 peptide (aa 1–21) with no modification or K4me1 was purchased from Anaspec. Binding reaction mixtures (150 μl) contained 50 nM fluorescein-labeled peptide and increasing concentrations of PHDs (0–900 μM) in SEC Buffer. Fluorescence polarization was measured at 25 °C using a Synergy H1 (BioTek). Data were fit to a simple binding isotherm using Prism. Polarization values were normalized to the value without added PHD. All binding experiments were performed at least three times.
ITC
Protein samples were dialyzed in 20 mM HEPES pH 7.5, 100 mM NaCl, 1 mM dithiothreitol for 16 h at 4 °C. ITC experiments were performed using a VP-ITC calorimeter (MicroCal) and were conducted at 20 °C with 19–25 1–2-μl injections, 60-s delay between injections with 760 μM of mouse Aire CTT in the syringe and 19–76 μM TAZ2 in the cell. As a control, 760 μM mouse Aire CTT was titrated into the cell containing dialysis buffer only. Thermograms were fit to a two-site binding model using MicroCal Origin 7.0 software. Experiments were collected in duplicate.
Reporting summary
Further information on research design is available in the Nature Portfolio Reporting Summary linked to this article.

留言 (0)