
記住我


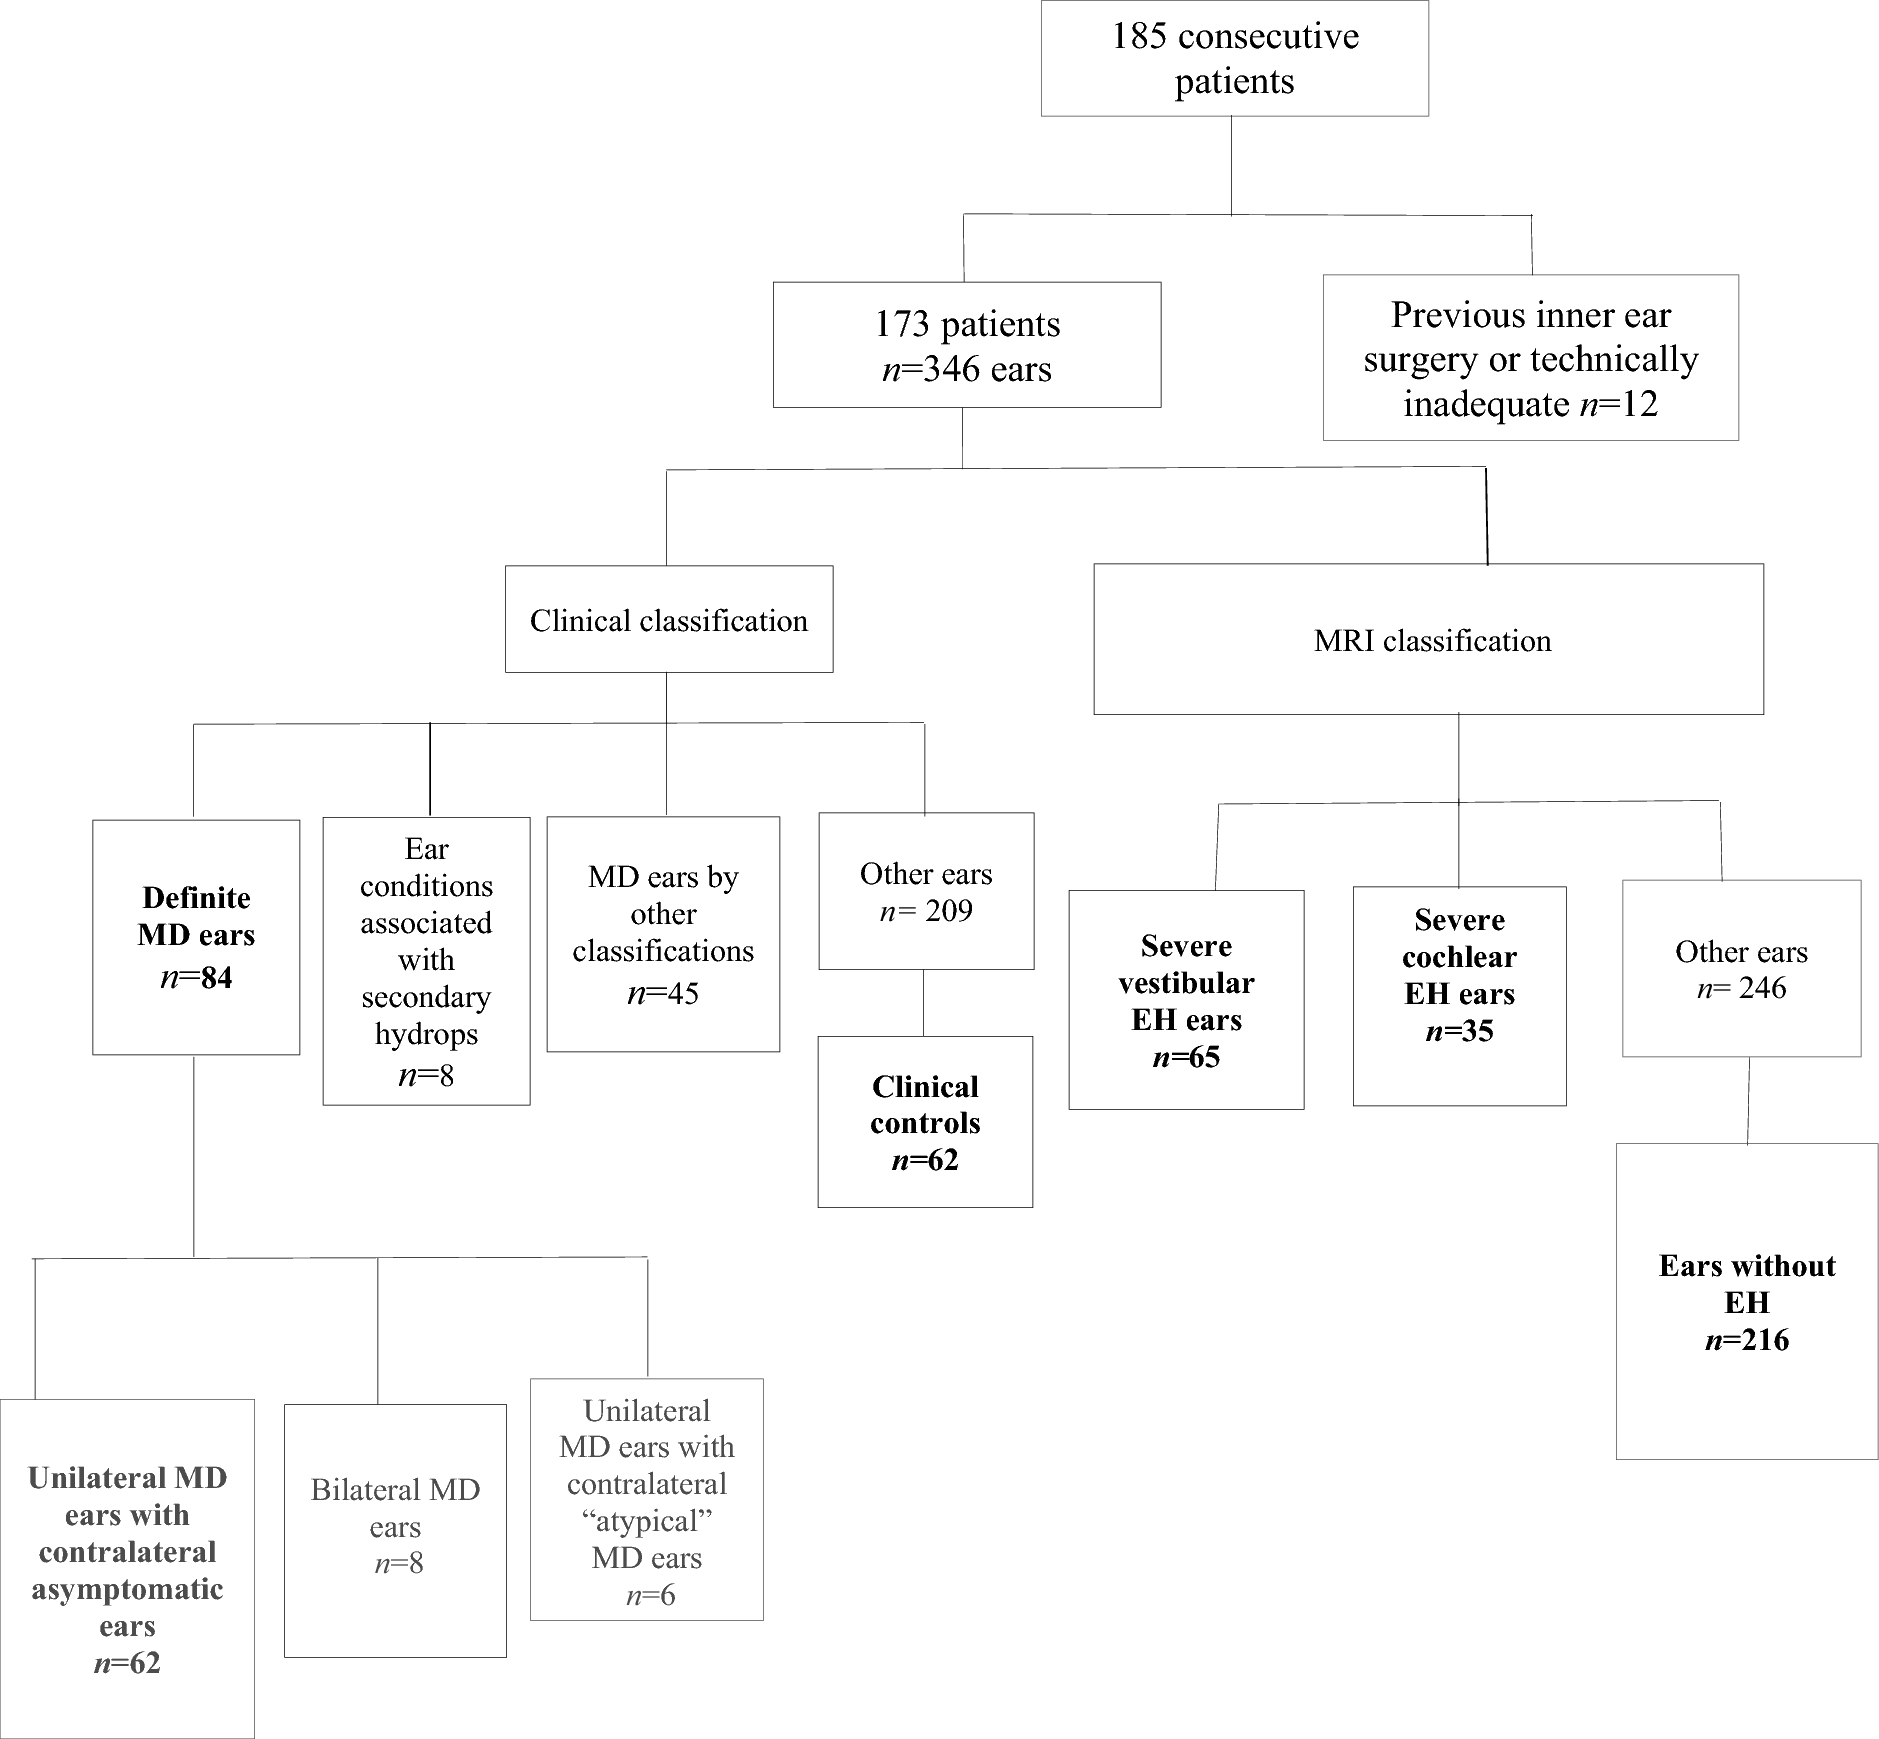
The study was approved by the institutional ethical committee (GSTT Electronic Record Research Interface, IRAS ID: 257,283, Rec Reference: 20/EM/0112). The study included patients with symptoms of hydropic ear disease (episodic vertigo, sudden-onset or fluctuating sensorineural hearing loss (SNHL), aural fullness or tinnitus) who were referred for MRI between September 2017 and August 2022. Exclusion criteria were previous inner ear operations or degraded MR imaging (Table 1; Fig. 1).
Table 1 Summary of the demographics of the study cohortFig. 1
Flowchart demonstrating the selection process for the study cohort
Imaging techniqueAll patients were imaged on a 3-T scanner using a 64-channel head and neck coil (Magnetom® Skyra; Siemens Healthcare, Erlangen, Germany). MRI was performed 4 h after the intravenous administration of a double-dose gadolinium-based contrast agent (Gadoterate 0.2 mmol/kg). A T2w SPACE (sampling perfection with application optimized contrasts using different flip angle evolution) (repetition time = 1000 ms, echo time = 125 ms, number of averages = 2, effective refocussing flip angle = 100°, echo train length = 52, pixel spacing = 0.31 mm, slice thickness = 0.3 mm, 262 × 512 matrix, and 160 mm × 80 mm field of view) sequence was used to evaluate neural calibre. An isotropic three-dimensional fluid-attenuated inversion recovery (3D FLAIR) sequence (repetition time = 6000 ms, echo time = 180 ms, inversion time = 2000 ms, number of averages = 1, refocussing flip angle = 180°, echo train length = 27, pixel spacing = 0.7 mm, slice thickness = 0.7, 256 × 240 matrices, 190 mm × 178 mm field of view) was performed to evaluate for EH.
Clinical data and classificationTwo observers (SC, IP) reviewed the contemporary clinical and audiometric data by consensus whilst blinded to imaging findings. Clinical review was always within six months whilst audiometry was performed within 12 months of the MRI study. Definite MD was defined according to the 2015 Barany diagnostic criteria [16] (Supplementary Table 1, Online resource). Definite MD was not diagnosed if there was any ear condition present which was associated with secondary hydrops. Control ears were obtained from patients without definite MD or MD by any previous criteria [8, 17,18,19,20,21] (Supplementary Table 1) and were required to have a) no Meniere’s-type vertigo and b) normal hearing (thresholds ≤ 20 dBHL at 0.5, 1, 2 and 4 kHz) or isolated high frequency sensorineural hearing loss ≥ 20dBHL at ≥ 6 kHz. For the definite MD and asymmetric contralateral MD ears, the mean air conduction threshold (0.25, 0.5, 1, 2, 4, 6, 8 kHz) was recorded from the pure tone audiogram (PTA) performed at the shortest interval from the MRI study. Air conduction (AC) thresholds were used rather than bone conduction (BC) thresholds since the BC thresholds were beyond the limit of the audiometer (worse than moderate/severe hearing loss in a significant proportion of the cases). To ensure that only SNHL was analysed, BC threshold data was collected where obtainable (0.5, 1, 2, 4 kHz). The duration of symptoms (in months) was also recorded for the definite MD cohort.
Image analysis of neural calibreThe cross-sectional measurements of the facial, CN, SVN and IVN were performed for all ears. Analysis was performed on a DICOM-Viewer (Horos v.4.0, Annapolis, MD USA) whilst blinded to clinical diagnosis. Standardised oblique multiplanar reformats (MPRs) were performed perpendicular to a line joining the vestibulocochlear nerve root entry point and the midpoint between the cochlear nerve and inferior vestibular nerve at the fundus of the internal auditory meatus (IAM). To perform neural measurements, an oblique sagittal 0.6 mm slab was reconstructed immediately lateral to the cochlear aperture and displayed with a standardized window width and centre algorithm (Fig. 2). The partial blurring observed at the edges of the reconstructed nerves (penumbra effect) was addressed by contouring at the midpoint of the central low signal and peripheral high signal. The cross-sectional area (CSA), long diameter (LD), and short diameter (SD) of the four nerves were measured on the reformatted 0.6 mm slab (Fig. 2). If the neural course adjacent to the wall of the internal auditory meatus precluded accurate delineation, then this ear was excluded from the analysis. The imaging analysis was performed on two occasions (one month apart) by a single observer (RK with 8 years radiology experience) who was blinded to clinical information. Prior to the study analysis, there was a period of training and joint review of 10 additional cases by SC (28 years of radiology experience).
Fig. 2
(a) Axial T2w SPACE image at the level of the internal auditory canal showing the orientation and location of the oblique sagittal 0.6 mm multiplanar reformat from which neural measurements were obtained (b) The corresponding oblique sagittal reformatted image at the fundus of the internal auditory canal is positioned just lateral to the cochlear aperture. The cochlear nerve (1), inferior vestibular nerve (2), superior vestibular nerve (3) and facial nerve (4) are indicated (c) The cross-sectional area (CSA) of the antero-inferior cochlear nerve is contoured d) The long diameter (LD) and short diameter (SD) of the cochlear nerve are indicated. Note that the CSA (in c) and the LD/SD (in d) encompass part of the “penumbra” of the neural outline. The limits were defined as midway between the central neural low signal and the cerebrospinal fluid high signal as imaged with a standardised histogram based PACS algorithm
Imaging analysis of endolymphatic hydrops and classificationFor evaluation of the delayed post-gadolinium 3D FLAIR sequence, the imaging plane was reformatted to the orbito-meatal line on a PACS workstation (Sectra workstation, Sectra AB, Sweden), with T2w SPACE images used for anatomical correlation as required. The images were reviewed with standardized magnification and window settings. Two radiologists (PT and SC with 10 and 28 years of radiology experience), independently evaluated the MRI studies. Imaging review was performed whilst blinded to clinical diagnosis and the two observers achieved consensus when different scores were obtained. MRI evidence of “severe” vestibular EH was recorded when there was confluence of the utricle and saccule (Bernaerts grade 2) [22] and “severe” cochlear EH was recorded when there was replacement of the scala vestibuli by the endolymphatic space (Bernaerts and Barath grade 2) with “bands” of low signal endolymph visible within the basal turn [22, 23] (Fig. 3). Control ears were those ears without any features of endolymphatic hydrops on MRI according to any EH grading systems [24].
Fig. 3
Delayed post-gadolinium 3D FLAIR axial images demonstrate (a) Severe vestibulo-cochlear endolymphatic hydrops. Severe cochlear hydrops (solid arrow) and severe vestibular hydrops (open arrow) is indicated by the arrows. b The same image demonstrating severe vestibulo-cochlear hydrops with contouring of the vestibular endolymphatic and perilymphatic spaces. The vestibular endolymphatic space comprises the confluent saccule and utricle (central solid contour). This almost replaces the surrounding enhancing vestibular perilymphatic space (peripheral dotted contour) (c) Normal endolymphatic appearances. The normal cochlear duct is not perceptible whilst the normal sized non-enhancing saccule (solid arrow) and utricle (open arrow) are clearly visualised within the enhancing perilymphatic space (d) The same image demonstrating the normal endolymphatic spaces with contouring of the non-enhancing vestibular endolymphatic space comprising the saccule and utricle (central solid contour). It is surrounded by the enhancing vestibular perilymphatic space which is more clearly visualised (peripheral dotted contour)
Statistical analysisThe data were analysed using SPSS® Statistics 28.0 (IBM®, USA. Descriptive statistics were applied to the absolute CN, SVN and IVN dimensions and their ratio to the facial nerve calibre, as well as the audiometry and duration of symptoms. The Kolmogorov–Smirnov test was used to assess whether data was normally distributed with the mean (SD) or median [interquartile range] being documented. The measurements of CN, SVN and IVN calibre for symptomatic MD ears were compared to clinical control ears, whilst those of symptomatic MD ears were compared to contralateral asymptomatic MD ears, and those of contralateral asymptomatic MD ears were compared to clinical control ears. Severe vestibular EH and severe cochlear EH ears were compared to control ears without EH on MRI. Comparisons were performed using the two-sided independent samples t test (unpaired data) or paired t test (paired data) when normally distributed, whilst the Wilcoxon signed-rank test (paired data) or Mann–Whitney U test (unpaired data) were applied when not normally distributed. In view of the multiple comparisons, p < 0.001 was considered statistically significant.
Spearman’s rank correlation coefficients evaluated the correlation between nerve calibre measures and AC PTA thresholds for both symptomatic MD ears and contralateral asymptomatic MD ears, whilst paired t test compared the AC PTA thresholds between symptomatic MD ears and their contralateral asymptomatic ears. The duration of MD symptoms was also correlated with nerve calibre for symptomatic MD ears.
留言 (0)