
記住我


Between February 4, 2019 and May 24, 2022, 35 patients from four Japanese hospitals were enrolled. The median age was 61 years (range, 26–81); 19 patients were male and 16 were female, and 16, 12, and seven had low, intermediate, and high Sokal scores, respectively. 11 patients were resistant to prior therapy and 24 were intolerant, respectively. The numbers of patients previously treated with TKIs were as follows: 19 (54%) received one TKI, 12 (34%) received three, and four (11%) received three. Prior TKIs were imatinib (n = 8, 23%), dasatinib (n = 27, 77%), nilotinib (n = 16, 46%), and bosutinib (n = 1, 3%, the patient who received prior treatment with bosutinib was intolerant to standard dosage of bosutinib); 23 of 35 patients (66%) had medical complications, which included hypertension (10, 29%), diabetes mellitus (five, 14%), cardiovascular disease (three, 9%), solid tumors (two, 6%), and cerebrovascular disease (one, 3%). The median major BCR::ABL mRNA level was 0.1% (0.0–34.6%), and serum aspartate aminotransferase (AST) and alanine aminotransferase (ALT) levels were 23 U/L (11–63) and 20 U/L (12–94), respectively (Table 1).
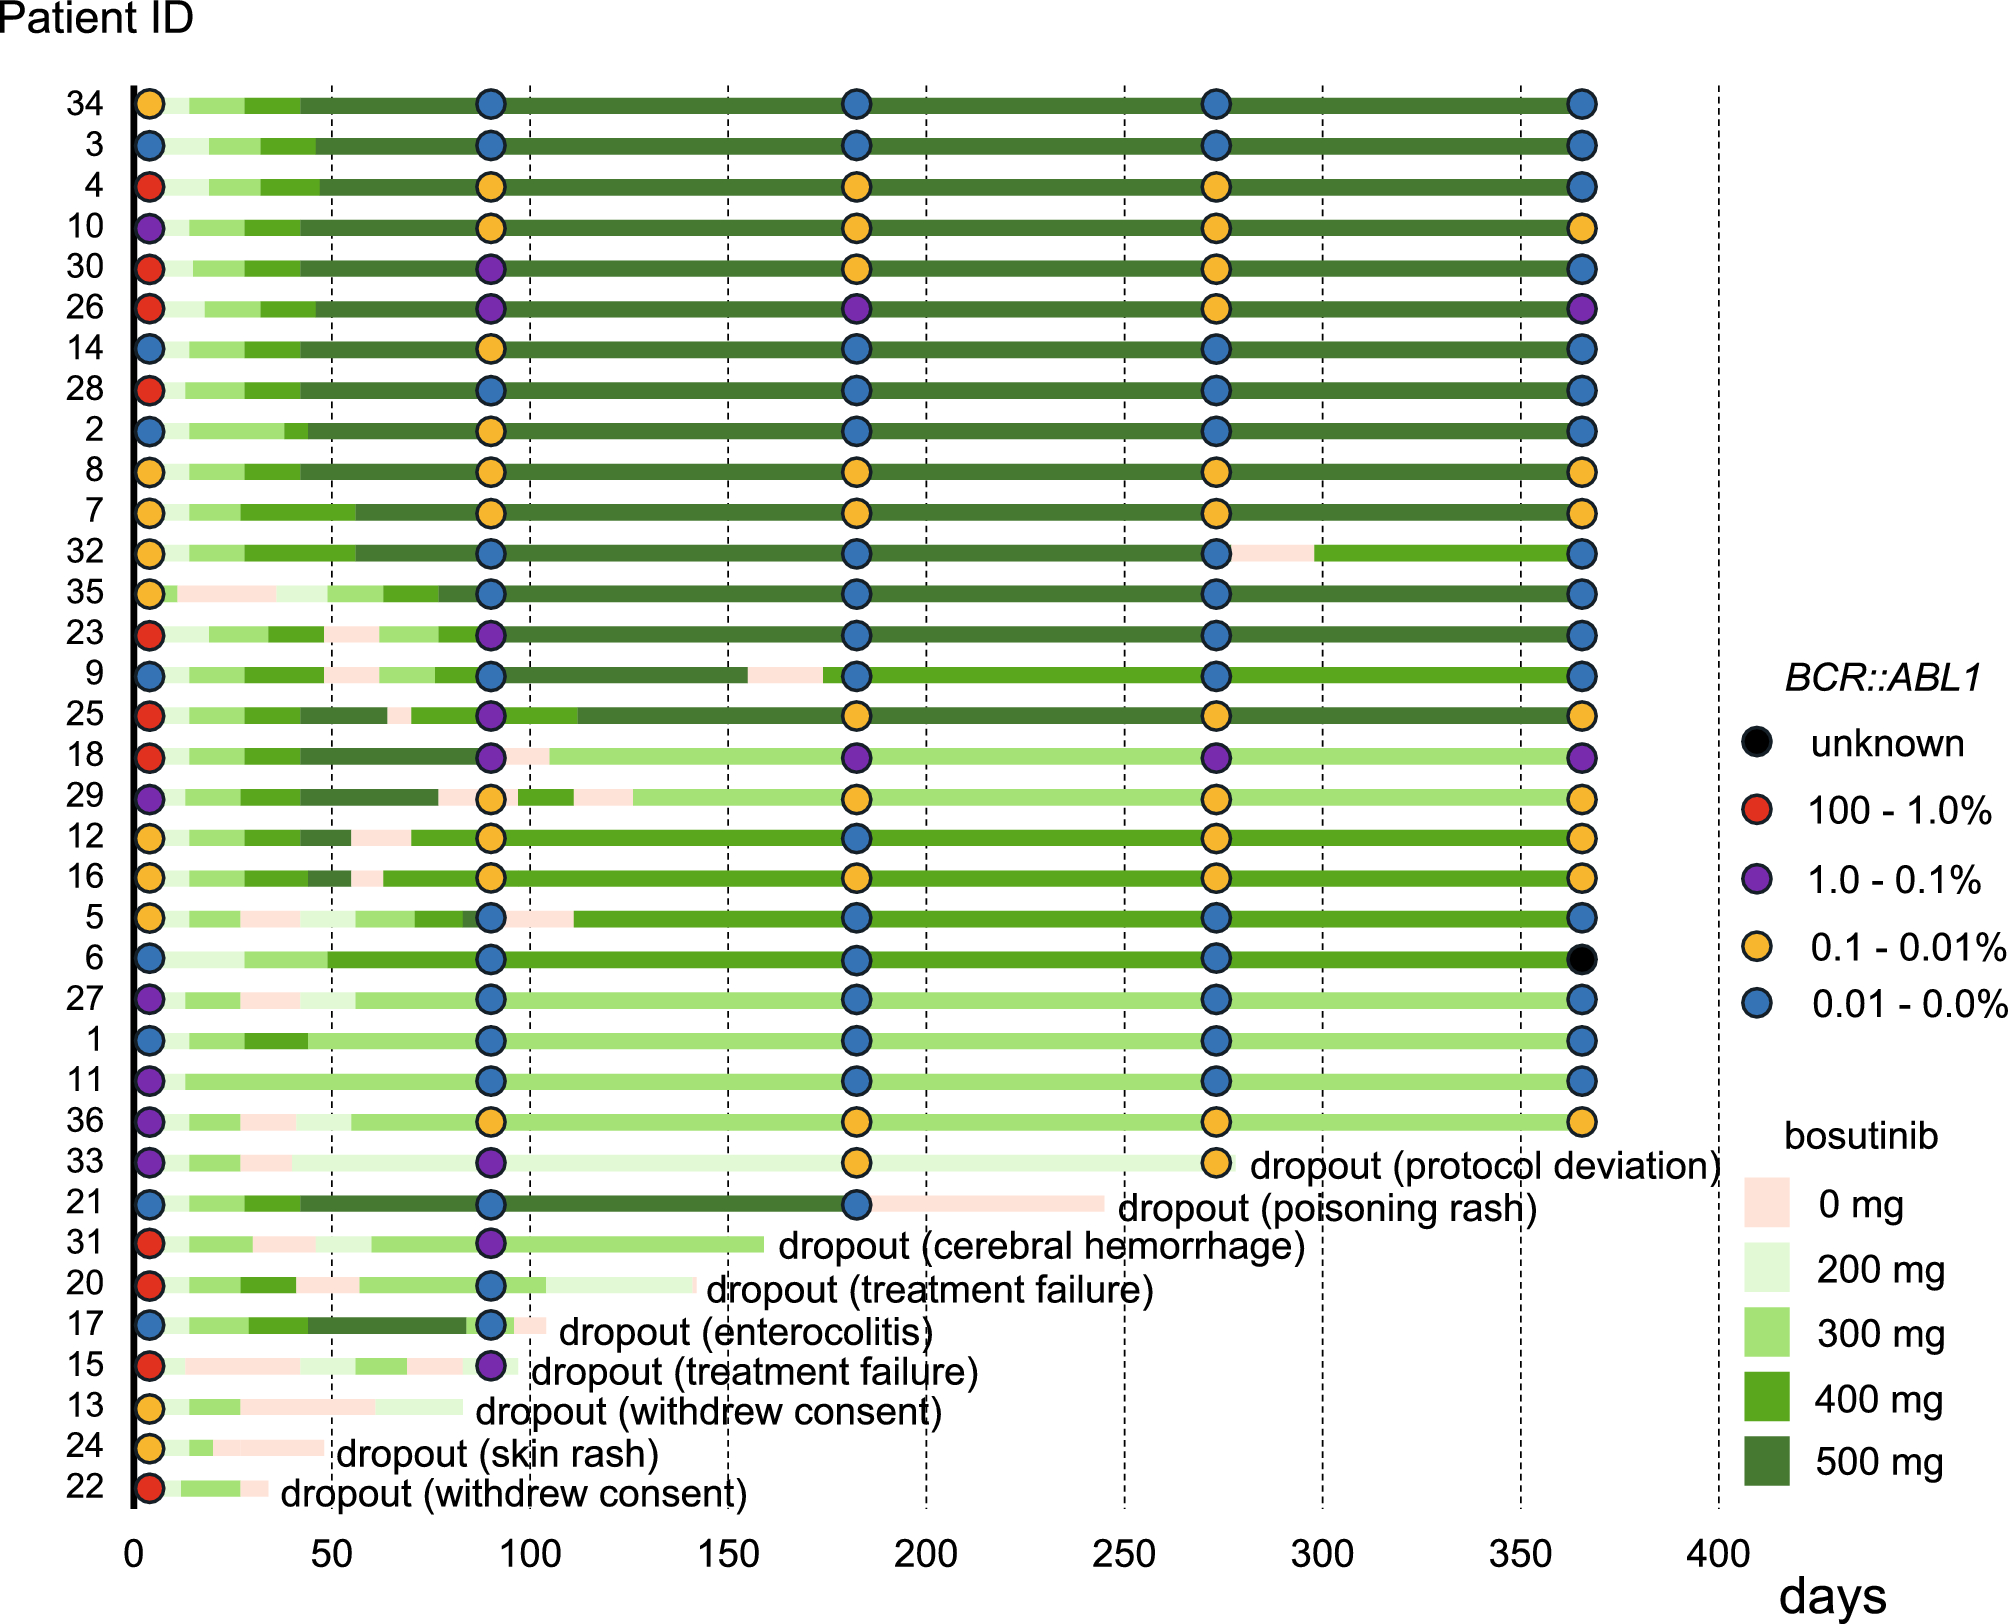
Table 1 Patient characteristicsThe bosutinib discontinuation rate due to DRTs was lower than that reported previouslyIn the intention to treat population, nine of 35 patients had discontinued bosutinib at 12 months; four of these discontinuations were due to DRTs. The total bosutinib discontinuation rate was 25.7% ([95% CI, 15.6–39.3%] vs. 35.9% (14/39) for the Japanese phase 1/2 study [10]; p = 0.102), and the bosutinib discontinuation rate due to DRTs was 11.4% ([95% CI, 5.2–23.2%] vs. 28.2% (11/39, p = 0.015); the differences were significant. Common grade 3 to 4 AEs were consistent with the known safety profiles of bosutinib; these included skin rash (26%), increased AST (9%), and increased ALT (20%); there were no differences in grade 3–4 skin rash (p = 1.00), increased AST (p = 0.690), and increased ALT (p = 0.554) between the present study and the previous the Japanese phase 1/2 study; the incidence of diarrhea was low (3% vs. 25% in the Japanese phase 1/2 study; p = 0.018)). No pleural effusion (0%), cardiovascular events (0%), and only one cerebral hemorrhage (3%), were observed (Table 2). These results suggest that a lower initiating dose of bosutinib reduces the discontinuation rate due to DRTs; thus, the primary endpoint was met. A total of 21 patients (60.0%) interrupted bosutinib at least once due to grade 3 or higher AEs, except for one patient who discontinued due to a grade 2 pleural effusion at the decision of the physician. The other reasons for interruptions were skin rash (n = 9), liver dysfunction (n = 7), diarrhea (n = 1), appetite loss (n = 1), acute enterocolitis (n = 1), increased lipase (n = 1), nausea (n = 1), general fatigue (n = 1), cerebral hemorrhage (n = 1), poisoning rash (n = 1) and anemia (n = 1). Median bosutinib interruption duration was 16 days (range, 6–64). The mean and median bosutinib dose, the number of bosutinib dosing days, and the relative dose intensity up until 12 months were 388.7 (204.9–477.3) mg/day, 391.7 (204.9–477.3) mg, 351.0 (20–365) days, and 78% (41–95), respectively. A swimmer plot detailing treatment duration and outcomes for individuals in the study is shown in Fig. 1.
Table 2 Adverse events and laboratory abnormalities during bosutinib treatment (grades 3–4)Fig. 1
Swimmer plot displaying the treatment course. Each bar represents an individual patient
Bosutinib efficacy was high even at the lower initiating doseBCR::ABL1 mRNA ≦1% was achieved by 28/35 patients (80.0%) at 6 months, and by 26/35 patients (74.3%) at 12 months. Notably, all patients who could continue bosutinib until 12 months achieved BCR::ABL1 mRNA ≦1%, equivalent to a CCyR. The cumulative incidences of MMR and DMR at 12 months were 23/35 (65.7%; 95% CI, 49.2–79.2%) and 15/35 (42.9%; 95% CI, 28.0–59.1%), respectively (Fig. 2A). For those who could be evaluated. The cumulative incidence of a molecular response at each time point is presented in Fig. 2B. Taken together, the results suggest that bosutinib efficacy remains high in CML-CP patients who were resistant and/or intolerant to prior therapy, even when used at a lower initiating dose.
Fig. 2
A Major molecular response (MMR) and deep molecular response (DMR) at 12 months. The graph shows the MMR or DMR rates at 12 months after initiation of bosutinib treatment. B Dose distribution for all 35 patients from baseline until 12 months
PK of bosutinibThe average trough concentration of bosutinib at 3, 6 and 12 months was 114.4, 118.0 and 112.6 ng/mL, respectively. When we investigated factors that can affect the bosutinib trough concentration (i.e., patient age, sex, body weight, body mass index, liver function, and renal function), we found that none did (Table S1). Furthermore, there was no difference in average trough concentrations between those who continued (26 patients) and those that discontinued treatment due to AEs (six patients): 116.9 vs. 98.9 ng/mL, respectively (p = 0.409, Mann–Whitney U test; Fig. 3A). With respect to an association between achievement of MMR or DMR and the bosutinib trough concentration, we found that patients who achieved molecular remission tended to have higher trough concentrations: MMR = 117.0 vs. 64.1 ng/mL, respectively (p = 0.210; Fig. 3B) and DMR = 117.7 vs. 104.0 ng/mL, respectively (p = 0.355; Fig. 3C). The optimal trough concentration for a 1 log reduction was 121.0 ng/mL (based on ROC curve analysis and Youden index criteria) (Fig. 3D).
Fig. 3
Pharmacokinetics of bosutinib. Trough concentrations of bosutinib in patients who continued treatment (A), or achieved of major molecular response (MMR, B) or a deep molecular response (DMR, C). ROC curve shows that the optimal trough concentration required for a 1 log reduction was 121.0 ng/mL (D). IS, international scale
T cell and NK cell dynamics after initiation of bosutinib treatmentWe performed flow cytometry for sequential assessment of changes in the T cell and NK cell profiles following initiation of bosutinib treatment. The percentages of CD8+ T cells, CD3−CD56+ NK cells, CD16+CD56+ NK cells, and Tregs changed little after bosutinib initiation (Figure S1). Next, we evaluated the association between immune cell numbers and bosutinib treatment outcomes. There were no differences in the percentage of CD8+ T cells and NK cells between patients who achieved DMR and those that did not (Fig. 4A–C); however, patients who achieved DMR at 12 months had a lower percentage of Tregs than those who did not (5.7% vs. 7.2%, respectively; p = 0.043; Fig. 4D). These results indicate that bosutinib does not affect most immune cell populations, whereas the low numbers of Tregs might play a role in patient responses to bosutinib.
Fig. 4
Flow cytometry analysis of T cells and natural killer (NK) cells at 12 months post-treatment initiation. Percentage of CD3+ T cells (A), CD16+CD56+ NK cells (B), CD3−CD56+NK cells (C), and regulatory T cells according to the molecular response (D). DMR, deep molecular response
留言 (0)