
記住我
Overall, 107 participants initiated the questionnaire and 100 (93.5%) completed it and were included herein. The mean age of the participants was 58.44 (SD = 17.31) and participants were 57.1% women and 96% white (Table 1). Sixteen percent of participants self-reported current unemployment or were on disability and 22.7% reported having a high school diploma or less. Most of the respondents (82.1%) had not utilized GI behavioral health services at the time of survey completion.
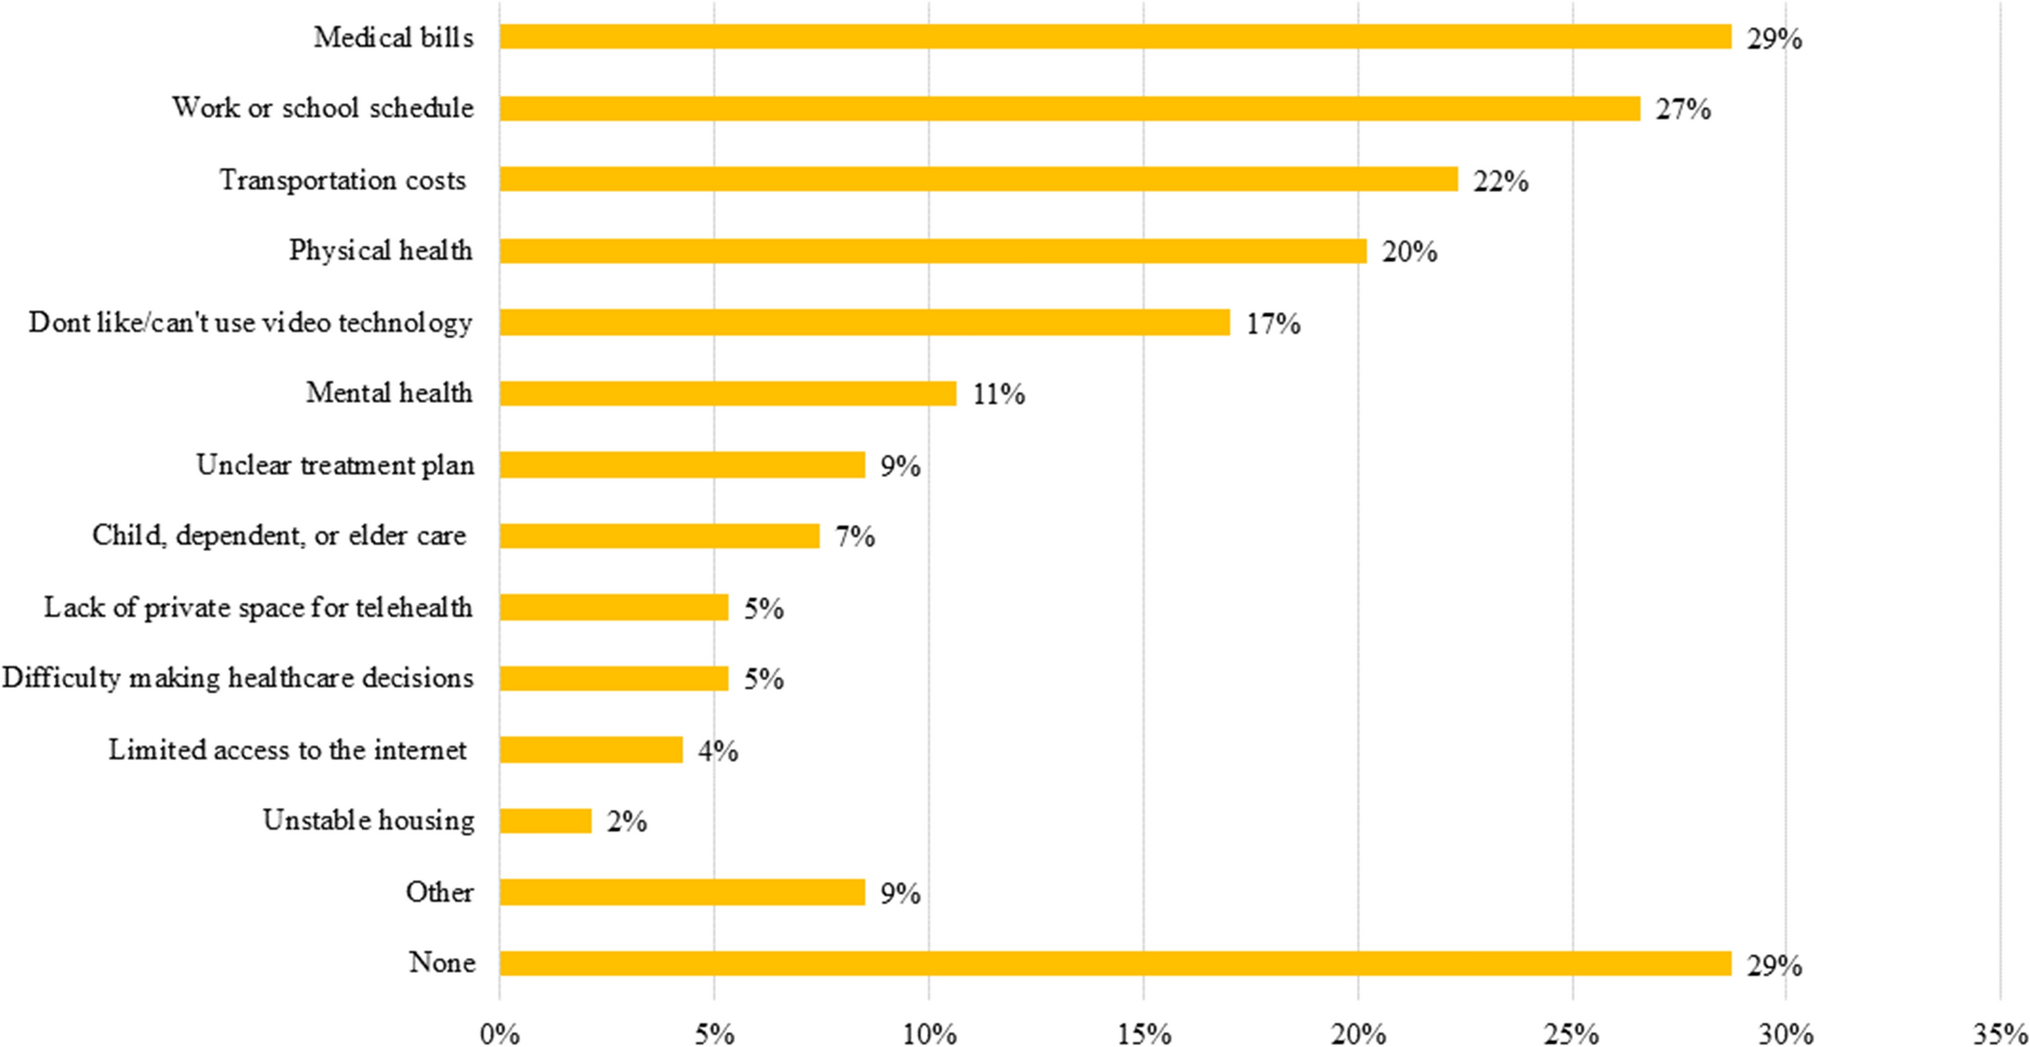
Table 1 Demographic characteristics of 100 adult patients attending an outpatient gastroenterology clinicBarriers to EngagementAttending AppointmentsWhile 28.7% of participants reported no barriers to attending appointments, 26.6% endorsed 3 or more barriers (Fig. 1). The most commonly endorsed barriers impeding respondents’ abilities to attend appointments were medical bills (28.7%), work or school schedules (26.6%), and transportation costs (22.3%). Other barriers included physical health problems (20.2%) and dislike of or inability to use video technology (17%). While many preferred or would exclusively consider online appointments (48%), others favored or would solely attend in-person appointments (32%).
Fig. 1
Participants’ barriers to making appointments
Health ManagementWhile 26.1% of respondents cited no barriers impacting their health management, the majority of respondents reported multiple areas affecting them, with 40.2% citing 3 or more factors. When asked to identify factors that impact ability to manage overall health, participants most commonly endorsed difficulty with concentration (35.9%), anxiety and worries (34.0%), and pain (33.0%). Other common factors included feeling sad, low, numb, or having lost interest (27.2%), significant stress (27.2%), and difficulty with motivation (23.9%). See Fig. 2 for more information on factors influencing health management.
Fig. 2
Factors impacting participants’ health management
Individual Factors Impacting EngagementFactors impacting engagement included self-efficacy, mood, and quality of life. Overall, mean self-efficacy for managing symptoms (T-score) was 42.73 (SD = 8.34), indicating below-average self-efficacy. Further, 41.9% of participants had a T-score < 40 (e.g., more than 1 standard deviation below the mean) indicative of significantly reduced self-efficacy. Looked at a different way, 30.5% of participants reported little to no confidence (a 1 or 2 on the scale) in managing symptoms during daily activities, 35.8% reported little to no confidence in keeping symptoms from interfering with relationships, 40% reported little to no confidence in their ability to manage their symptoms in a public place, and 15.1% reported little to no confidence in working with their doctor to manage symptoms. No participants screened positive for depressive symptoms only, 17.4% screened positive for anxiety symptoms only, and 19.6% screened positive for both anxiety and depressive symptoms. In addition, 27.2% of respondents scored 6 or higher, reflecting overall moderate to severe mood symptoms. Twenty-four percent of participants reported overall low quality of life.
Relationship Between Individual Factors and Barriers to EngagementTable 2 presents correlations among age, gender, self-efficacy, mood symptoms, quality of life, number of barriers to attending appointments, and number of factors impacting health management. Both self-efficacy and quality of life were negatively associated with barriers to attending appointments (r = − 0.22, p = 0.04; r = -0.33, p = 0.001, respectively) and barriers to health management (r = − 0.46, p < 0.001; r = − 0.65, p < 0.001, respectively). In addition, mood symptom severity was positively associated with barriers to attending appointments (r = 0.42, p < 0.001) and barriers to health management (r = 0.77, p < 0.001).
Table 2 Correlations between individual factors and number of barriers to appointment attendance and health managementRelationship Between SDoH Vulnerability and Barriers to EngagementRegarding financial stability, 26.3% (n = 26) of patients indicated not having enough to meet their needs and 13.6% (n = 13) of participants indicated that at least sometimes, they need help reading material from their doctor or pharmacy. As 7.3% of participants endorsed both financial instability and low health literacy, a total of 32.3% of the population met our predetermined criteria for SDoH vulnerability.
This group reported significantly greater mood symptoms than the other participants in the sample (M = 4.61 vs. 2.49, p = 0.01). Compared to the rest of the sample, participants with SDoH vulnerability reported significantly more barriers to attending appointments than those without SDoH vulnerability (M = 2.52 vs. 1.22, p < 0.001, Fig. 3). Participants with SDoH vulnerability were significantly more likely to endorse physical health problems (p < 0.001; 45.2% vs 7.7%) and difficulty affording medical bills (p = 0.002; 48.4% vs 18.5%) as barriers to attendance than participants without SDoH vulnerability. Difficulty making healthcare decisions (p = 0.036; 12.9% vs 1.5%) and mental health problems (p = 0.012; 22.6% vs 4.6%) may also be different between these two groups but were not considered significant after controlling for multiple comparisons.
Fig. 3
Participants’ barriers to making appointments for those endorsing social determinants of health vulnerabilities compared to those without vulnerabilities
Participants with SDoH vulnerability also reported more barriers to managing their health than those who do not have SDoH vulnerability (M = 4.48 vs. 1.85, p < 0.001, Fig. 4). Participants with SDoH vulnerability were more likely than those without this additional vulnerability to endorse pain (p < 0.001; 58.1% vs 20%), mobility issues (p < 0.001; 38.7% vs 6.2%), trauma experiences (p = 0.002; 29% vs 4.6%), significant stress (p = 0.003; 45.2% vs 16.9%), and difficulty with concentration (p = 0.004; 54.8% vs 24.6%) as impactful in their overall health management. Difficulty with organization (p = 0.01; 32.3% vs 10.8%) and symptoms of depression (p = 0.014; 41.9% vs 18.5%) arose as possible differences but were not considered significant after controlling for multiple comparisons.
Fig. 4
Factors impacting participants’ health management for those endorsing social determinants of health vulnerabilities compared to those without vulnerabilities
Importantly, we did not find significant differences between those with and without SDoH vulnerability in several areas. Participants with SDoH vulnerability did not differ significantly from the remainder of the sample on self-efficacy for managing symptoms (p = 0.13; 58.1% vs 34.4%), endorsement of technology barriers (p = 0.27; 25.8% vs 18.5%), or preference for in-person versus telehealth appointments (p = 0.80; 55.2% vs 44.8% preferred telehealth).
留言 (0)