Study sample
The samples were recruited from a tertiary hospital in Shandong province, China, between December 2019 and October 2020. This hospital, which has more than 4000 ward beds, is the largest and best-performing tertiary hospital in Shandong province [26]. In 2022, it delivered 2.68 million ambulatory or outpatient visits, 187.6 thousand hospital visits, and 148 thousand surgeries. The rheumatology department of this hospital employs 20 medical staff members and trains rheumatism specialists from all three provinces of Shandong, Xinjiang and Ningxia. Furthermore, the department is the preferred choice for the diagnosis and treatment of complex rheumatism cases from all 16 cities in Shandong provinces. This study included patients with AS disease who met the following criteria: (1) Diagnosed as AS according to the New York criteria [27]; (2) Aged 18 years and above; and (3) No mental disorders; (4) Able to understand the questionnaires; (5) Without serious complications. The AS patients were selected using a convenience sampling method and given their written informed consent prior to the survey. Trained interviewers conducted face-to-face questionnaire surveys. A total of 243 patients completed the survey during the study period. After deleting five cases with missing values in key variables, the remaining 238 patients were included in the development and validation of the mapping algorithm.
This study obtained ethical approval from Ethics Committee of Scholl of Healthcare Management, Shandong University (ECSHCMSDU20181102).
Outcome measures
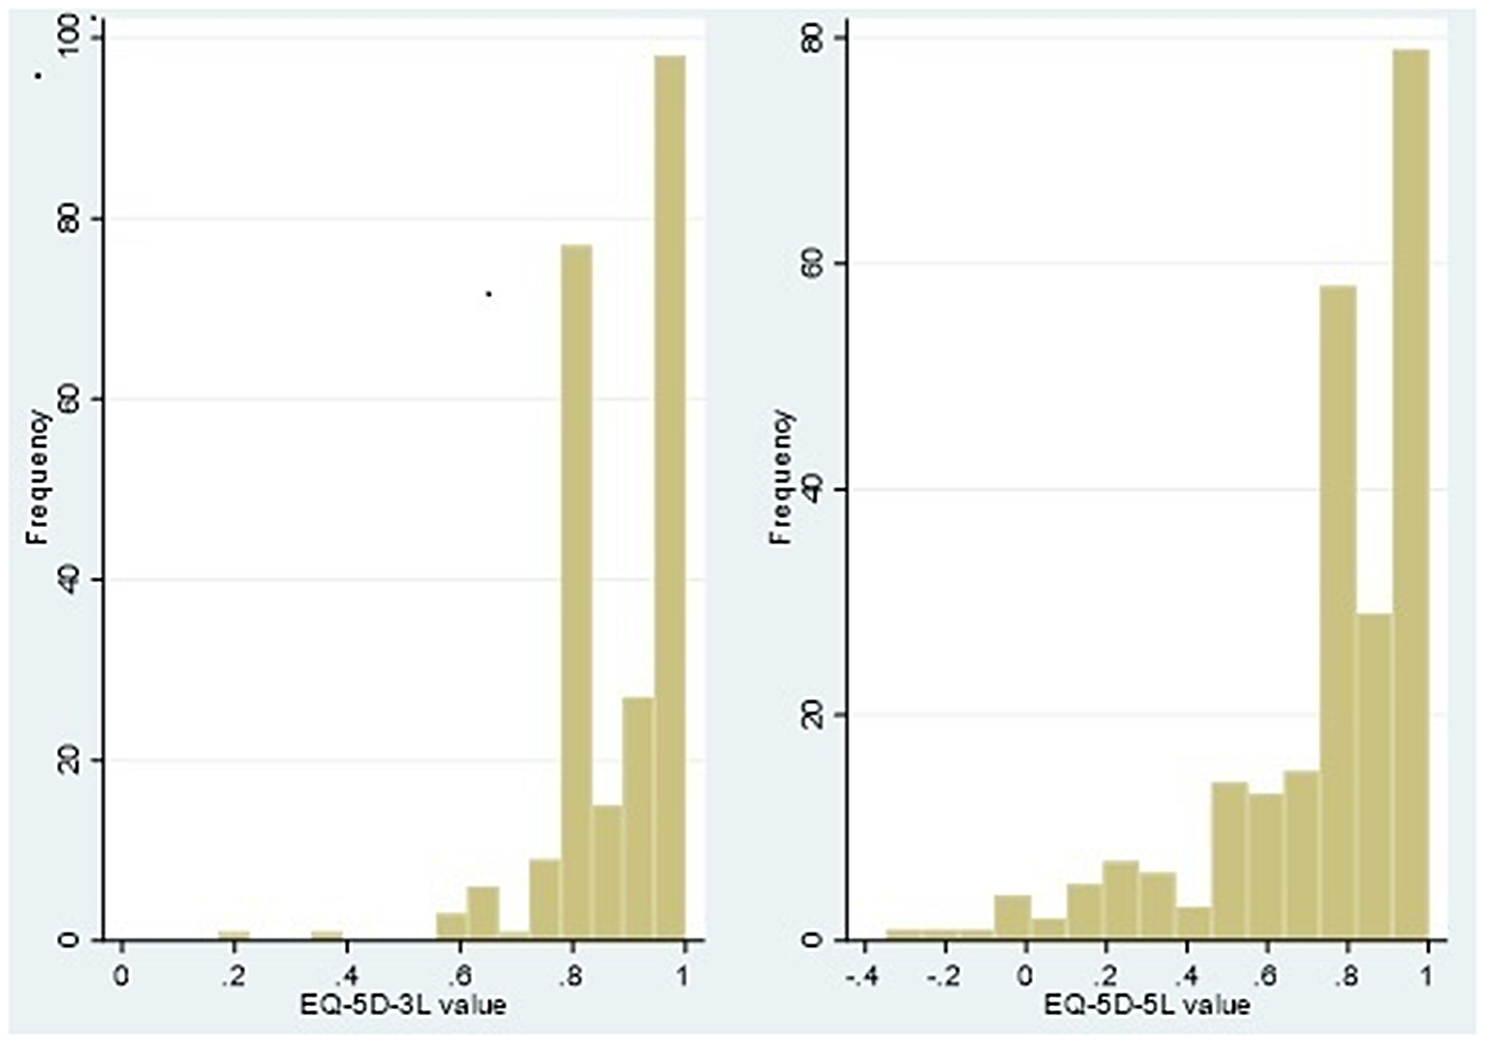
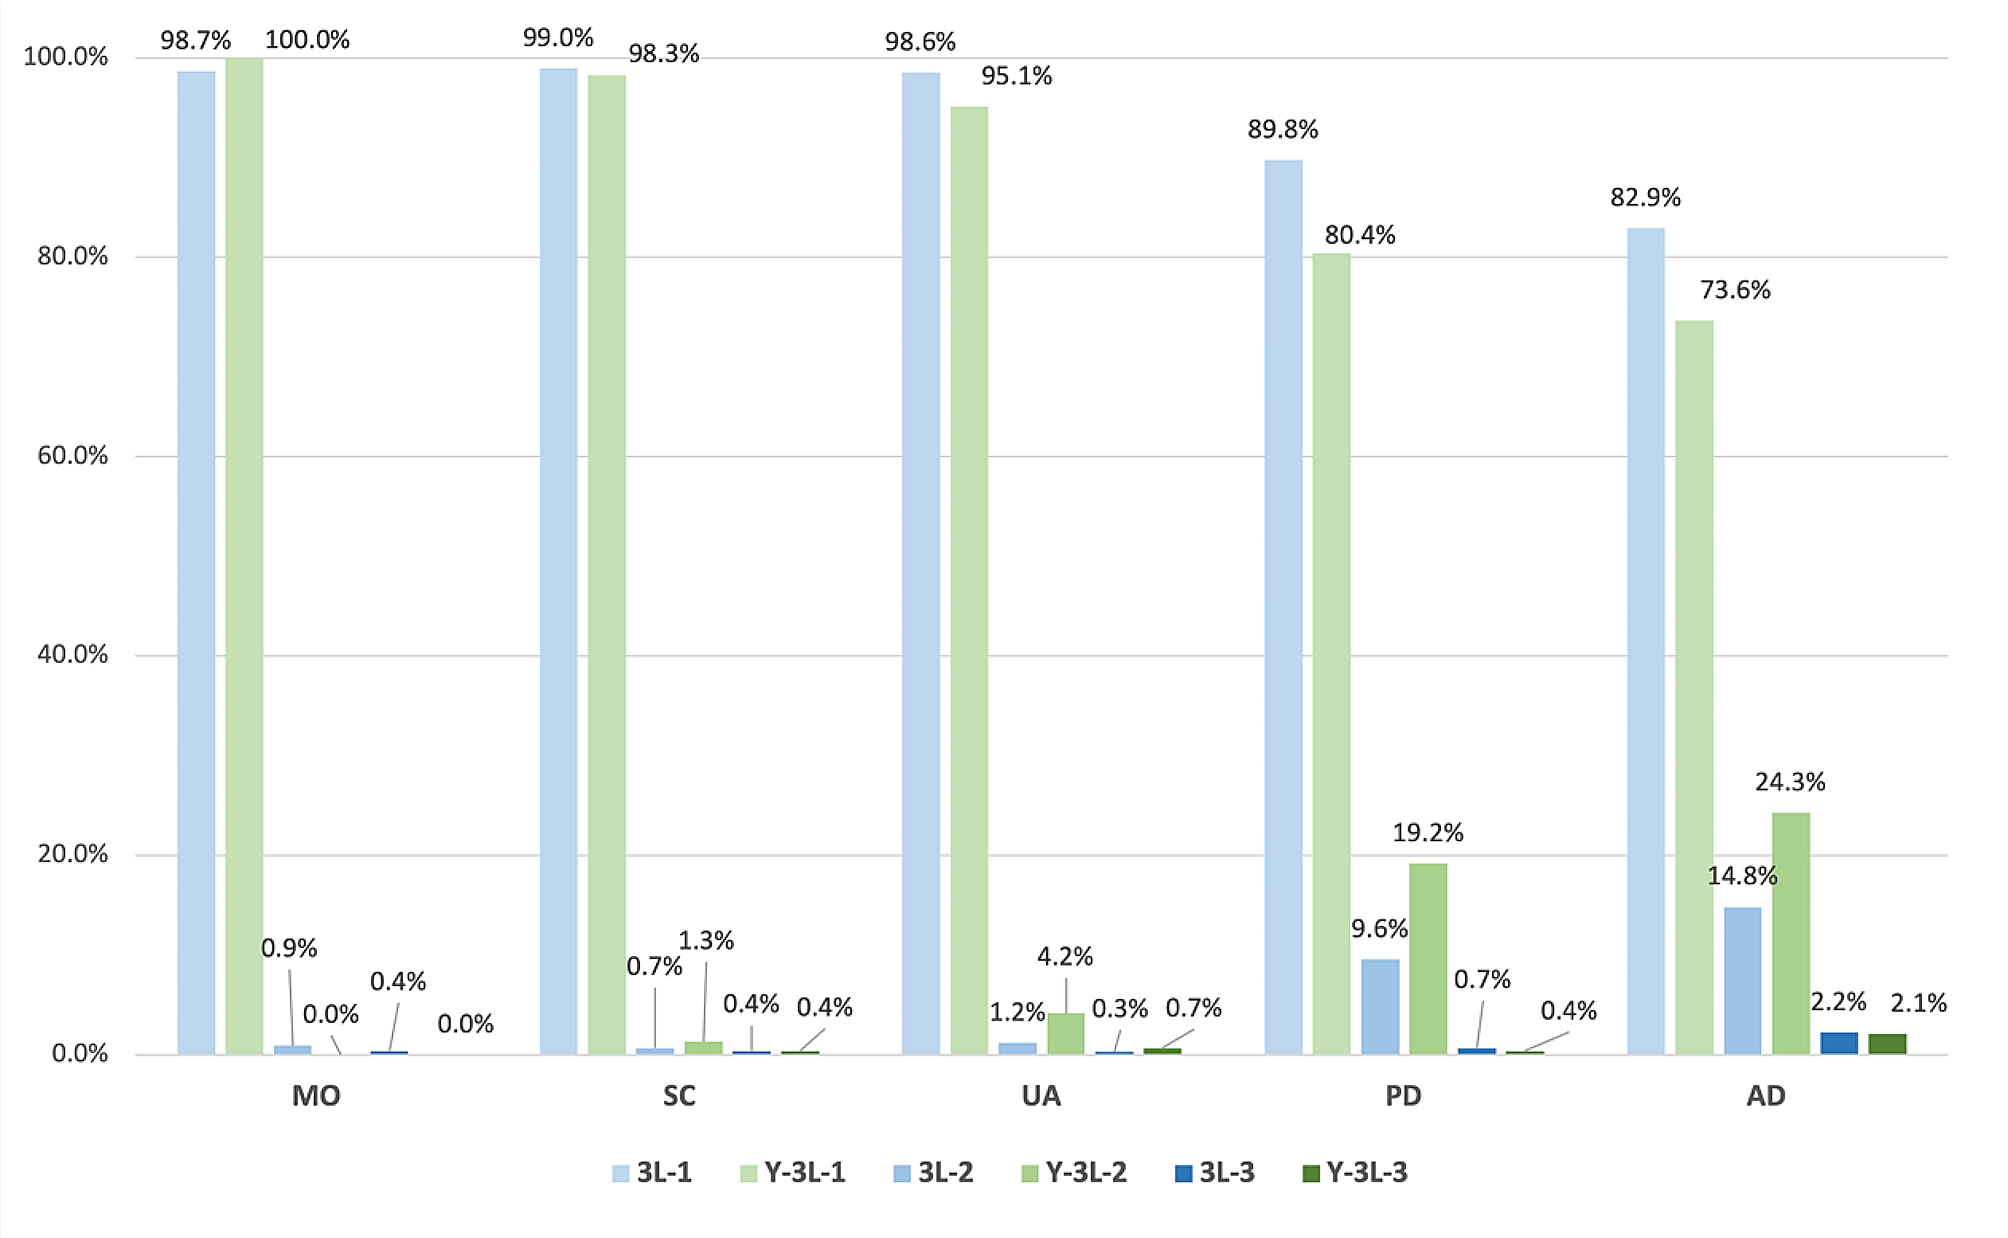
The EQ-5D is a generic preference-based questionnaire designed to measure health-related quality of life. It comprises five dimensions (mobility, self-care, usual activities, pain/discomfort, and anxiety/depression). The instrument was initially developed using three levels (no problem, some problem and extreme problem) for each dimension in the 1990s [28] and then adapted to five levels (no problems, slight problems, moderate problems, severe problems, and extreme problems) in 2011 [29]. The EQ-5D-5L has been demonstrated to outperform EQ-5D-3L in aspects of feasibly, ceiling effect, discriminatory power, and convergent validity [30,31,32]. Both the EQ-5D-3L and the EQ-5D-5L have been translated into Chinese and have demonstrated excellent reliability and validity in measuring and valuing health status [33]. The Chinese value set was employed to estimate health utility values. The values calculated from the EQ-5D-3L and EQ-5D-5L tariffs for China range from − 0.149 to 1 [34], and from − 0.391 to 1, respectively [35]. The higher values of EQ-5D indicate better health, with 1 representing perfect health, 0 corresponding to death and negative values representing health status worse than death.
Source measures
In accordance with previous studies on AS mapping [12, 17,18,19,20], predictive variables included BASDAI, BASFI and age. The BASDAI, developed by Garrett, is a self-administered questionnaire comprising six items attributed to five major symptoms of the AS disease. Each item was recorded on an 11-point numerical rating scale, with 0 representing no problem and 10 representing the most serious problem, in order to assess the severity of the five symptoms. The BASDAI score ranged from 0 to 10, with equal weight being given to each symptom. The BASDAI questionnaire has been translated into Chinese and has been demonstrated to be reliable and valid for the assessment of the status and activity of patients with AS in China [36].
The BASFI is also a self-assessment questionnaire comprising of 10 items. Eight of these items reflect impairment of function, while the remaining two items related to the ability of daily life. Each item is rated on a horizontal visual analogue scale and with a length of 10 cm, and scored from 0 (easy) to 10 (impossible). The BASFI score was calculated as the mean of 10 items, with scores ranging from 0 to 10. Higher scores indicated worse function or status. Lin also translated the BASFI questionnaire into Chinese and verified its good reliability and validity among Chinese patients with AS [36].
Statistical analysis
The data analysis strategy followed the “Good Practice for Mapping Studies” developed by ISPOR [15]. The frequency and percentage were employed to describe the fundamental characteristics of categorical variables. The distribution of continuous variables was described using means, standard deviations, minimum, and maximum. Additionally, a histogram was employed to graphically display the distribution of EQ-5D values.
The normality of the data was tested using the Shapiro-Wilk test. Due to the non-normal distribution of continuous variables, Spearman rank correlation coefficients were employed to assess the conceptual overlap between BASDAI scores, BASFI scores and EQ-5D values. Furthermore, the relationship between each item of BASDAI with BASFI and each EQ-5D dimension score was tested using Spearman rank correlation coefficient.
We employed both direct and indirect approaches to develop the mapping algorithm. In the direct approach, statistical models were selected according to the distributional characteristics of EQ-5D values, including inflation at 1, skewness, multimodality, and gaps in the range of feasible values [15]. The initial approach involved the use of ordinary least squares (OLS) regression, the most common method, to predict EQ-5D values. However, a previous review demonstrated that the predicted values of OLS exhibited systematic bias, including values outside the feasible range, underestimation for patients with good health, and overestimation for patients with severe health conditions [37]. Secondly, in order to address the inflation of EQ-5D values at 1, we explored censored least absolute deviations (CLAD) and Tobit models [16]. Thirdly, the EQ-5D utility score was frequently dramatically skewed, bounded at bottom and top values, and inflated at the upper limit. Previous studies have demonstrated that bespoke regression models, such as the adjusted limited dependent variable mixture model (ALDVMM) [38] and the beta-mixture (BM) model [39], exhibit superior performance to traditional models in predicting EQ-5D scores. The ALDVMM and BM outperformed the basic regression model in several aspects. These included the ability to capture the multimodality of EQ-5D values, to account for gaps between 1 (full health) and the nearest feasible value, and to deal with boundary values [39]. The Stata commands “aldvmm” and “betamix” were employed to fit the ALDVMM and BM models, respectively [40, 41].
In terms of indirect mapping approach, both ordered logit (Ologit) and multinomial logit (Mlogit) methods were employed. The procedures described by Gray [42] and Hernández Alava [43] were followed to estimate five Ologit and Mlogit models for each EQ-5D dimension. These models were used to predict the probability of a given response level in the first step. Subsequently, the EQ-5D values were calculated based on the probabilities of each level of each dimension and the Chinese EQ-5D tariffs.
In the present study, no suitable external dataset could be identified as a validation sample. Consequently, we employed in-sample five-fold cross-validation to validate the mapping algorithm, following the methodology previously described by [44]. Firstly, the primary data were divided into five distinct categories. Secondly, four subsamples were employed as estimation data, while the remaining subsample was retained as validation data in order to evaluate predictive performance. Thirdly, the aforementioned process was repeated five times, with each subsample serving as validation data on one occasion.
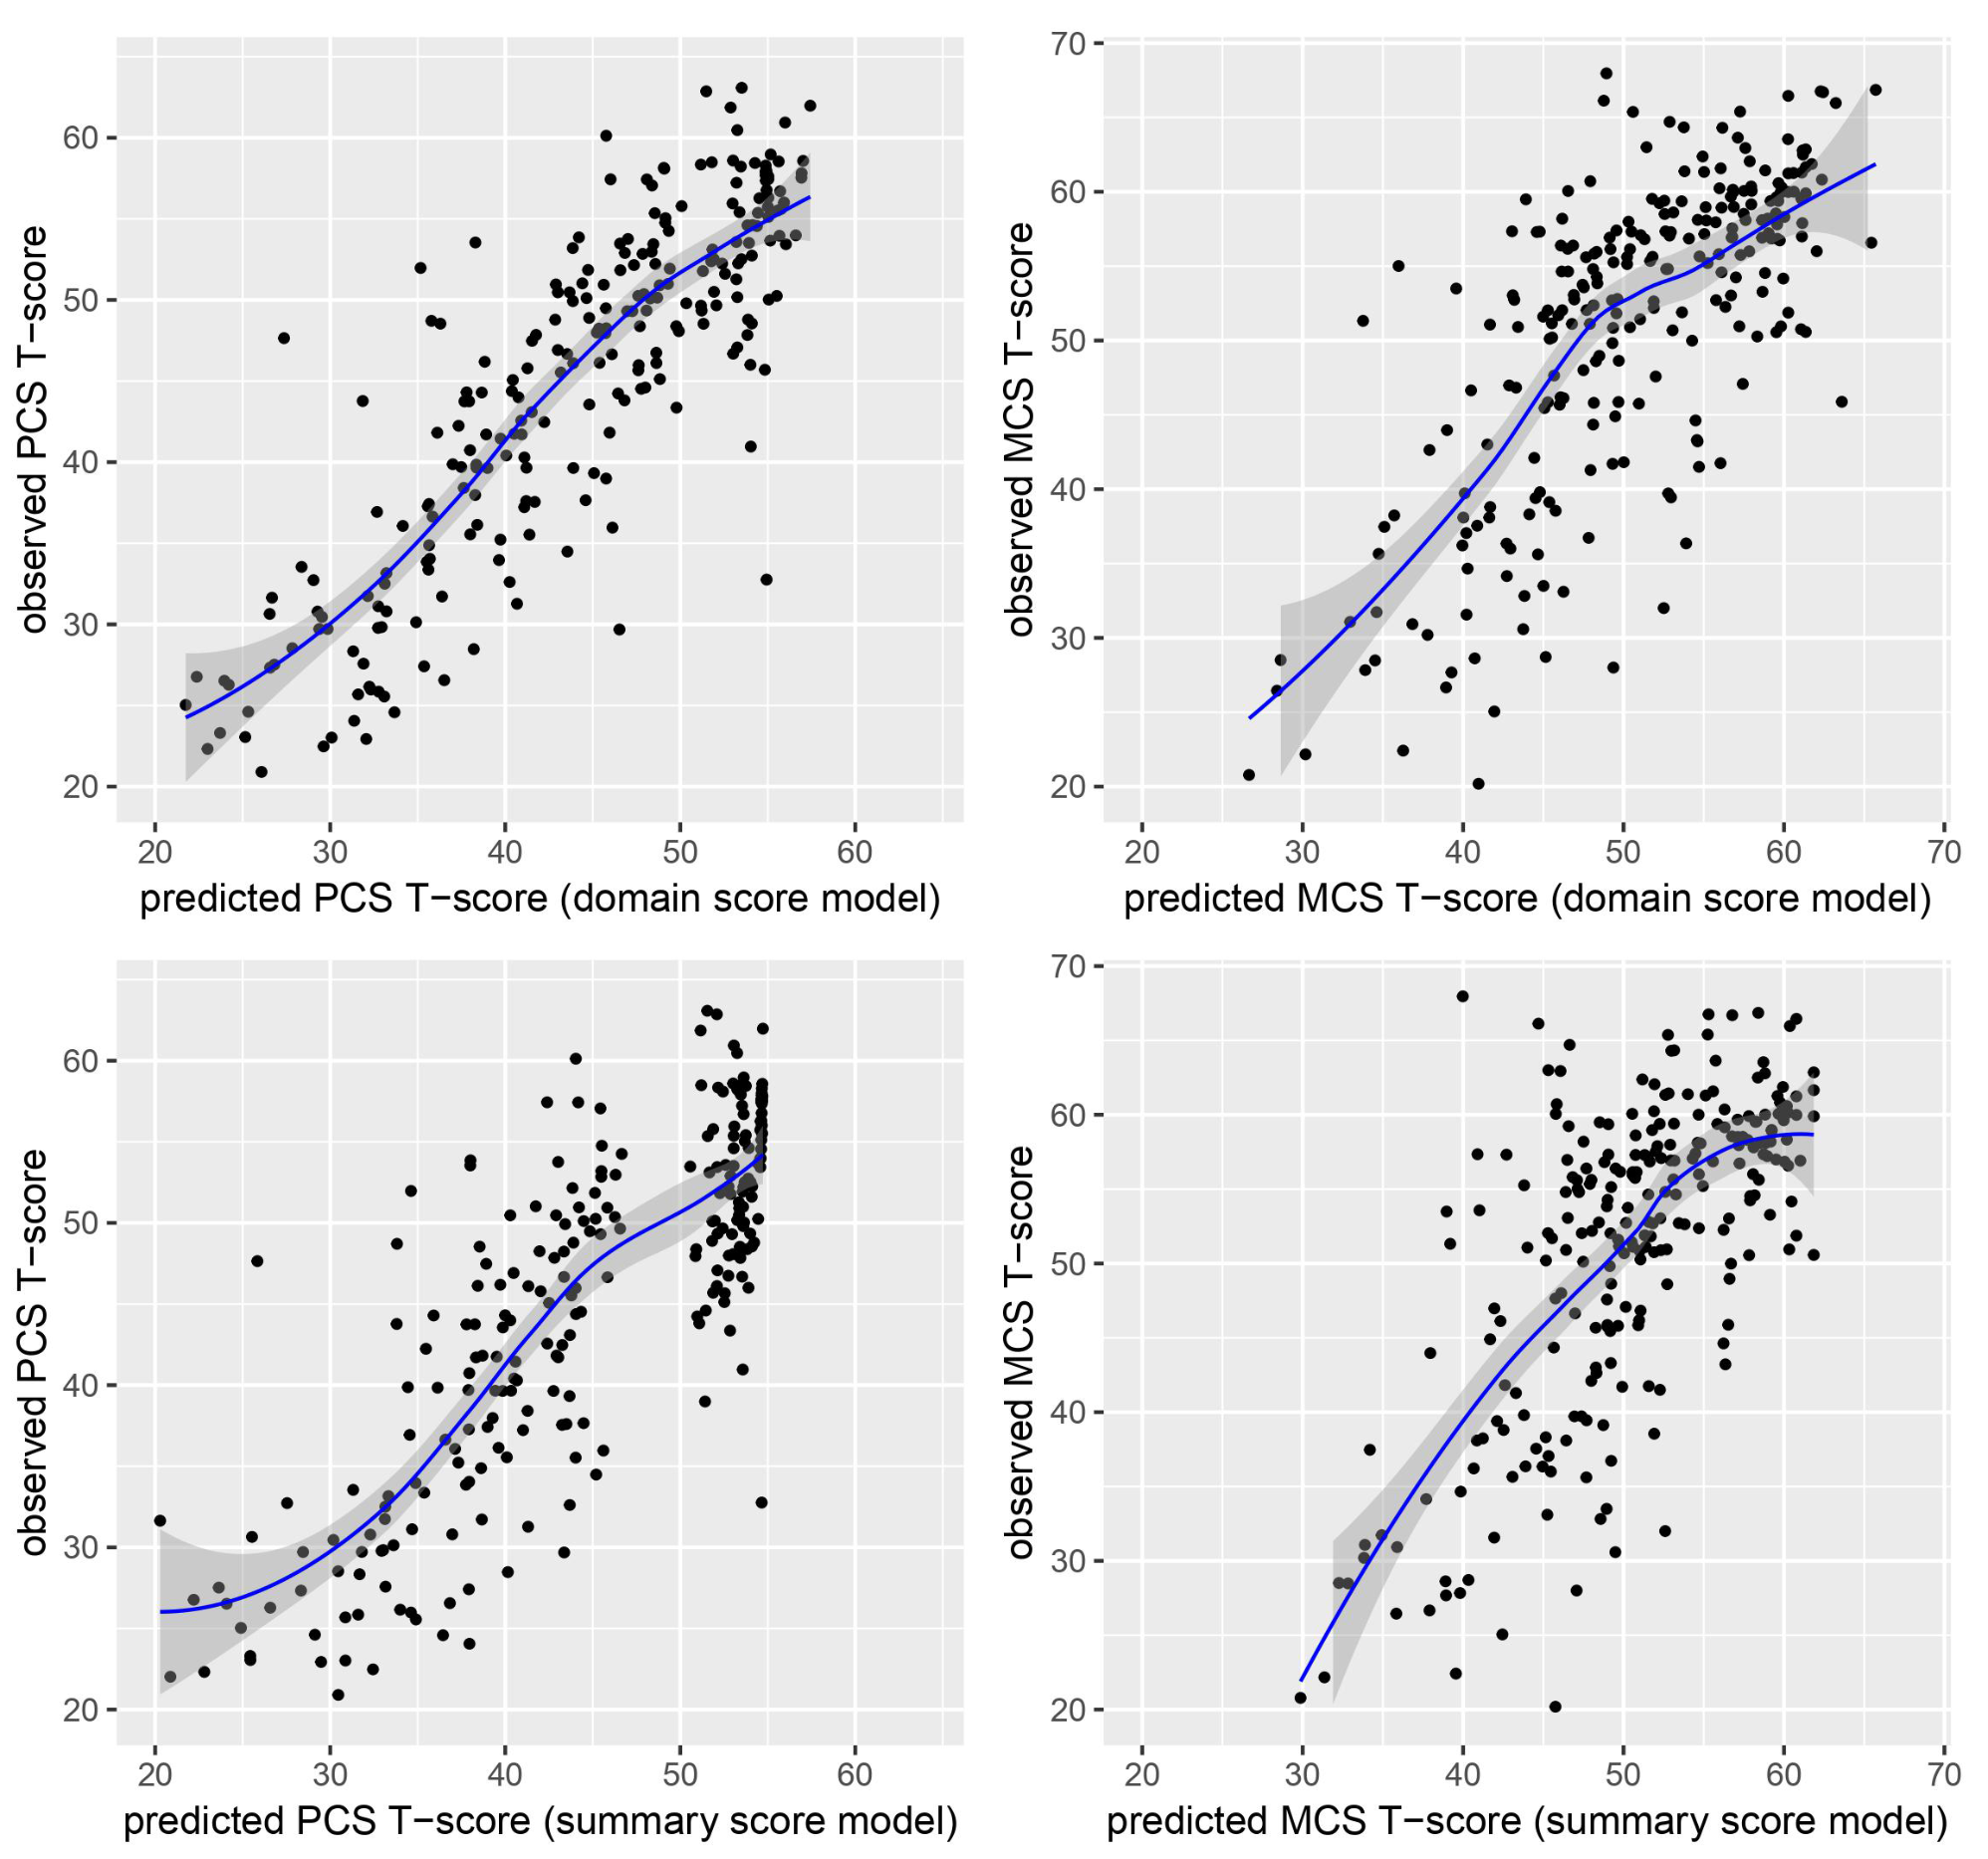
In accordance with good mapping best practices [15], the mean absolute error (MAE) and root mean squared error (RMSE) were employed to assess the predictive performance of each model type and specification. Furthermore, Spearman’s correlation coefficient and concordance correlation coefficient (CCC) were employed as performance indicators to assess the concordance between observed and predicted EQ-5D values. The CCC was a robust indicator for evaluating the correlation between observed and predicted values from uniform or other non-uniform distributions [45]. The model with the lowest MAE and RMSE, as well as the highest Spearman’s correlation coefficient and CCC values, demonstrated superior predictive performance in comparison to other models. The models were ranked according to four performance indicators, and the model with the lowest averaging rank was selected as the best-performing one [46]. Furthermore, the mean, standard deviation, minimum and maximum of observed and predicted EQ-5D values were compared. A scatter plot between observed and predicted EQ-5D values was drawn to identify any potential bias. A variance-covariance matrix was constructed to conduct a probabilistic sensitivity analysis for future economic evaluation.
All data analysis was conducted in Stata 15.0 (Stata Corp LP, College Station, Texas, USA) [47]. The threshold for statistical significance was set at P < 0.05.

留言 (0)