
記住我


Altogether 661 patients met the inclusion criteria. Investigating the descriptive statistics of the new TNM8 group, p16 positive oropharyngeal cancer patients were younger than p16 negative OPSCC or other HNSCC groups with mean ages 58, 63 and 63 years at diagnosis, respectively. Of p16 positive OPSCC patients, 42% had a regular smoking history and 20% did abuse alcohol at diagnosis, however, these numbers for p16 negative OPSCC and other HNSCC patients were 73%, 41%, and 66%, 44%, respectively (p < 0.001 for both tobacco and alcohol abuse, Chi-squares are 72.561 and 20.567).
Comparing stages of the HNSCC patients, most belonged to stage 4 (48%) while stage 3 group included 18%, stage 2 17% and stage 1 comprised 15% of patients, whereas 3% had incomplete staging. Further descriptive statistics are displayed in Tables 2, 3 and 4.
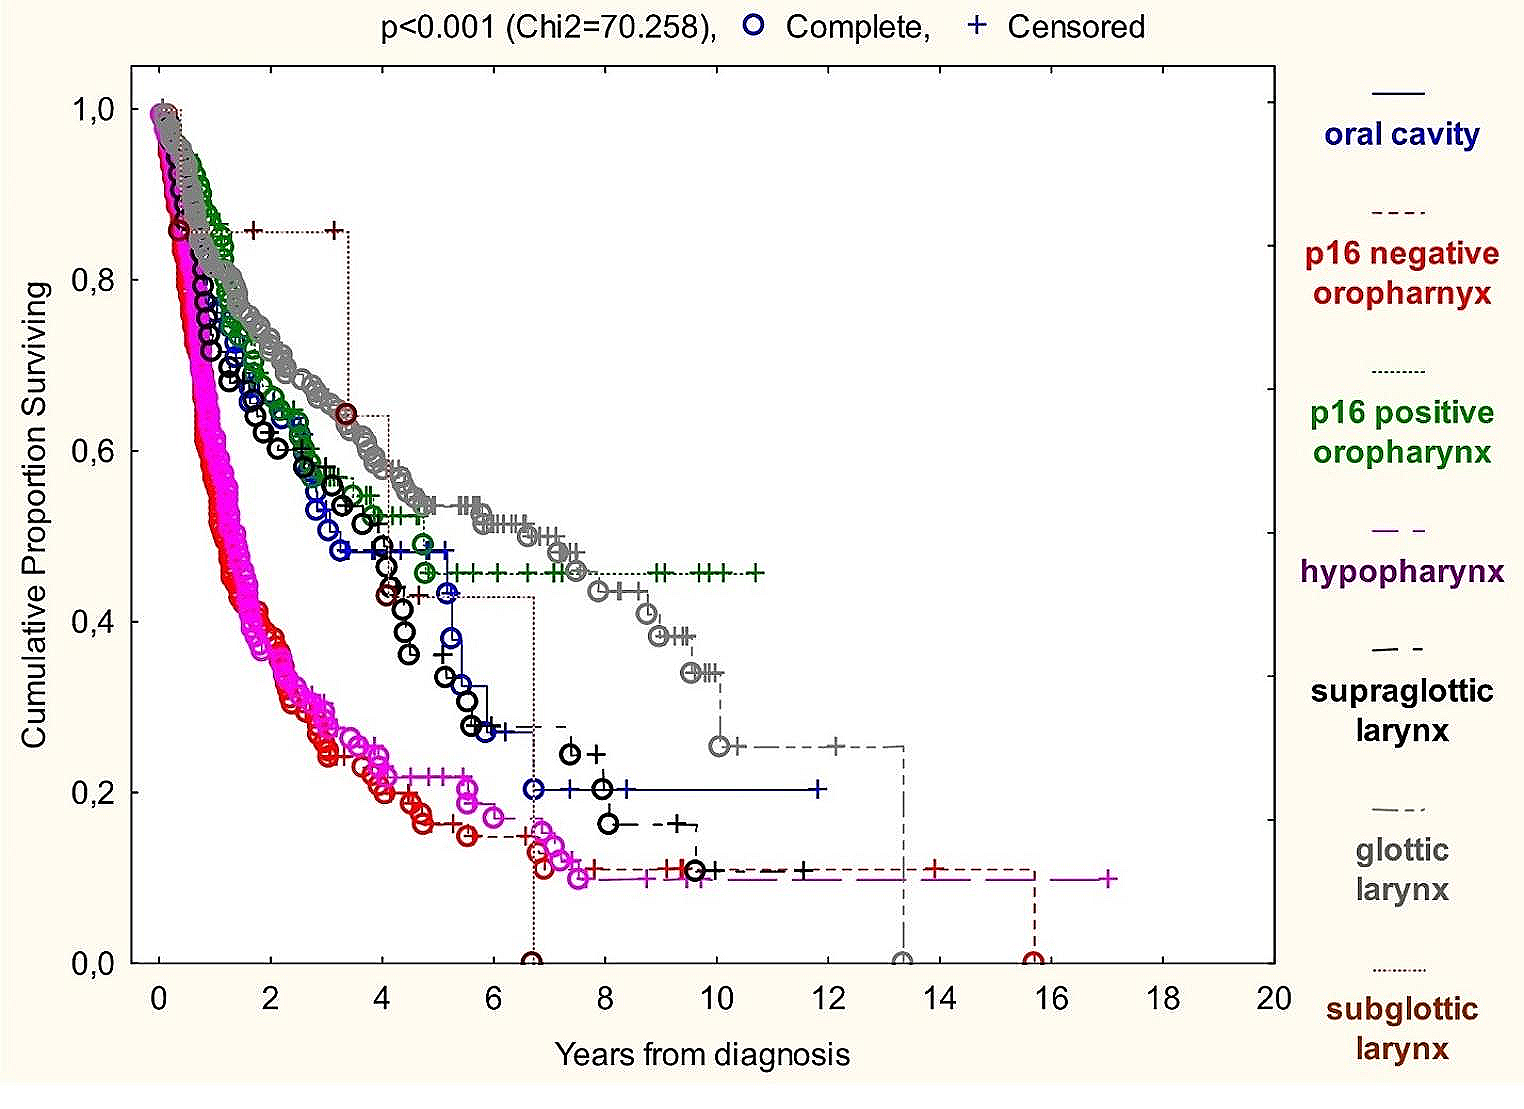
Table 2 Descriptive statistics: tumor characteristics. Data presentation: “number (% of known)”Table 3 Descriptive statistics: patient demographics. Data presentation: “number (% of known)”Table 4 Descriptive statistics: nutritional status markers. Data presentation: “number (% of known)”Analyzing Kaplan-Meier curves (Graph 1), the best OS among TNM8 groups was associated with glottic laryngeal and p16 positive oropharyngeal cancer patients, while p16 negative oropharyngeal and hypopharyngeal carcinomas had the most devastating prognosis. Subglottic patients’ OS was inconclusive due to the small sample size.
Graph 1
Kaplan-Meier overall survival analysis of TNM8 HNSCC groups
Median survival times of patients with at least five-year surveillance were the following: 7.0 months assuming the whole sample, 8.0 months for oral cavity, 4.4 months for p16 negative and 7.4 months for p16 positive oropharyngeal, 40.6 months for hypopharyngeal, 8.5 months for supraglottic-, 9.5 for glottic- and 11.8 for subglottic laryngeal squamous cell carcinoma patients.
Kolmogorov-Smirnov test proved deviation from normal distribution in the case of cholesterol, albumin, PNI, NRI, GNRI with p > 0.20.
Spearman rank order test have proven correlation at 1% significance level between BMI and weight loss, and between PNI, NRI, GNRI and CONUT.
We performed univariate Cox-regressions for overall survival and cancer specific survival in each TNM8 group (Tables 5 and 6). If the results of both analyses were significant with unidirectional risk ratios, we only indicated results of the more widely used OS, otherwise we presented both OS and CSS.
Table 5 Univariate Cox-regression with overall survival. (x: insufficient data amount), if p < 0.05, RR = risk ratio, CI = confidence interval at p = 0.05Table 6 Univariate Cox-regression with cancer specific survival. (x: insufficient data amount), if p < 0.05, RR = risk ratio, CI = confidence interval at p = 0.05Graph 2 with pChi2 <0.001 underlines the BMI paradox in for the whole head and neck squamous cell cancer sample, but according to univariate Cox-regressions of TNM8 groups (Tables 5 and 6), oral cavity and p16 negative oropharyngeal cancer patients’ OS and CSS is independent of BMI status. Surprisingly p16 positive OPSCC fits in the row of “average” HNSCC behavior in this aspect.
Graph 2
Kaplan-Meier overall survival analysis of BMI groups
Carbamide/creatinine ratio as theoretical catabolism marker did not affect OS or CSS. Hemoglobin strongly correlated with survival. Several parameters were significant only on the whole sample, but not in smaller subgroups: BMI before diagnosis (p = 0.003, RR = 0.965), total lymphocyte count (p < 0.001, RR = 0.740), serum albumin (p = 0.001, RR = 0.956), total protein (p = 0.036, RR = 0.980), cholesterol (p = 0.037, RR = 0.822), carbamide (p < 0.001, RR = 0.818), creatinine (p < 0.001, RR = 0.983), NRI (p = 0.003, RR = 0.969), GNRI (p < 0.001, RR = 0.968) and CONUT scores (p = 0.031, RR = 1.246) are of this assessment.
Graph 3
Kaplan-Meier overall survival analysis based on percent of weight loss
The markers correlating with survival even in subgroups were BMI at diagnosis, percent of weight loss over six months and prognostic nutritional index (PNI) with risk ratio of 0.938 (p < 0.001), 1.050 (p < 0.001) and 0.947 (p < 0.001) on the total sample, respectively (Graphs 2, 3 and 4). Performing univariate Cox-regressions revealed the following:
Only PNI correlated with oral cavity cancer patients’ OS (p = 0.022, RR = 0.899) and percent of weight loss correlated with their CSS alone (p = 0.018, RR = 1.058).
Percent of weight loss (p = 0.016, RR = 1.031) and PNI (p = 0.003, RR = 0.918) correlated with p16 negative OPSCC patients’ OS.
All three correlated with p16 positive OPSCC patients’ OS: BMI at diagnosis (p = 0.013, RR = 0.917), percent of weight loss (p = 0.001, RR = 1.067), PNI (p = 0.019, RR = 0.871).
Only BMI at diagnosis correlated with hypopharyngeal cancer patients’ OS (p = 0.010, RR = 0.941). Only in stage 4 did BMI prove to significantly affect OS (p = 0.022, RR = 0.937).
All three correlated with glottic laryngeal patients’ OS: BMI at diagnosis (p = 0.001, RR = 0.914), percent of weight loss (p < 0.001, RR = 1.128), PNI (p < 0.001, RR = 0.901).
BMI at diagnosis and percent of weight loss did not correlate with subglottic patients’ OS. Sample size was not sufficient to run Cox regression with PNI.
None of any investigated nutritional status markers correlated significantly with supraglottic laryngeal cancer patients’ survival.
Different groups owe different distribution of disease severity. To eliminate this confounder effect, we used uni- and bivariate Cox proportional hazards regression (Table 7). Stage 4 patients are set as baseline for risk evaluation, as this have the most considerable impact on all tests results, being the largest sample group (with 48% of patients). As BMI and percent of weight loss are strongly related (Spearman’s rank correlation coefficient is -0.452, p < 0.01) we could not perform bivariate regression with these markers. R2 values indicating goodness of fitting are distributed from 0.354 to 0.462. In the case of percent of weight loss and BMI categories, their prognostic value depended on tumor stage (as it has proven a risk factor in the regression model). PNI category’s predictive effect was independent of stage making it the most suitable nutritional status marker for everyday screening.
Table 7 Cox proportional hazards regression model based on cancer specific survival. Marker categories (no, low, medium, or high-risk to malnutrition) are the covariates, and stages according to TNM8 are the factors. Stage 4 is set as baselineBivariate Cox proportional regression proved BMI and PNI both affect survival when applied together. (R2 = 0.450, pBMI=0.003, RRBMI=1.603, pPNI<0.001, RRPNI=1.429)
After running Receiver Operating Characteristic (ROC) analysis, we have found similar sensitivity and specificity properties of the observed parameters determining five-year survival. PNI proves the best performance (area under ROC curve = 0.704, p = 0.005), followed by BMI at diagnosis (area under ROC curve = 0.686, p = 0.010) and percent of weight loss (area under ROC curve = 0.324. As it negatively correlates with OS, we have to divide it from 1 to be comparable with other parameters, which equals to 0.676. p = 0.015).
Graph 4
Kaplan-Meier overall survival analysis of PNI groups
留言 (0)