
記住我
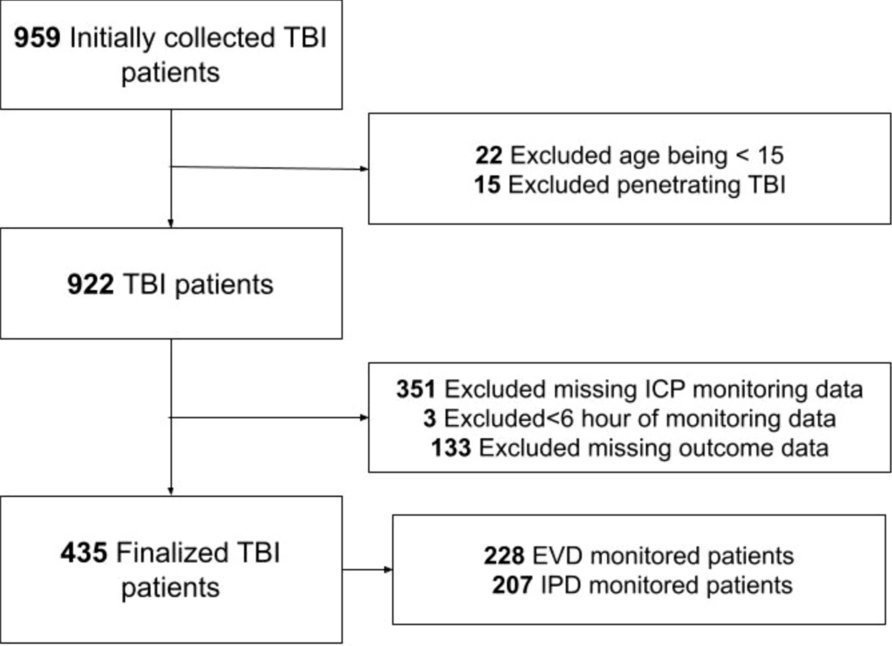


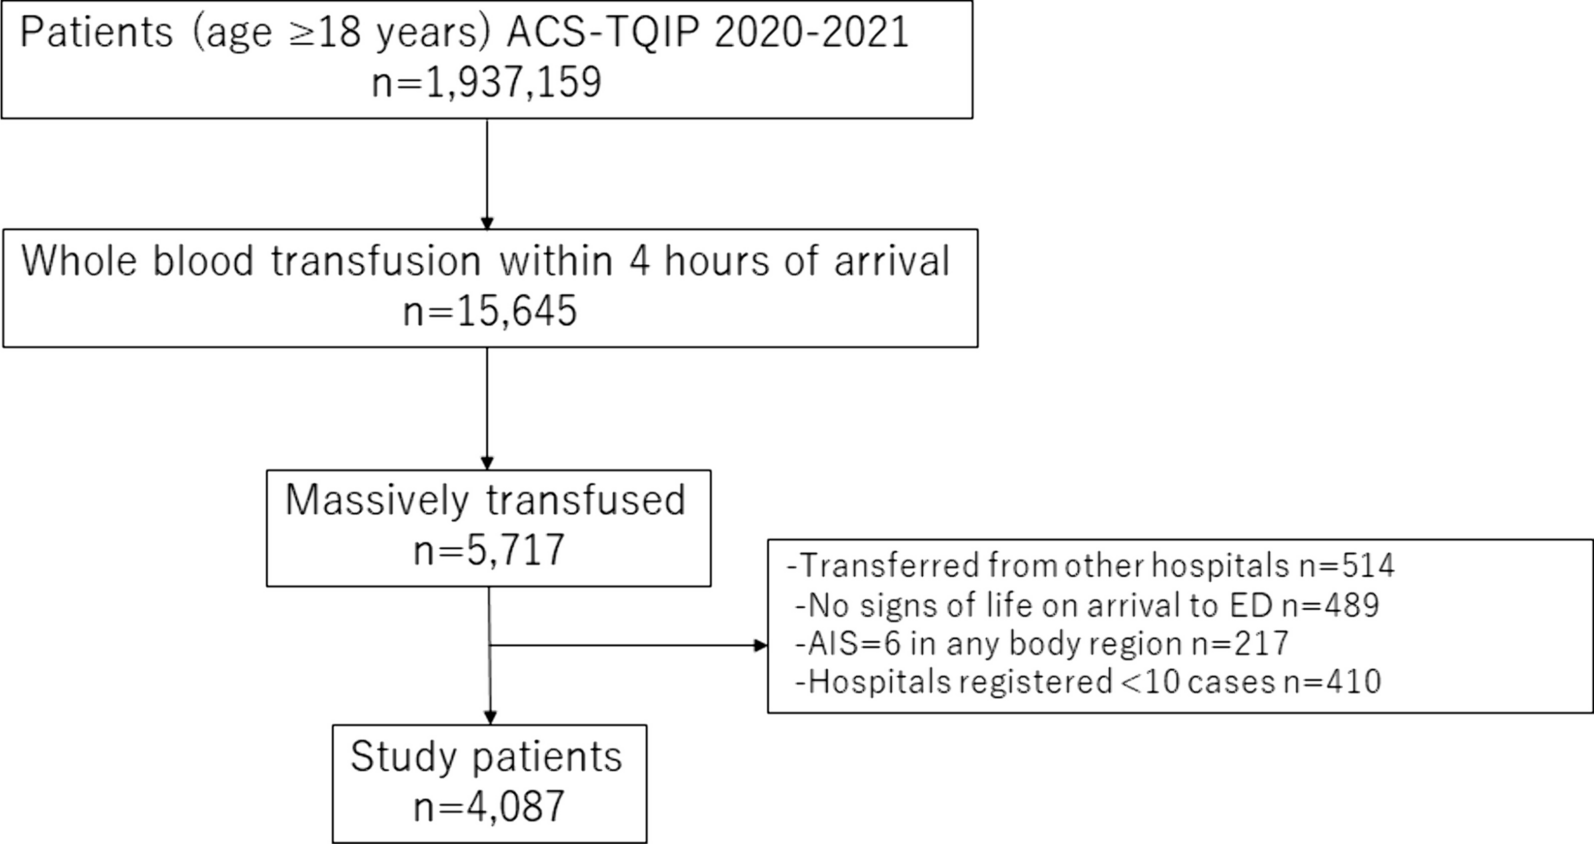
In total, a cohort of 132 comatose patients with OHCA that was presumed to have a cardiac cause were screened. Of these patients, 24 patients had unwitnessed asystole, 47 patients had hemodynamic instability, 8 patients had a previous history of brain disease, 6 patients had contraindications for MRI, 3 patients had a hemoglobin concentration less than 120 g/L, 4 patients refused to be enrolled, 3 patients had significant artefacts on MRI due to obvious head motion, and 6 patients lost to follow-up. Thus, 31 patients were ultimately included in the study (Fig. 1). Notably, 90-days after ROSC, 12 (39%) and 19 (61%) patients were assigned to the CPC 1–2 and CPC 3–5 groups, respectively. And 8 (CPC = 5) of these patients died. Moreover, 20 healthy right-handed volunteers were recruited for the control group. The baseline characteristics of the patients are shown in Table 1. There were no significant differences between the groups regarding age, sex, years of education or vascular risk factors. The median time from CA to ROSC in the CPC 3–5 group was greater than that in the CPC 1–2 group (25 min vs. 17 min, P = 0.010). The median value of SjvO2, serum NSE, SSEP responses, and the left N20-baseline amplitude were significantly different between the two groups.
Fig. 1
Flow diagram of patients based on CONSORT
Table 1 Baseline demographic data and arrest characteristicsCharacteristics of rs-fMRI BOLD signals in cardiac arrest patientsALFF method was conducted to measure the activity of different brain regions in CA patients (Table 2 and Additional file 1: Table S1). The mean ALFF values of the whole brain were significantly greater in CA patients than in healthy controls (P = 0.010). Moreover, ALFF values were elevated in some brain regions but decreased in others (Fig. 1). Compared with healthy controls, the ALFF values in the bilateral precuneus cortex of post-resuscitated patients were significantly lower, with a total cluster size of 387 voxels (P < 0.001, Fig. 2A). However, increased ALFF values were observed in the bilateral paracentral lobule, the postcentral gyrus, median cingulate, and white matter of the right frontal, parietal, and insula lobes, with a total cluster size of 948 voxels (P < 0.001, Fig. 2B, C). Compared to the CPC 3–5 group, the CPC 1–2 group had significantly elevated ALFF values in the left middle temporal gyrus cortex and inferior temporal gyrus cortex, with a cluster size of 330 voxels (P = 0.002, Fig. 2D).
Table 2 The abnormal rs-fMRI BOLD signals clusters in localized brain regions of patients with cardiac arrestFig. 2
The abnormal rs-fMRI BOLD signals clusters in localized brain regions of patients with cardiac arrest. Clusters indicating regions with significant increases in activity are highlighted in red-yellow, while those with significant decreases in activity are depicted in blue-white. In comparison to the healthy controls, CA patients exhibited reduced BOLD signals primarily in the cortex, while increased BOLD signals were predominantly distributed in subcortical areas. Patients in the CPC 1–2 group showed increased BOLD signals in the cortical regions compared to those in the CPC 3–5 group
The fALFF values were also measured in different subgroups (Table 2 and Additional file 1: Table S1). Whole-brain mean fALFF values in CA patients were not significantly different from those in healthy controls (P = 0.057). However, the fALFF values of the cortical regions in the bilateral superior parietal gyrus, bilateral occipital lobes, left cerebellum, and right temporal lobe were significantly lower in CA patients than in healthy controls (all P < 0.05, Fig. 2E).
There were also significant differences in the ReHo values between groups (Table 2 and Additional file 1: Table S1). Compared with healthy controls, the ReHo values in the bilateral frontal and parietal lobes, occipital lobe, and median and posterior cingulate gyrus were decreased in CA patients, with a total cluster size of 2732 voxels (all P < 0.001, Fig. 2F). However, the CA patients had significantly increased ReHo values in the bilateral fusiform gyrus, hippocampus, parahippocampus, insula, cerebellum (4–5), vermis (1–5), right putamen, and white matter of bilateral temporal lobe, with a total cluster size of 7784 voxels, with the majority of these voxels located in the subcortex (P = 0.002, Fig. 2G). Compared with the CPC 3–5 group, the CPC 1–2 group showed elevated ReHo values of the cortical regions in the right precentral gyrus, superior frontal gyrus, middle frontal gyrus, and bilateral parietal lobe, with a cluster size of 330 voxels (P < 0.001, Fig. 2H). However, significantly decreased ReHo values in the subcortical regions were observed, significant reductions were noted in the left insula, left hippocampus, parahippocampal region, and the white matter of the left frontal and temporal lobes in the CPC 1–2 group compared to the CPC 3–5 group (all P < 0.01, Fig. 2I).
Predictive potential of rs-fMRI BOLD signals: ROC curve analysisROC curves were established to evaluate the predictive qualities of the rs-fMRI BOLD signals (Additional file 2: Table S2). Among the clusters with abnormal ALFF values, the maximum area under the curve (AUC) for predicting prognosis of CPC 3–5 was found in the cluster of the left middle temporal gyrus and inferior temporal gyrus, with an AUC of 0.794 (P = 0.007, Fig. 3 red line). Among the clusters with abnormal fALFF values, the cluster of the left superior parietal gyrus had the highest AUC for predicting prognosis of CPC 3–5, with a value of 0.728 (P = 0.035, Fig. 3 yellow line). The maximum AUC of the ReHo values for predicting prognosis of CPC 3–5 was observed in the cluster of the right precentral gyrus, superior frontal gyrus, and middle frontal gyrus, with an AUC of 0.943 (P < 0.001, Fig. 3 blue line). Interestingly, the AUC of the serum NSE concentration for predicting prognosis of CPC 3–5 was 0.820 (P = 0.003, Fig. 3 green line).
Fig. 3
Receive operating characteristic curve for predicting poor prognosis of rs-fMRI BOLD signals and serum NSE concentration in post-resuscitated patients. Areas under the curve (AUCs) for poor prognosis: the ALFF values in the cluster of left middle temporal gyrus and inferior temporal gyrus (red line) 0.794, the fALFF values in the cluster of left superior parietal gyrus (yellow line) 0.728, the ReHo values in the cluster of right precentral gyrus, superior frontal gyrus and middle frontal gyrus (blue line) 0.943, the serum NSE concentration (green line) 0.820
Correlations between rs-fMRI BOLD signals and CPC scoresCorrelation analyses were performed between the rs-fMRI BOLD signals and CPC scores in CA patients. Among the clusters with abnormal ALFF values, the best correlation was found in the cluster of the left middle temporal gyrus and inferior temporal gyrus, which showed negative correlation with the CPC score (r = − 0.630, P < 0.001, Fig. 4A). Abnormal fALFF values of all the clusters had poor correlations with CPC scores (P > 0.05). However, among the clusters with abnormal ReHo values, the cluster values of the right precentral gyrus, superior frontal gyrus and middle frontal gyrus showed a strong negative correlation with CPC scores (r = − 0.812, P < 0.001, Fig. 4B).
Fig. 4
The correlation between the rs-fMRI BOLD signals and CPC score and the correlation between the mean ALFF values of whole-brain. The ALFF values of the clusters in the left middle temporal gyrus and inferior temporal gyrus showed a significant negative correlation with the CPC score (r = -0.630, P < 0.001). A The ReHo values of the clusters in the right prefrontal, superior frontal, and middle frontal gyri showed a strong negative correlation with the CPC score (r = − 0.812, P < 0.001). B The mean ALFF values of whole brain showed a strong positive correlation with SjvO2 (r = 0.910, P < 0.001). C The dashed line in the figure is the regression line with 95% confidence intervals of the slope
Correlations between rs-fMRI BOLD signals and SjvO2Although the ALFF values in the brains of CA patients were elevated in some brain regions and decreased in others, the mean ALFF values of the whole brain were significantly greater in CA patients than in healthy controls (P = 0.010). Interestingly, there was a strong correlation between the mean ALFF and SjvO2 in CA patients (r = 0.910, P < 0.001, Fig. 4C). The mean fALFF values and mean ReHo values of the whole brain had a poor correlation with SjvO2.
Correlations between rs-fMRI BOLD signals and SSEP responsesWe analyzed the correlations between the rs-fMRI BOLD signals of the left thalamus, insula, postcentral gyrus and rolandic operculum and SSEP N20-baseline amplitude. CA patients were divided into CPC 1–2 group and CPC 3–5 group, and then CPC 3–5 group was categorized into N20 presence and absence groups. The median ALFF, fALFF and ReHo values in each group are shown in Table 3. There were no differences between healthy controls and those in the CPC 1–2 group (P > 0.05). However, the rs-fMRI measurements in the CPC 1–2 group showed a stepwise change compared to those in the N20 presence and absence groups. The most significant differences in the conduction pathways were the rs-fMRI BOLD signals in the thalamus (all P < 0.001). Correlation analysis revealed that the SSEP N20-baseline amplitudes in CA patients were negatively correlated with thalamic BOLD signals, including ALFF (r = − 0.777, P < 0.001, Fig. 5A), fALFF (r = − 0.586, P = 0.001, Fig. 5B), and ReHo (r = − 0.643, P < 0.001, Fig. 5C).
Table 3 The rs-fMRI BOLD signals of localized brain regions within the intracerebral conduction pathways for SSEPFig. 5
The correlation between the rs-fMRI BOLD signals of thalamus and the SSEP N20-baseline amplitudes. The SSEP N20-baseline amplitudes were negatively correlated with the thalamic BOLD signals, including the ALFF values (r = − 0.777, P < 0.001), A the fALFF values (r = − 0.586, P = 0.001), B and the ReHo values (r = − 0.643, P < 0.001), C the dashed line in the figure is the regression line with 95% confidence intervals of the slope
留言 (0)