Clinical research design
All health screening examinees from the Department of Endocrinology in Northwest Women’s and Children’s Hospital from March to June 2022 were invited to participate in this study. The exclusion criteria for participants (in both the control and case groups) were ① those with tumours, liver diseases, asthma, autoimmune diseases, blood system diseases, chronic renal failure, and other systemic diseases; ② those with HIV infection and other infectious diseases; and ③ those who had used antibiotics or hormones within 3 m before participating. According to the diagnostic criteria for IR, the participants included were divided into healthy (control) and IR (case) groups with equal numbers. The included participants filled out structured questionnaires to collect basic information, and their venous blood and saliva were also collected for subsequent testing.
Sample size calculation
In 2021, a cross-sectional pilot study was conducted at Northwest Women’s and Children’s Hospital. In this study, 100 healthy and 100 IR participants were randomly selected. These participants, who were between 32 and 56 years old, all signed informed written consent forms. The percentage of P. gingivalis isolated from the saliva of healthy participants was 31.0%, while that from the saliva of IR participants was 56.0%. Based on 90% power (β = 0.1) and a 5% significance level (α = 0.05) to detect differences between groups, PASS 2021 software (version 21.0.3, NCSS Statistical software, East Kaysville, Utah, USA) was used to calculate the needed sample size for this study. The results suggested that at least 80 participants were needed in each group. To account for an estimated 10% sample loss, 90 participants were ultimately included in each group.
Structured questionnaires
All participants were distributed structured questionnaires to collect relevant information. The structured questionnaire was divided into three main parts: demographic characteristics, behaviours, and health-related information. The demographic characteristics included age, sex, educational attainment, occupation and annual family income. Based on educational attainment, occupation, and annual family income, socioeconomic status (SES) was calculated.45 According to the rating, the SES was divided into 5 levels. Behaviours included smoking and alcohol consumption. Participants who smoked more than 100 cigarettes per year for more than 1 year were considered to have a smoking habit. Participants who consumed more than 1 g of alcohol per day consistently within the past month were considered to have an alcohol consumption habit.46 Health-related information included body mass index (BMI) and history of hypertension. BMI was calculated as height (m) divided by weight (kg) squared. The Cronbach’s α coefficient was 0.91, indicating good credibility for this questionnaire. All questionnaires distributed in this study were collected, indicating good acceptability.
Periodontal examination and diagnosis of periodontitis
The periodontal examination was performed by two trained and calibrated dentists using Williams periodontal probes (Hu-Friedy, Chicago, IL, USA). The clinical examination for supragingival dental plaque was conducted using the Silness and Löe plaque indices. The periodontal probing pocket depth (PPD), CAL, and bleeding on probing (BOP) in each tooth, except for the third molars, were examined at six sites. PPD was measured from the gingival margin to the bottom of the gingival sulcus or periodontal pocket. The CAL was determined from the cementoenamel junction to the deepest site of probing. Interrater and intrarater reliability were assessed in a random group of 20 patients with periodontitis. The kappa coefficient of the interrater agreement for PPD was 0.86, and that for CAL was 0.88. For intrarater agreement, the same patient was examined twice by one examiner at an interval of 1 week. Periodontitis was defined as an interdental CAL detectable in ≥ 2 nonadjacent teeth or a buccal or oral CAL ≥ 3 mm with a PPD ≥ 3 mm in ≥ 2 teeth.
Diagnosis of IR
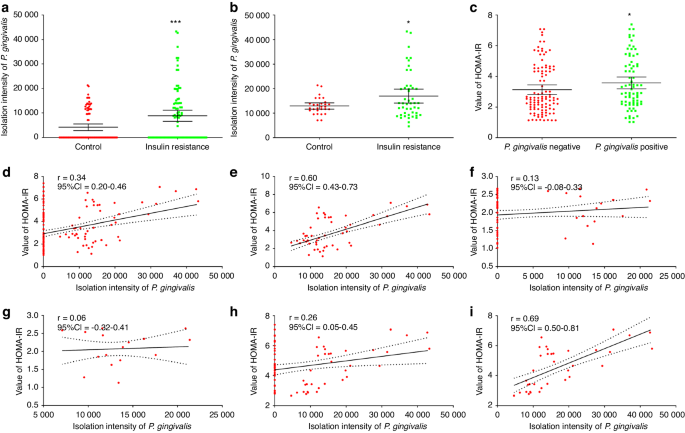
After fasting for at least 12 h, 5 ml of venous blood was collected from each participant. Via centrifugation at 3 000 × g for 15 min, the serum was separated. Fasting glucose was measured by an automatic biochemical analyser (Beckman AU5800, Indianapolis, Indiana, USA). The insulin concentration was tested using a chemical immunoluminescence kit (Elecsys Insulin, Roche Diagnostics GmbH, Mannheim, Germany). The HOMA-IR score was calculated as follows: fasting glucose (mmol/L) * fasting insulin (µU/mL)/22.5. In this study, the cut-off HOMA-IR score to diagnose IR was selected as 2.69.24
End-point PCR
After fasting overnight, saliva not produced due to irritation was collected into a polypropylene tube. After centrifugation at 800 × g at room temperature for 10 min, 500 μL of supernatant was collected and immediately freeze-dried. Salivary DNA was extracted with a DNA extraction kit (DNA-EZ Reagents V All-DNA-Fast-Out, Ziker Biological Technology, Shenzhen, Guangdong, China). Briefly, 2 μL of saliva or 2 mg of tissue sample was added to 50 μL of reagent. After heating at 80 °C for 5 min, the lysate was taken for subsequent PCR analysis. DNA concentrations were determined using a NanoDrop 2000 (Thermo Fisher Scientific, Waltham, Massachusetts, USA).
The reverse transcription PCR system was 25 μL, containing 0.5 μL of DNA template (the DNA concentration was 20–50 µg/μL), 2.5 μL of 10× buffer, 1 μL of dNTPs (Sangon Biotechnology, Shanghai, China), 0.2 μL of DNA polymerase (Fermentas, Burlington, Ontario, Canada), 0.5 μL of forward and reverse primers (10 mol/L for each), and distilled water. A PCR thermocycler (Applied Biosystems, Carlsbad, California, USA) was used for the reaction. The reaction processes were as follows: predenaturation at 94 °C for 2 min; 35 cycles at 94 °C for 30 s, 55 °C for 30 s, and 72 °C for 30 s; an extension reaction at 72 °C for 10 min; and termination at 4 °C. Ten microlitres of amplification product was subjected to 1% agarose (BBI Life Sciences, Shanghai, China) gel electrophoresis. After being stained with ethidium bromide, the DNA was observed with a 300 nm ultraviolet transilluminator. Photoshop (version 2021, Adobe Systems, San Jose, California, USA) was used for semiquantitative analysis of the PCR products.
The blank control was a DNA template-free reaction system. The negative control contained DNA extracted from Helicobacter pylori, and the positive control contained DNA extracted from the P. gingivalis W83 strain. The forward primer used for P. gingivalis 16S rRNA was TGTAGATGACTGATGGTGAAAACC, while the reverse primer used was ACGTCATCCCCACCTTCCTC. The forward primer for the hmuY gene of P. gingivalis was ACCATAAACACACGGAATAATCG, while the reverse primer was GATATTGCCGGATACGATGG.
Cell culture
Normal human liver (LO2) cells were purchased from the American Type Culture Collection (ATCC, Rockville, Maryland, USA). The LO2 cells were cultured in Dulbecco’s modified Eagle’s medium (DMEM) containing 10% foetal bovine serum, 100 U/mL penicillin, and 100 µg/mL streptomycin (Gibco, Carlsbad, California, USA) in a humid environment containing 5% CO2 and 95% air at 37 °C.
Human skeletal muscle cells and adipose tissue-derived cells were donated by Xi’an Tank Medicinal Biology Institute. Myocytes were cultured in low-glucose (1 g/L) DMEM containing 8% foetal bovine serum, 0.4 µg/mL dexamethasone (Sigma, Saint Louis, Missouri, USA), 10 ng/mL epidermal growth factor (Abcam, Cambridge, Cambridge, UK), 50 µg/mL foetal globulin (Sigma), 0.1% gentamicin (Gibco) and 0.1% amphotericin B (Gibco). Adipocytes were cultured in a specific culture medium (Cyagen, Santa Clara, California, US). All culture media were changed every 2-3 d.
Growth of P. gingivalis
Culture of P. gingivalis was carried out according to previous studies.19 In brief, the W83 wild-type strain of P. gingivalis (ATCC) and the W83 strain-derived strains ΔKgp P. gingivalis and ΔRgp P. gingivalis (kindly provided by Prof. Yuan Gao from the College of Pharmacy, Fourth Military Medical University) were grown in brain–heart infusion fluid (Sigma) supplemented with 1 µg/mL vitamin K, 5 µg/mL sanguinin and 5% fibrin-free sheep blood in an anaerobic chamber at 37 °C. The growth environment contained 80% N2, 10% H2, and 10% CO2. The bacterial concentration was measured by a spectrophotometer at a wavelength of 600 nm.
Glucose uptake assay
Cells were seeded into six-well plates and cultured with glucose-free DMEM. After 2 h of culture, the cells in the experimental group were cocultured with P. gingivalis at a MOI of 100 for 4 h. Afterwards, 100 nmol/L insulin (Yeasen, Shanghai, China) was added, and the cells were incubated for 1 h. To analyse glucose uptake ability, differently treated cells were incubated with 100 μg/ml 2-deoxy-2-[(7-nitro-2,1,3-benzoxadiazol-4-yl) amino]-D-glucose (Abcam) at 37 °C for 1 h. The fluorescence was observed by laser confocal microscopy. The fluorescence excitation wavelength was 485 nm, and the emission wavelength was 535 nm. Five different visual fields in each group were randomly selected. Integrated optical density measurements were obtained using Image-Pro Plus 6.0 software (Azure Biosystems, Dublin, CA, USA).
Animals
Specific pathogen-free male C57BL/6 mice aged 6–8 weeks were purchased (Guoruiyinuo Co., Ltd., Xi’an, Shaanxi, China) for P. gingivalis oral feeding experiments. The mice weighed 20–25 g and were housed in independent ventilated cages with unrestricted access to a standard laboratory diet and drinking water. The mice were kept under a 12-hour light/dark cycle at a room temperature of (22 ± 2) °C and a relative humidity of (60 ± 5) %. The mice in the control and experimental groups were raised separately. All animal experiments were reviewed and approved by the Ethics Review Committee of Shenzhen Stomatological Hospital (Pingshan) of Southern Medical University (2022-407).
The results of preliminary mouse experiments (10 mice in each group) suggested that the fasting blood glucose level of the control group was (5.46 ± 0.57) mmol/L, while that of the group in which the mice were orally infected with P. gingivalis was (6.36 ± 0.75) mmol/L. Based on 90% power (β = 0.1) and a 5% significance level (α = 0.05) to detect differences between groups, PASS 2021 software was used to calculate the minimal number of mice needed. The results indicated that at least 6 mice were needed in each group (or at each time point).
P. gingivalis oral infection
P. gingivalis oral infection experiments on mice were carried out as described in previous studies.36 Before the experiment, mice were given an intramuscular injection of 20 mg/kg ampicillin (Solarbio, Beijing, China) every day for 3 consecutive days. Before constructing the animal model, the mice were intraperitoneally injected with 25 mg/kg pentobarbital sodium (BioChemPartner, Shanghai, China). Afterwards, 5-0 silk threads (Johnson & Johnson, New Brunswick, New Jersey, USA) were tied around the maxillary second molars on both sides under the gingiva for mice in the control group and the experimental group. The mice in the experimental group were given 100 μL (1 × 10¹⁰/mL) of P. gingivalis W83 solution on the buccal sides of the maxilla every other day. The bacterial solution was phosphate-buffered saline (PBS, Servicebio, Wuhan, Hubei, China) containing 2% sodium hydroxymethyl cellulose (Coolaber, Beijing, China). The mice in the control group were given only PBS without P. gingivalis. After 12 w, IR-related indicators were measured. Finally, the mice were sacrificed, and the liver, lower limb gastrocnemius muscle and inguinal adipose tissues were taken for follow-up studies.
Biochemical testing of mice
The cleaned tails of the mice were immersed in 50 °C water for 3 min. Afterwards, the tail tip was cut off (1 mm), and blood was taken for glucose and insulin testing. After the whole blood had been allowed to coagulate, the supernatant was extracted. Twenty microlitres of serum per sample was required based on the blood glucose testing kit (Mlbio, Shanghai, China). After completing the sample preparation, the absorbance value was read using a microplate reader at a wavelength of 505 nm. The minimum detection limit for blood glucose was 1 nmol/mL. Blood insulin was tested using a double antibody sandwich method with an ELISA kit (Mlbio). Each sample required 10 μL of serum. Finally, the absorbance value was read at a wavelength of 405 nm. The minimum detection limit for blood insulin was 0.1 mU/L. The Bennett ISI was calculated as follows: 1/[log fasting blood glucose (mmol/L) * log fasting blood insulin (mU/L)].
ITT
Mice were fasted overnight and intraperitoneally injected with 0.75 U/kg insulin the next morning. Before 15, 30, 45, 60, 75, 90, 105, and 120 min after injection, tail vein blood was taken to measure glucose levels. Blood glucose change curves were drawn.
Hyperinsulinaemic–euglycaemic clamp experiment
After intraperitoneal injection of pentobarbital sodium (25 mg/kg), the right external jugular veins of mice were cannulated. After 1 week of recovery, the hyperinsulinaemic–euglycaemic clamp experiment began. After fasting overnight, 60 mU/kg insulin was administered, after which insulin was infused at a rate of 2.5 mU/kg/min. Blood glucose levels were measured every 10 min. In the meantime, 20% glucose was infused, during which the infusion rate was continuously adjusted to restore blood glucose to the baseline level. The GIR was recorded as blood glucose was in steady-state.
Western blot analysis
Cells and tissues were obtained and placed on ice in radioimmunoprecipitation assay lysis buffer containing protease inhibitors (Boster, Shanghai, China). A protein quantitative kit (Boster) was used to quantify the total protein concentrations. Fifty micrograms of protein from each sample were subjected to 10% sodium dodecyl sulfate‒polyacrylamide gel electrophoresis and transferred to a polyvinylidene fluoride membrane (Millipore, Billerica, Massachusetts, USA) for 60 min at 100 V. Five percent nonfat milk was used to block the membrane for 1 h, and then the membrane was incubated with anti-INSR (rabbit anti-human, 1:1 000, Affinity Biosciences, Liyang, Jiangsu, China), anti-INSR-α subunit (rabbit anti-human, 1:1 000, Abcam) and anti-GAPDH (rabbit anti-human, 1:2 000, Servicebio) primary antibodies overnight at 4 °C. After washing, the membrane was incubated at room temperature with a sheep anti-rabbit secondary antibody (1:50 000, Abbkine, Wuhan, Hubei, China) conjugated with horseradish peroxidase for 2 h. An enhanced chemiluminescence kit (Thermo Fisher Scientific) was used to observe the bands.
Haematoxylin–eosin (HE) staining
Tissues and cells were fixed with 4% paraformaldehyde for 1 h and then dehydrated with gradient concentrations (70%–100%) of alcohol. Paraffin sections were dewaxed with xylene for 30 min twice. Cell slides and tissue paraffin sections were treated with haematoxylin solution (Servicebio) for 1 min. After the samples were washed with running water, eosin solution (Servicebio) was used for staining for 2 min. An inverted microscope (Nikon, Tokyo, Japan) was used to observe the images.
Immunofluorescence staining
After PBS washes and shaking 3 times to remove the suspended P. gingivalis and gingipain, the cell and tissue samples were fixed with 4% paraformaldehyde for 1 h. The cell slides and tissue paraffin sections (5 µm) were dewaxed and hydrated according to previously described processes in HE staining. Afterwards, 3% bovine serum albumin (Servicebio) was used to block slides for 30 min, and then the slides were incubated with primary antibodies at 4 °C overnight. The primary antibodies used were as follows: rabbit anti-human INSR (1:250, Affinity Biosciences) and mouse anti-human gingipain (5 µg/ml, Developmental Studies Hybrid Bank, Zurich, Swiss). Afterwards, the slides were incubated with the secondary antibodies in the dark for 50 min. The secondary antibodies were as follows: CY3-labelled goat anti-rabbit IgG (1:300, Servicebio) and Alexa Fluor 488-labelled goat anti-mouse IgG (1:400, Servicebio). Finally, the slides were stained with 1 µg/ml DAPI for 10 min. The fluorescence signals were observed by laser confocal microscopy (Leica, Wetzlar, Hessian, Germany). Nuclei in the DAPI channel were blue, positive signals in the Alexa Fluor 488 channel were green, and positive signals in the CY3 channel were red.
Real-time quantitative PCR
Real-time quantitative PCR was carried out according to the processes described in previous studies.47 Total RNA (50 ng/μL) was extracted from cells and tissues using TRIzol reagent (Takara, Daliang, Liaoning, China) according to the manufacturer’s instructions. Afterwards, the total RNA was reverse-transcribed into cDNA using a HiScript II Reverse Transcriptase kit (Vazyme, Nanjing, Jiangsu, China). Real-time quantitative PCR was conducted using a SYBR green PCR kit (Takara). GAPDH was used as an internal reference gene to standardize the results. The PCR system was 10 μL, with 0.5 μL of DNA template and 0.5 μL of each primer. The PCR process was as follows: polymerase activation at 50 °C for 2 min; predenaturation at 95 °C for 10 min; and 45 cycles of 95 °C 15 s for denaturation and 60 °C 1 min for primer polymerization and DNA synthesis. The forward primer of INSR was CGCTGAGAATAACCCTGGTC; the reverse primer of INSR was GCTGCCATCTGGATCATTTC; the forward primer of INSR-A was TTTTCGTCCCCAGGCCATC; the reverse primer of INSR-A was GTCACATTCCCAACATCGCC; the forward primer of GAPDH was CAAAATGGTGAAGGTCGGTGTG; and the reverse primer of GAPDH was TGATGTTAGTGGGGTCTCGCTC.
Molecular docking analysis
The protein structures of RgpB (1CRV) and INSR (2HR7) were obtained from the Protein Data Bank. The protein structures of RgpA and Kgp were calculated using the AlphaFold 2 prediction model. Water molecules and heteroatoms were deleted from the structures, and hydrogen atoms were added using the UCSF Chimera visualization system. Finally, Amber99SB charges were allocated, and protonation states were also allocated using the H++3.0 program.48 AutoDock 4.2 software (Olson Laboratory, San Diego, California, USA) was used for molecular docking analysis. Molecular docking was performed in flexible docking mode, with INSR as a receptor and Kgp, RgpA, and RgpB as ligands. INSR was taken as the docking centre, the box size was set to a cube with a side length of 120 Å, and the spacing step size was set to 0.375. The maximum limit for searching conformations was set to 10 000, and the Lamarckian genetic algorithm was used for conformational sampling with 100 conformation outputs per docking. After scoring, the top ten conformations were compared. The open-source software PyMOL (DeLano Scientific LLC, Gilbert, Arizona, USA) and Maestro Academic Edition (Schrödinger LLC, New York, New York, USA) were used for protein interaction analysis.
LC–MS/MS analysis
Two micrograms of INSR α subunit (MedChemExpress, Shanghai, China) were incubated with 10 nM gingipain (Kgp or RgpA/B, Creative Enzymes, Shirley, NY, USA) at 37 °C for 30 min. Then, 1D Nano LC-MS/MS (Thermo Fisher Scientific, LC: U3000, MS: Q Exactive) analysis was performed. The sample was washed twice with 0.1% formic acid (Thermo Fisher Scientific), and 70% acetonitrile (Merck, Darmstadt, Hessian, Germany) was added. Then, the sample was centrifuged, vacuum-dried into a powder state, and dissolved with 2% acetonitrile/0.1% formic acid. The peptides were separated over 70 min at 600 nL/min. The MS settings were as follows: mass/charge ratio range, 350 to 1500; resolution for MS1 scan, 70 000 full width at half maximum; resolution for MS2 scan, 17 500 full width at half maximum; isolation window, 2.0 m/z; nce, 27; underfill ratio, 1%; dynamic exclusion, 20 s. Thermo Proteome Discoverer version 2.3 (Thermo Fisher Scientific) was used to process the raw data, and the UniProt database was used to analyse the results. The false discovery rate was < 0.1% at the peptide level.
Modified ELISA
The INSR α subunit (0.1 mg/mL) was dissolved in pH 7.4 PBS (Thermo Fisher Scientific). Then, 100 μL of INSR protein was added to each well in high-binding ELISA plates (Costar, New York, New York, USA) for 1 h of incubation. Afterwards, the plates were cleaned 3 times with 0.1% Tween 20 (Sigma). Then, 200 μL of 2% polyvinyl alcohol was dissolved in PBS and added to each well, and the plates were incubated for 1 h. After 3 washes, 0.83 µg of insulin connected with horseradish peroxidase (Qiyuebio, Xi’an, Shaanxi, China) was dissolved in 1.0 ml of PBS, and serial dilutions were added to each well. The plates were incubated for 1 h. Finally, 100 μL of stock ABTS (2, 20-azino-bis [3-ethylbenzothiazoline-6-sulfonic acid]) (Millipore, Burlington, MA, USA) was added to each well, and the plates were incubated for 30 min. The plates were then read on a SpectraMax Plus scanning microplate spectrophotometer at 405 nm. The control well in each plate was not coated with INSR, and its reading was subtracted from the absorbance value of the experimental wells as the value for nonspecific binding. Each group had at least 3 wells, and binding curves were drawn based on the absorbance value.
Statistical analysis
The data were analysed using SPSS version 24.0 (IBM, Armonk, New York, USA). The Kolmogorov-Smirnov test was performed to determine whether the data were normally distributed. Continuous variables with a normal distribution are presented as the mean ± standard deviation. Two groups of data were compared using Student’s t-test, while data from three or more groups were analysed using one-way analysis of variance and Dunnett’s multiple comparison test. The categorical variables are presented as frequencies and percentages, and the chi-squared test or Fisher’s exact test was used to analyse the differences among groups. When multiple logistic regression was used to determine the association between risk factors and IR, other factors that might affect the occurrence of IR were controlled for as confounding factors. To prevent the exclusion of possible confounding factors, P < 0.1 was considered to indicate statistical significance when screening for factors that might affect the development of IR. The correlation between the HOMA-IR score and the amount of isolated salivary P. gingivalis was evaluated using Pearson’s correlation coefficient, and a 95% confidence interval of the correlation coefficient was calculated. All statistical analyses were two-tailed, with a P value less than 0.05 being considered to indicate statistical significance.


留言 (0)