
記住我
The study population consisted of patients with acute ischemic stroke and was drawn from the Norfolk and Norwich Stroke and TIA register (NNSTR) – a prospectively collected UK regional stroke register in the East Anglia region. The register includes all stroke admissions to the Norfolk and Norwich University Hospital, which is a tertiary referral center in England with a catchment population of approximately 900,000 (2017) [15]. The details of data collection methods have been previously reported [16]. The register received ethical approval from the Newcastle and Tyneside National Health Service (NHS) and Research Ethics Committee (17/NE/0277) as a research database and therefore did not require individual patient consent. The study protocol was approved by the Steering Committee of the Register.
Patients admitted with AIS between January 2003 and December 2016 were included in the study population. For all participants, AIS was diagnosed based on patient history, examination, and computerized tomography/magnetic resonance imaging results. Follow-up data were collected in June 2017 and the maximum follow-up was 14.4 years. Due to record linkage with the NHS system in the UK, the database has ascertainment of comorbidities and almost complete follow-up with only 0.90% (78 of 8692 patients) of the sample being lost to follow-up for the post-discharge mortality and recurrence analysis.
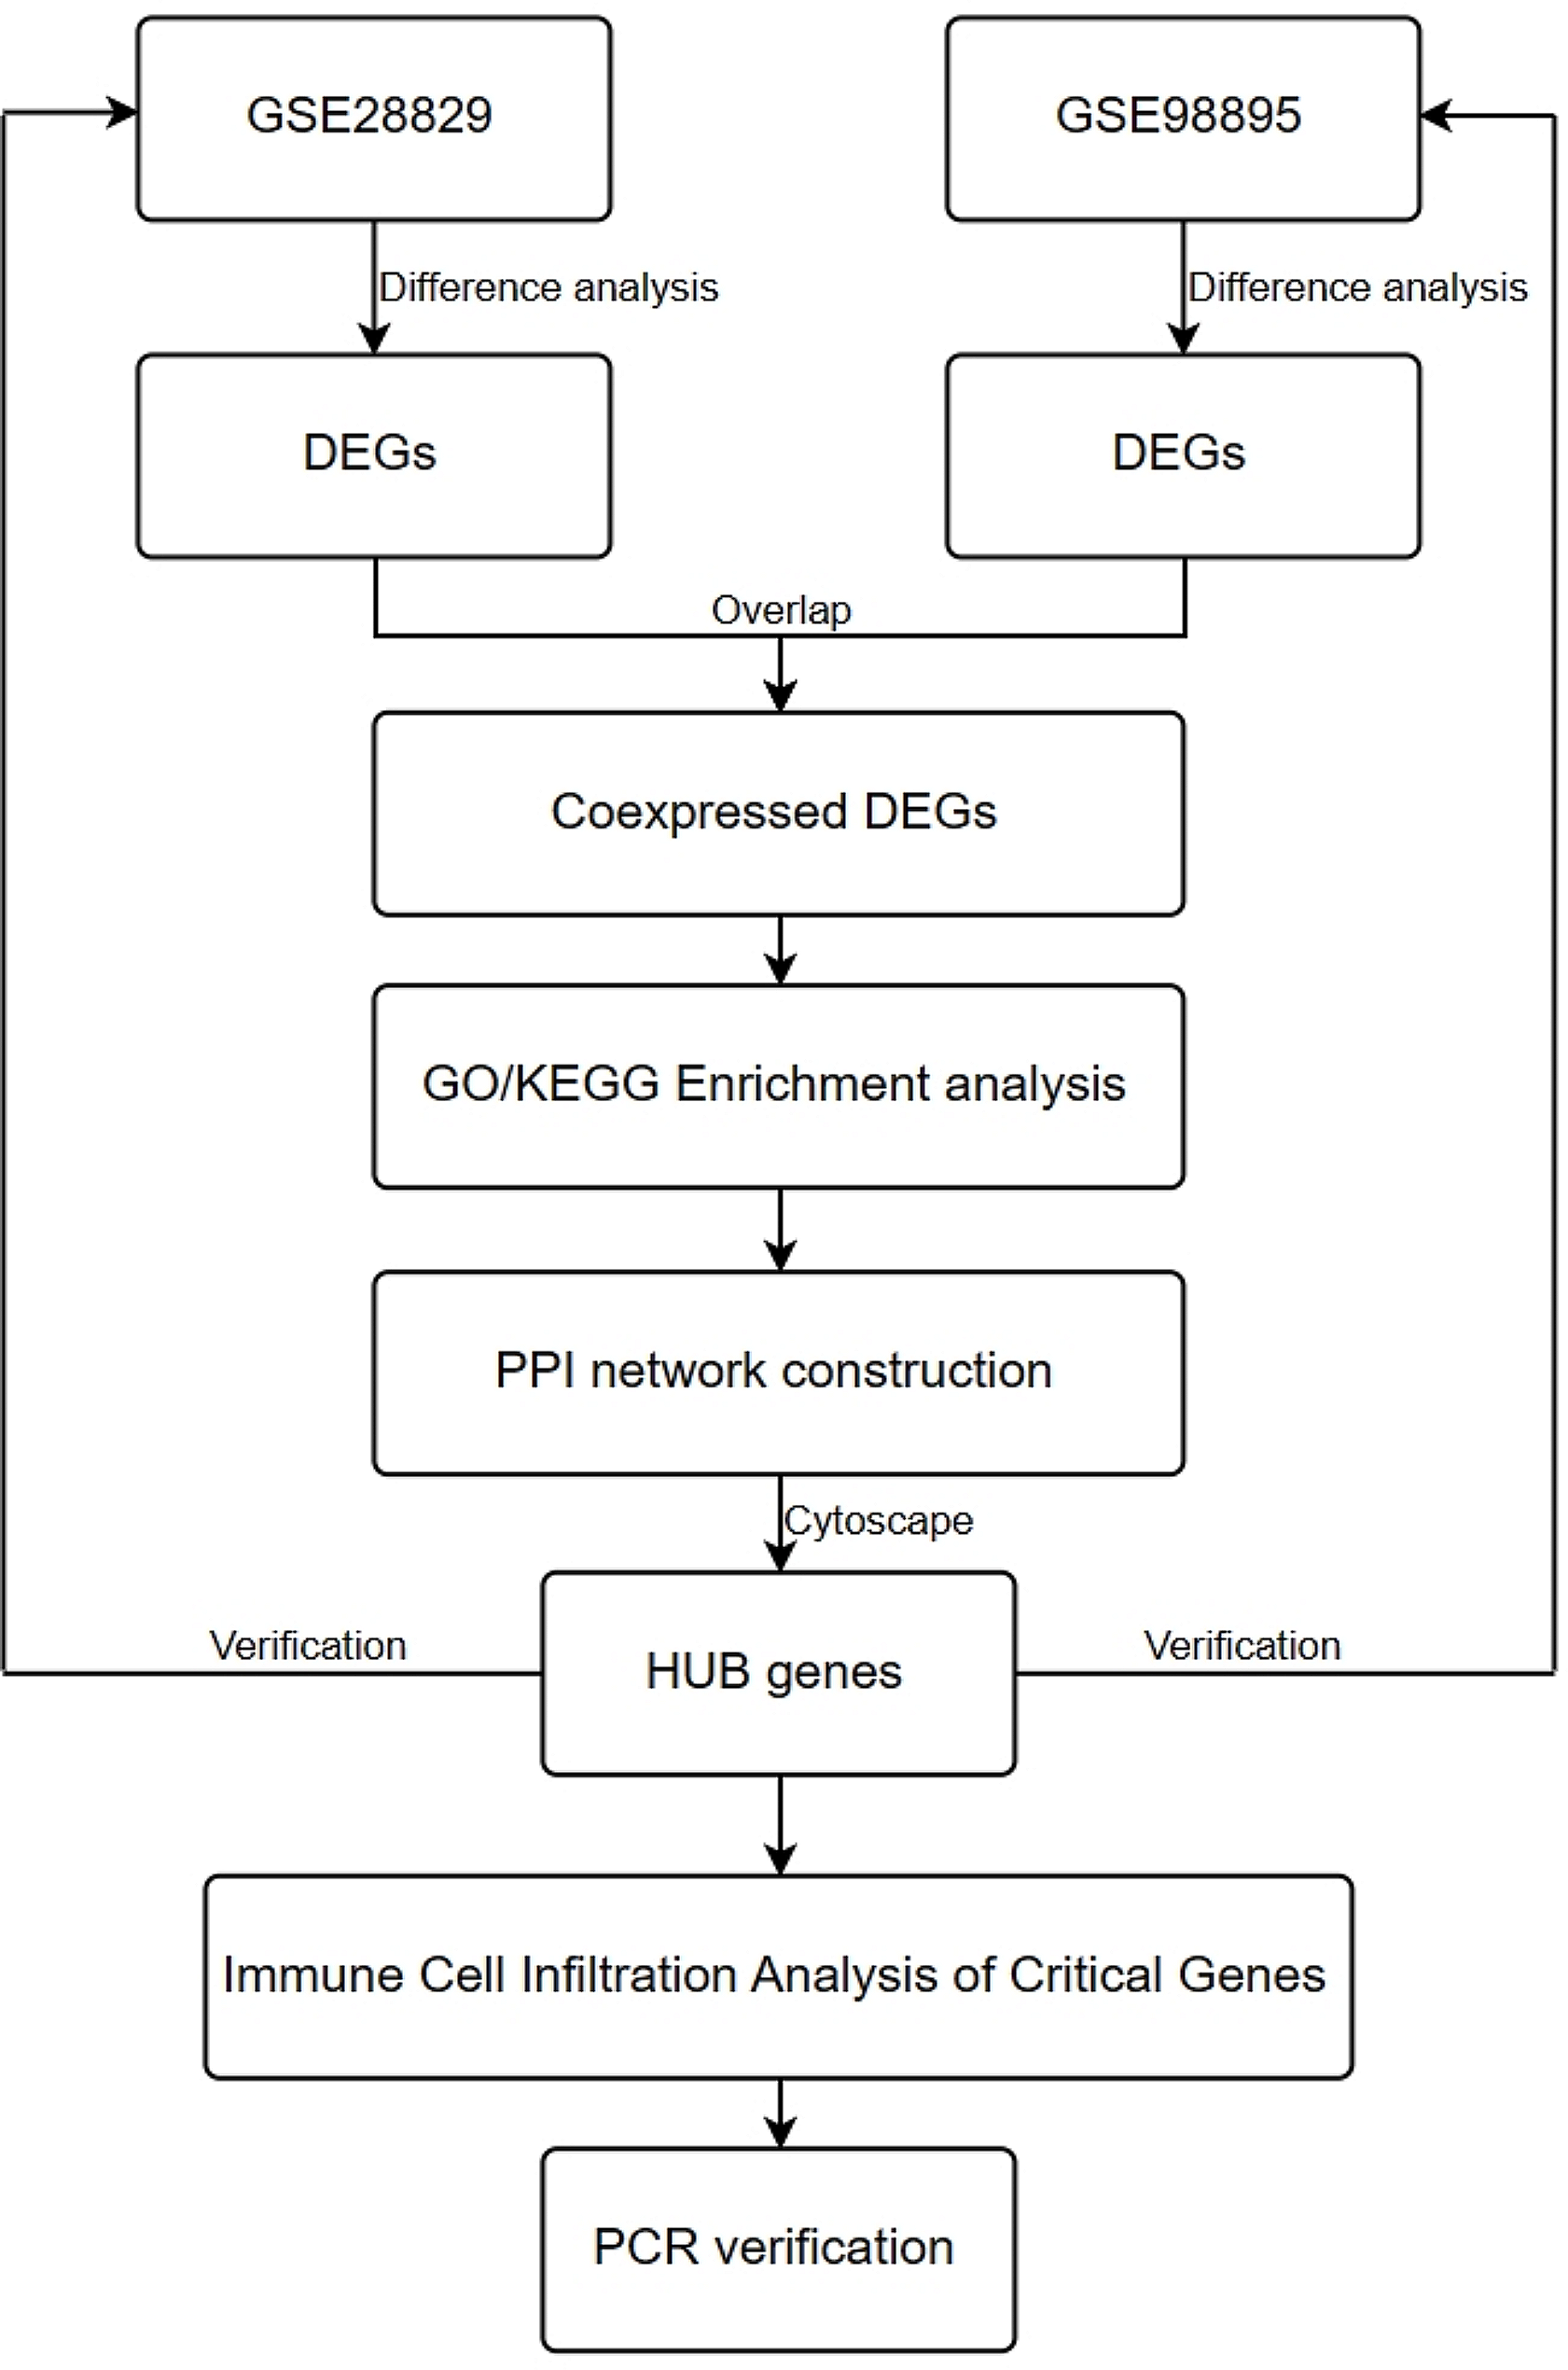
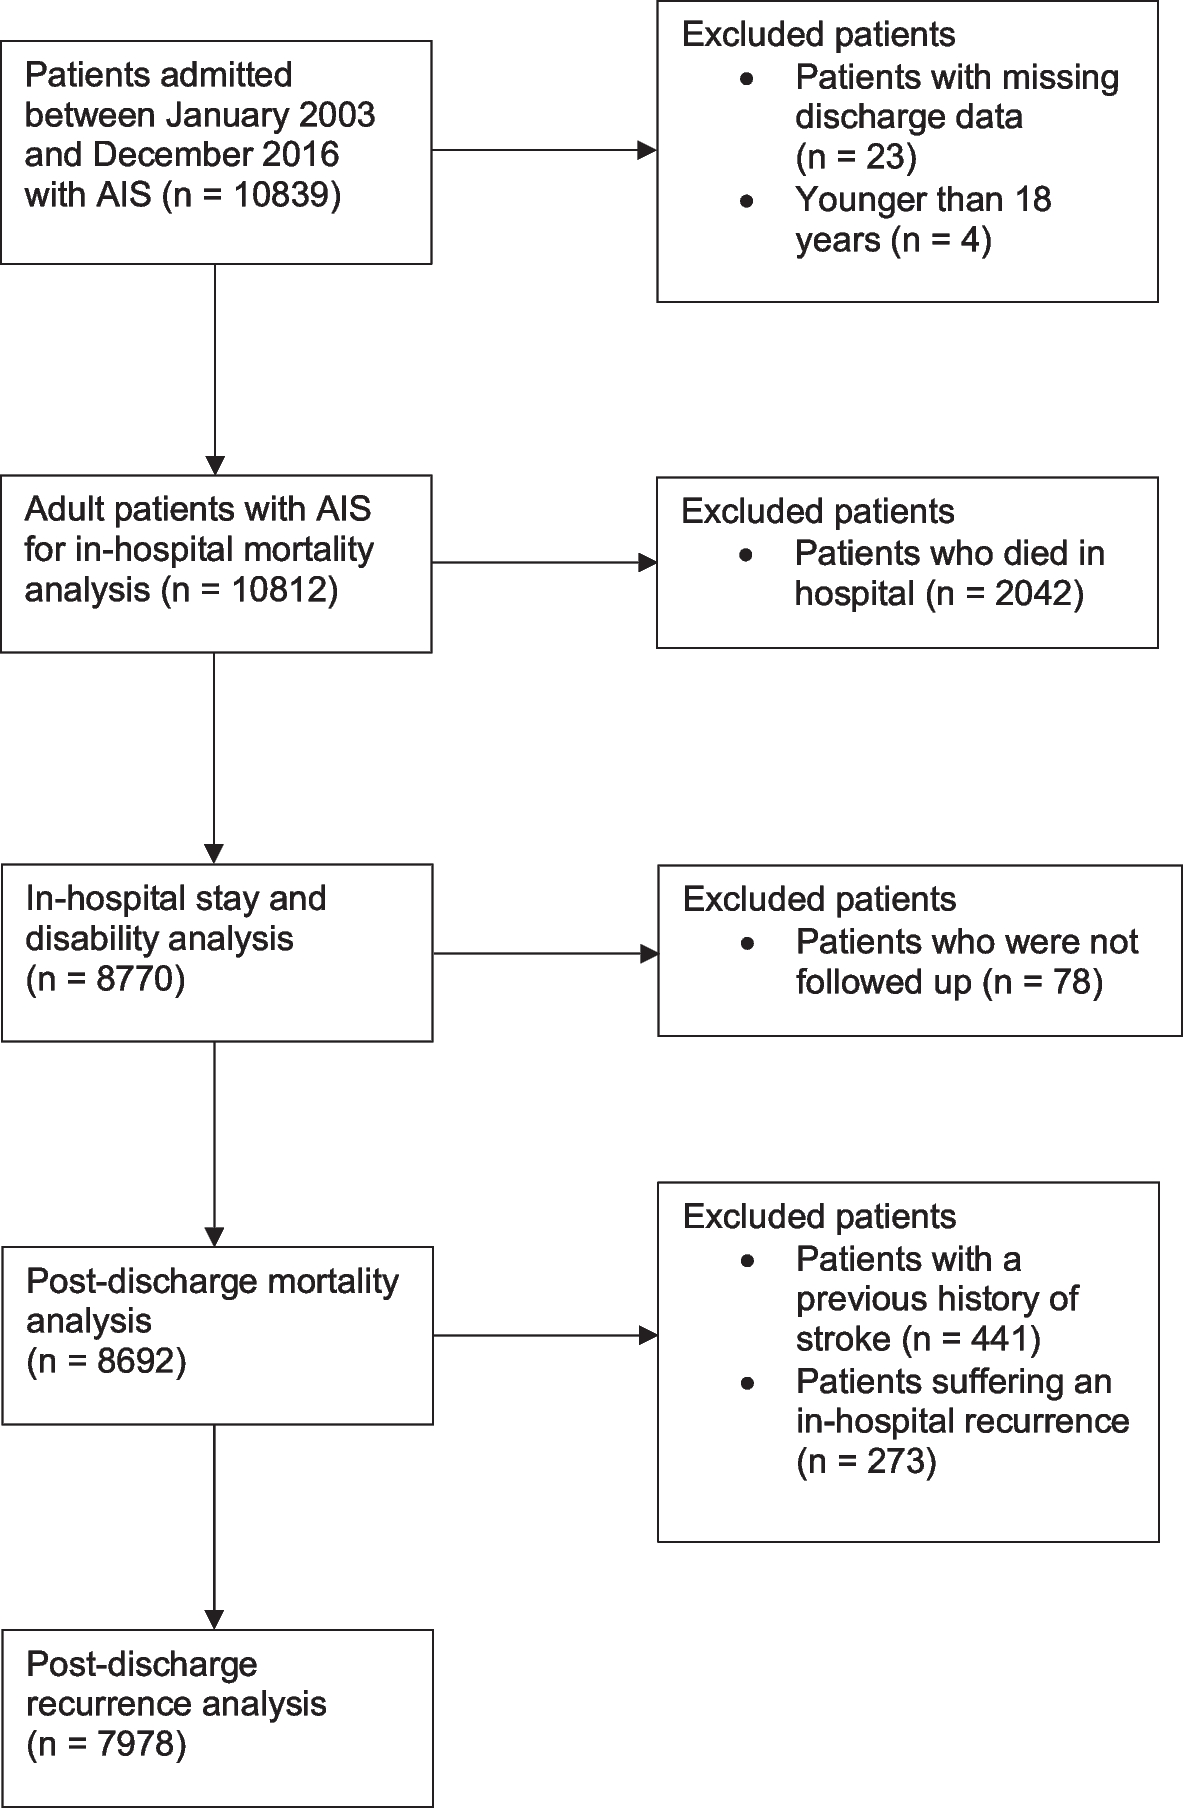
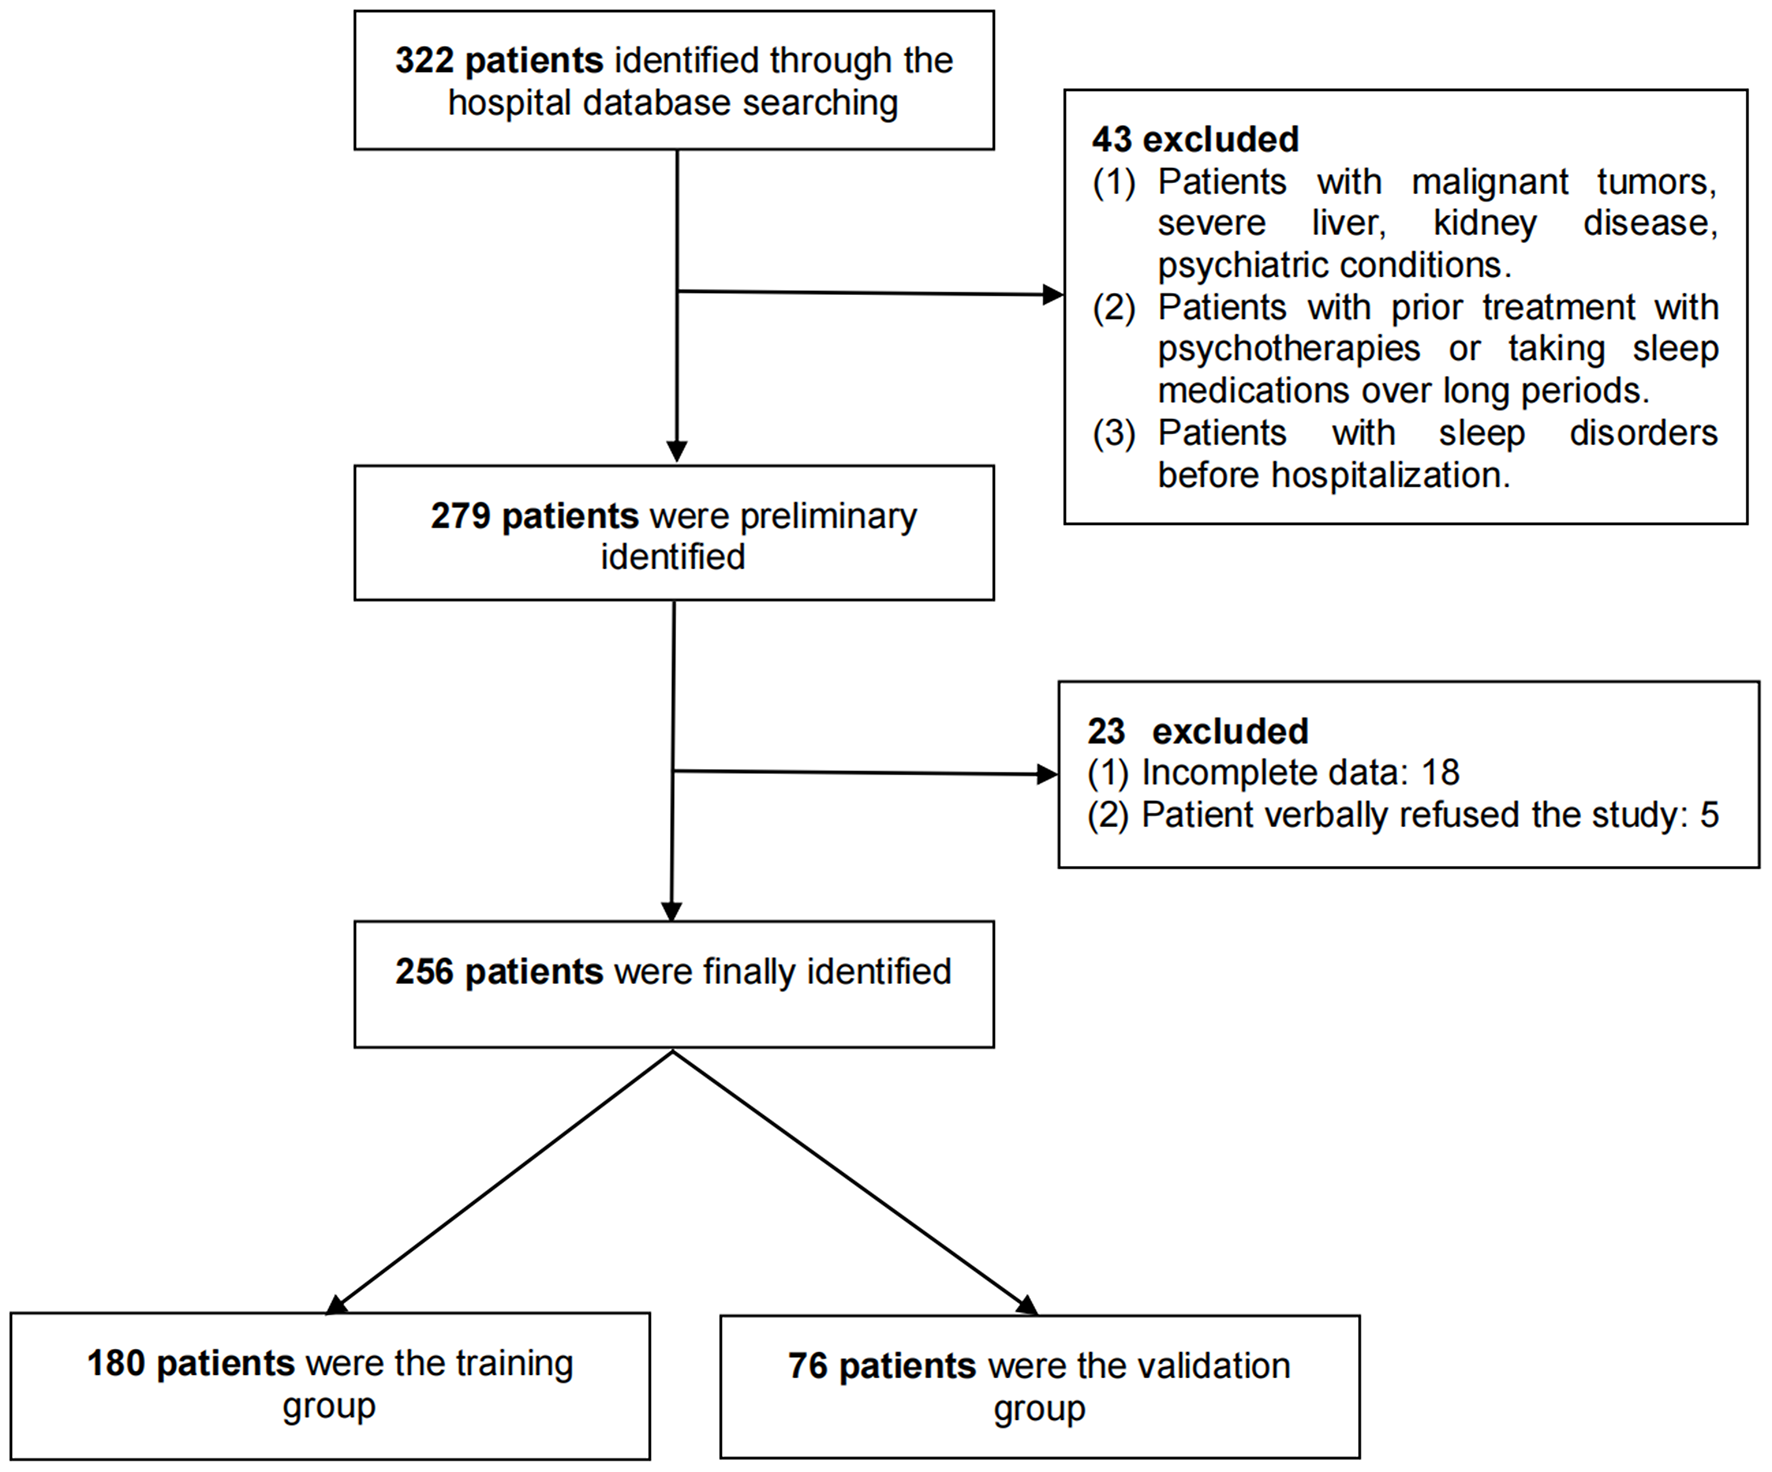
The exclusion criteria, outcomes of interests (in-hospital mortality, LoS, excess disability, post-discharge mortality, and stroke recurrence), and covariates were all agreed upon a priori. The exclusion criteria were applied sequentially for the various stages of the analysis, according to the outcomes assessed at each stage (Fig. 1). An initial population of 10,839 patients were extracted from the database. After excluding patients with missing discharge data (n = 23) and patients younger than 18 (n = 4), a population of 10,812 adult patients were eligible to be included.
Fig. 1
Patient population flowchart showing selection criteria for each stage of analysis
Exposure groupsThe exposure groups (pre-existing dementia and diabetes), diagnosed by the clinical teams at the tertiary center, were identified from the NNSTR using the 10th Revision of the International Classification of Disease (ICD-10) codes. Dementia included Alzheimer’s disease (F00), vascular dementia (F01), dementia in other diseases classified elsewhere (F02), unspecified dementia (F03), and delirium due to psychological condition (F05). Delirium due to psychological condition (F05) is included as part of the dementia subgroups due to coding system used in the registry, which grouped F05 with F02 and F03 under ‘other types of dementia’. As for diabetes, Type 1 (E10), Type 2 (E11), malnutrition-related (E12), other specified (E13), and unspecified diabetes mellitus (E14) were included. Our database, which had electronic record linkage with primary care comorbidity data, extracted any diagnoses of dementia and diabetes before, during, and after stroke admission. Our study defined pre-existing dementia and diabetes as conditions diagnosed before stroke admission or during the hospital stay. Patients were then split into four mutually exclusive categories: neither pre-existing dementia nor diabetes, pre-existing diabetes but not dementia, pre-existing dementia but not diabetes, and both pre-existing dementia and diabetes.
Confounder selectionPotential confounders were selected based on existing literature [1, 17,18,19,20]. Our analyses included age, sex, Oxfordshire Community Stroke Project classification (OCSP), pre-stroke modified Rankin scale (mRS), comorbidities, antithrombotic medications, and relevant biochemical and hematological measurements on admission (random plasma glucose, creatinine, sodium, hemoglobin, white cell count, and platelets) as the variables. Biochemical and hematological measurements were collected by electronic record linkage. Comorbidities that were included in the analyses (pneumonia, asthma, COPD, history of transient ischemic attack [TIA], hemorrhagic or other types of stroke, myocardial infarction, hyperlipidemia, peripheral vascular disease, heart failure, atrial fibrillation, hypertension, cancers, chronic kidney disease, and liver disease) were identified using ICD-10 codes. The codes can be found in Additional file 1. Any diagnosis of the comorbidities occurring before, during, and after AIS admission were extracted from our database.
Study outcomesData for the five outcomes of interest were extracted from the NNSTR. Following exclusion of patients with missing discharge data and patients < 18 years, a total of 10,812 patients were included in the in-hospital mortality analysis. 2,042 patients who died in hospital were then excluded and the remaining 8,770 patients were included in the analyses of the other short-term outcomes (LoS and excess disability). Binomial logistic regressions were performed to assess in-hospital mortality and LoS longer than the median among the four exposure groups. Both models included age, sex, OCSP, comorbidities, admission antithrombotic medications, and admission biochemical measures as covariates. A multinomial logistic regression was used to compare excess disability between the four groups. The difference between the mRS measures (\(\Delta\) mRS) at admission and at discharge was calculated. The resulting values were then split into tertiles, which were used as the outcome for the multinomial logistic regression. Alongside the specified confounders in the previous two models, the pre-stroke mRS was also included in the model assessing excess disability.
After excluding patients who were not followed up, the recorded dates of death from the database were used to analyse 8,692 patients for post-discharge mortality. 714 more patients were excluded for the post-discharge stroke recurrence outcome due to previous history of stroke and stroke recurrence during hospital stay. This led to 7,978 patients being analysed for long-term recurrence, using information on readmission with AIS. The two post-discharge outcomes were assessed using Cox regression models. Cause specific hazard ratios were determined for the recurrence outcome given the competing risk of death. The full exclusion criteria applied at each stage is detailed in Fig. 1.
Where possible, for each model of the study outcomes, an additional interaction test was carried out. Pre-existing diabetes and pre-existing dementia were included as interaction terms to explore any interactive effects on the short-term and the long-term mortality outcomes. An interaction analysis was not carried out for the post-discharge recurrence outcome due to small numbers in the subgroups.
Statistical analysisThe software Stata 14.1 (StataCorp 2015, Statistical Software; Release 14, College Station, TX: StataCorp LP) was used to perform statistical analysis. Pearson’s Chi-Square test was used to compare the categorical variables between the exposure groups. One-way ANOVA and Kruskal–Wallis tests were used to compare normally distributed and non-normally distributed numerical variables, respectively.
Missing dataThe following key variables contained missing data: OCSP, pre-stroke mRS, post-stroke mRS, random plasma glucose, creatinine, sodium, hemoglobin, white cell count, and platelets at admission. Frequencies of missing data can be found in Additional file 2. After comparing patients with missing data to those without missing data (see tables in Additional file 3), we found that patients with missing data were more likely to have a shorter LoS and a lower comorbidity burden. This suggests that the data were missing-at-random [21]. We performed multiple imputation by chained equations with 20 imputations using predictive mean matching for all the variables. Due to the high percentage of the missing National Institutes of Health Stroke Scale (NIHSS) variable, sensitivity analyses using multiply imputed NIHSS values were performed as separate models for each outcome. The analyses did not show any significant differences between the two models. Therefore, the results presented in the paper are from NIHSS-adjusted models with the exception of interactions tests, which are presented from non-adjusted models.
留言 (0)