
記住我
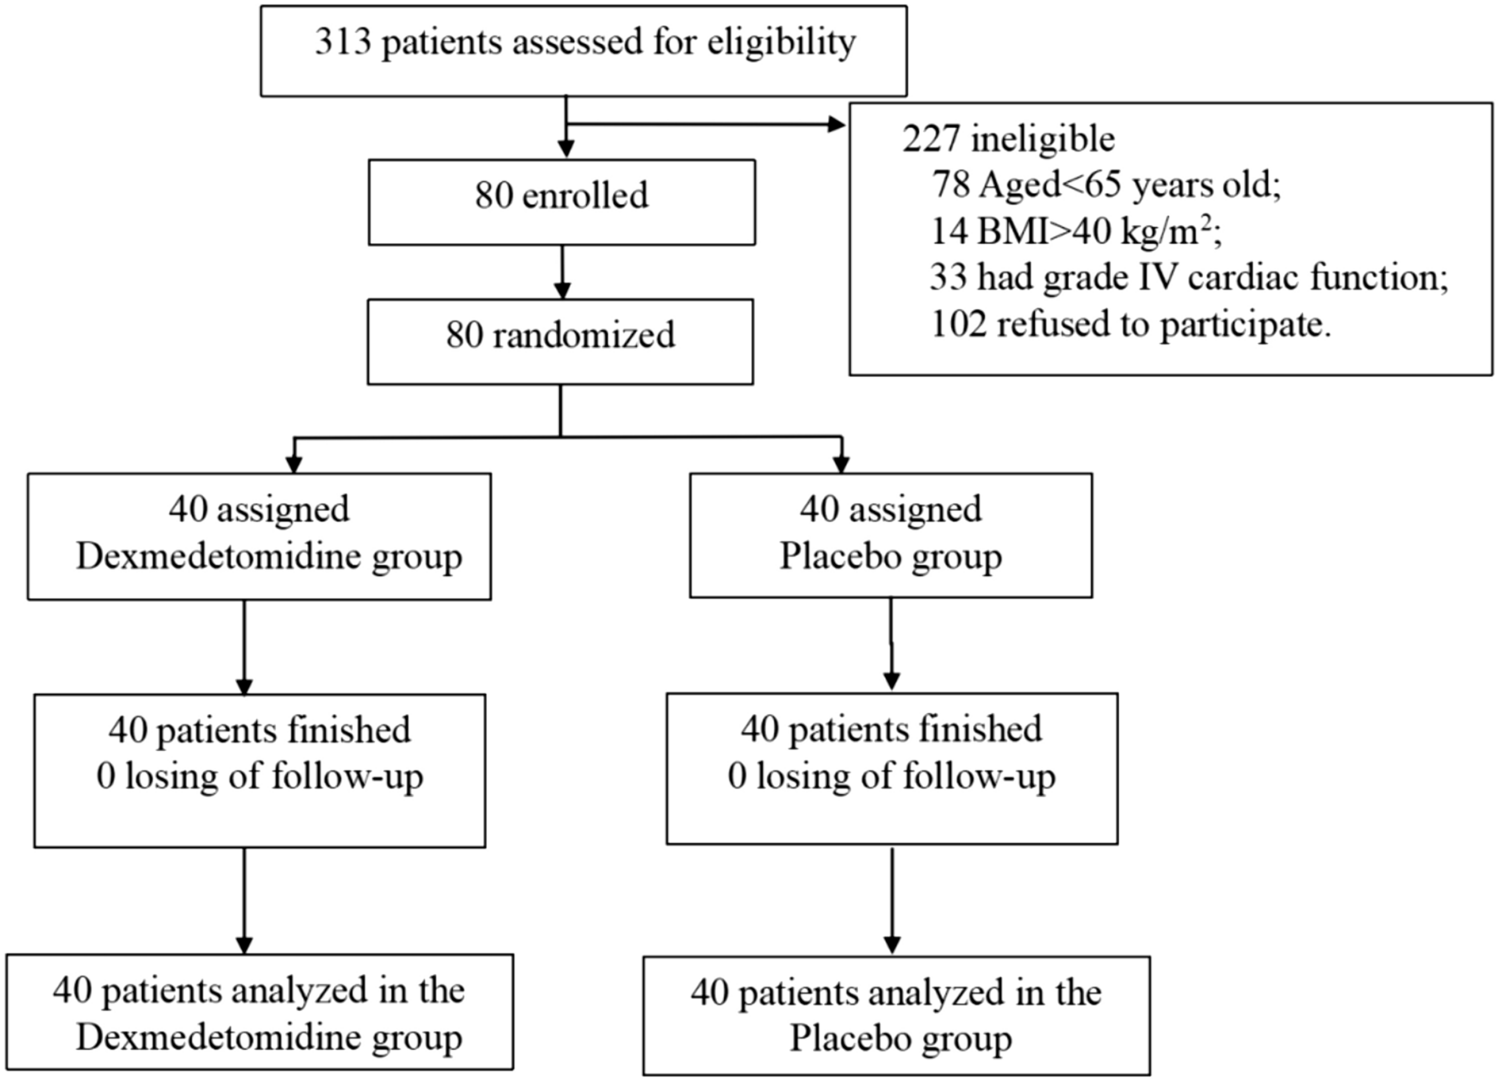
The eligible pool of subjects consisted of 25,128 individuals who downloaded and used Hyfe’s consumer apps at least once between 1st January and 4th August 2023 (Supplementary Figure S1). 213 users monitored for at least 20 h per day on at least 30 days, and of these subjects, 97 users had cough frequencies of at least 5 coughs per hour.
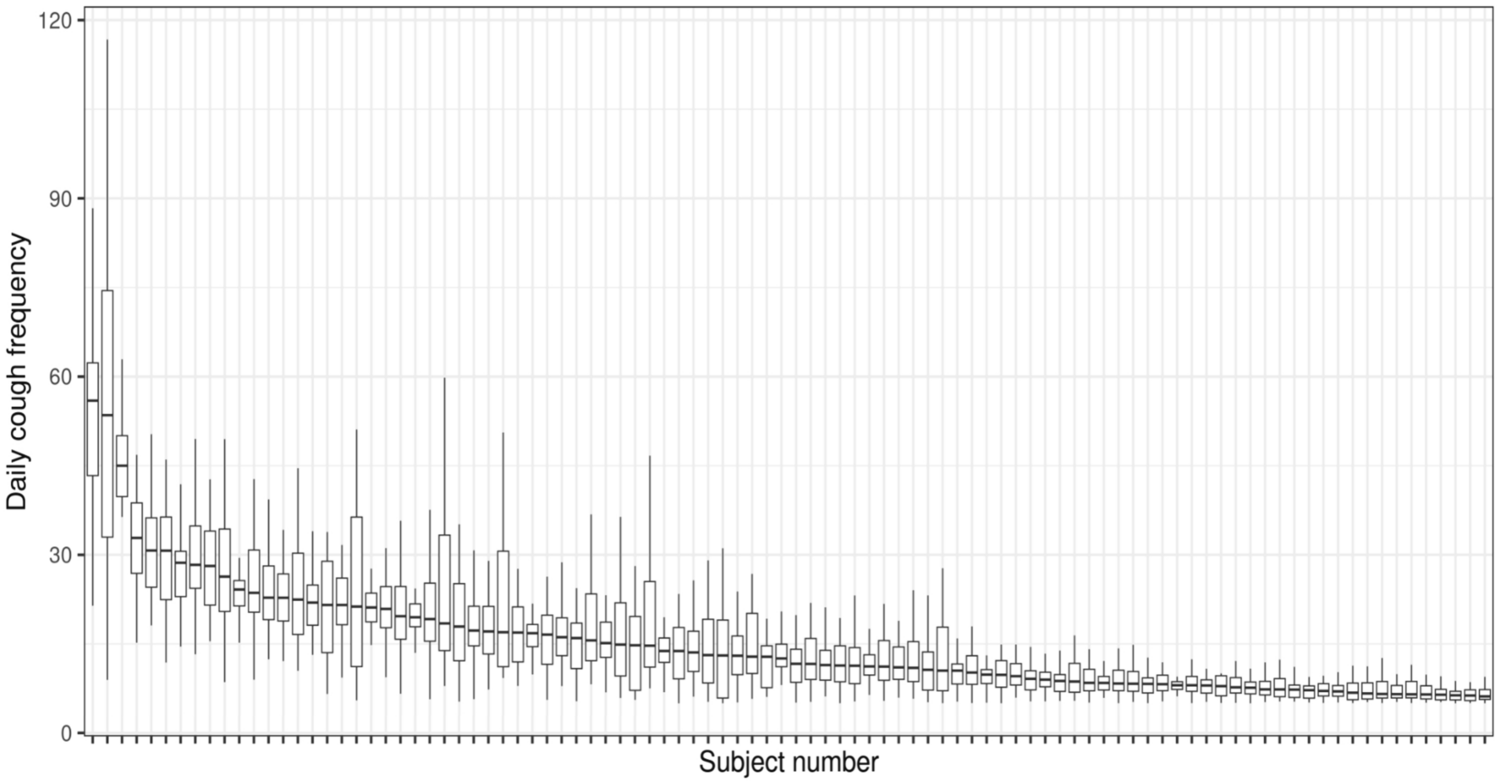
Daily Cough Variability Within and Between SubjectsThe variability in cough within and between subjects can be seen in Figs. 1 and 2, with the median cough frequencies varying from 6.17 to 55.96 coughs per hour. The individual mean cough rates exhibit similar variability, ranging from 6.48 to 54.51 coughs per hour. Subject 80, not shown in Fig. 1, had a median (mean) cough frequency of 160.08 (182.04) coughs per hour.
Fig. 1
Boxplots of the daily cough frequencies over the period of observation of 97 individuals who monitored for at least 30 days and had frequencies of over 5 coughs per hour. Subject 80, an outlier with a median frequency of 160.08 coughs per hour, is not shown. For each subject, the frequency quartiles are shown by the bottom edge (first quartile), midline (median), and top edge (third quartile) of the box; the range is depicted by the vertical lines. Cough rates vary considerably among this cohort, both within and between subjects
Fig. 2
Standard deviations (SD) and means of daily cough frequencies of 97 individuals who monitored for at least 30 days and had frequencies of over 5 coughs per hour. Each point represents one subject; the x-coordinate is the average of that subject’s daily cough frequencies, and the y-coordinate is the SD of that subject’s daily cough frequencies. Panel A shows all 97 individuals (correlation = 0.95; Optimized Least Square (OLS) slope = 0.64), while Panel B shows 96 subjects with the exclusion of Subject 80 (correlation = 0.79; OLS slope = 0.40). Lines of best fit are shown
Figure 1 demonstrates the variability of cough frequencies within individuals, since the vertical span of each boxplot provides the range of cough frequencies for that one subject. Quantitatively, the IQRs for these subjects’ cough frequencies vary from 1.30 to 41.48 coughs per hour, with SDs (shown in Fig. 2) ranging from 0.99 to 28.35 coughs per hour. (Subject 80’s IQR and SD were 206.95 and 123.62, respectively.)
Daily Cough Frequency PredictabilityThe large intra-subject variability has implications for how well any day’s results predict the entire time-period. We detail the calculation for two extreme examples of the 1 day and overall predictability and one subject with a deterioration in coughing (Fig. 3). The cough data from the subject with the most consistent daily cough rates (Number 90) is shown in the top panel of Fig. 3. On the first day of monitoring, the user had a cough frequency of 19.6 coughs per hour and a 95% confidence interval of 13.0 to 27.4, just slightly above their 30-day daily cough frequency average of 19.4 coughs per hour. Based on this first day of data, we would predict this user’s other daily cough frequencies to fall between 13.0 and 27.4 coughs per hour, which was accurate for all 30 days of this user’s observed cough frequencies. Thus, the One Day Predictability of the first day was 100%. However, on day 21, this user had a cough frequency of 13.5 coughs per hour and a 95% confidence interval of 8.4 to 20.4 coughs per hour, an interval that only captured the daily cough frequencies of 18 of the 30 days yielding a one day predictability of 60%. Averaging the 30-one day predictabilities over all 30 days yields an overall predictability of 95%. This subject demonstrates that 24-h cough counts can be predictive when cough rates are stable.
Fig. 3
Daily cough frequencies data are shown as dots with the 30 day average depicted by the dashed line. The 95% confidence interval of cough frequency for each day is represented by the vertical bars. The coverage percentage for each day is shown at the bottom (color coded as yellow for > 80%, darker for between 60 and 80%, darker for between 40 and 60% and red for < 40%). In Panel A, the user’s cough frequency predictability is 95%, in Panel B subject this is 38% and in Panel C, for this subject 30%
In contrast, the middle panel of Fig. 3 shows the cough data for a user with a more variable cough rate (Subject 80). On the first day of monitoring, the user had a cough frequency of 42.0 coughs per hour and a 95% confidence interval of 4.3 to 77.1. Based on this first day of data, we would predict this user’s other daily cough rates to range between 4.3 and 77.1, which was accurate on only 8 of this user’s other daily cough rates, yielding a One Day Predictability of 26.7% percent. Averaging the 30-one day predictabilities for this subject yields an overall cough predictability of only 38%. This case exemplifies the fundamental problem with limited cough monitoring in individuals with volatile cough rates.
Subject number 12 has a cough pattern that suggests a period of stability followed by a deterioration in cough that gradually resolves (bottom panel of Fig. 3). During the first 10 days of monitoring, this user’s daily cough frequency was about 5 coughs per hour, then increased to 31 coughs before gradually returning towards baseline over the subsequent days. On the first day of monitoring, the cough rate was 6.75 coughs per hour. Despite accurately predicting the stable period of the first 10 days, given its poor performance for the remaining 20 days, the One Day Predictability for this day is only 30%. The One Day Predictability on day 13, when an increase in cough frequency occurred, is an abysmal 6.7%, after which the One Day Predictability varies from 13.3% (day 28) to 53.3% (day 11). The overall predictability for this subject is 30.4%. The average 30-day cough frequency of 13.7 coughs per hour is a meaningless summary, as they experienced two very different cough patterns demarcated by day 12. This demonstrates the value of continual cough frequency monitoring in identifying individuals with increases in coughing.
Variability of Daily Cough PredictabilityOverall cough frequency predictability varied markedly among the 97 users (Fig. 4). Figure 5 summarizes the daily coverage results for all users: each row is one individual, each cell is 1 day, and the color of the cell indicates the coverage for that day. The rows are ordered by cough frequency predictability, with user 90 at the top, as the most stable and predictable cougher, and user 12 at the bottom, as the least stable and predictable cough subject. For users at the top of this plot, one day of cough data yields an accurate prediction of the daily cough frequency for the entire period. By contrast, the bottom of this plot demonstrates that one day of cough data does not accurately predict daily cough frequency on days other than the one being measured.
Fig. 4
Distribution of overall cough frequency predictabilities of the 97 subjects
Fig. 5
Daily coverage of daily cough frequency predictability results for all users. Each row represents one user and each cell is one day. The color of each cell corresponds to the coverage percentage for that day (yellow for > 80%, slightly darker for between 60 and 80%, darker for between 40 and 60%, and red for < 40%)
The cough frequency time series for all 97 users are provided in Supplementary Figure S2.
留言 (0)