
記住我


In total, 347 HCWs were included in the analysis as summarized in Table 1. The study population had a higher proportion of females (76.4%) than males (23.6%), with an average age of 38.9 ± 9.4 years. Their ages ranged from 21 to 63 years. Older individuals could not be included because of retirement. Among them, 73 (21.0%) were in their 20s, 114 (32.9%) were in their 30s, 103 (29.7%) were in their 40s, and 57 (16.4%) were in their 50s and 60s. The participants were generally healthy. The average body mass index (BMI) was 22.3 ± 2.8 kg/m2, with only 2.0% having a BMI greater than 30 kg/m2. Underlying diseases were reported in 11.8% of the participants, with the most common being hypertension (2.9%), followed by uncomplicated diabetes mellitus (1.7%) and hypothyroidism (1.7%). A more detailed distribution of samples across different age groups is provided in Table S2. All participants received the first dose of the ChAd vaccine in March 2021 and the second dose from May to June 2021, with a 12-week interval from the first dose. The third doses of the mRNA vaccine were administered from November 2021 to January 2022 according to the policies of the participating centers. A total of 2,414 specimens from the following seven sampling points were analyzed to investigate age-dependent immune responses: (1) 3 weeks after the first dose (n = 347), (2) 2 weeks after the second dose (n = 347), (3) 6 months after the second dose (n = 341; before the third dose), (4) 1 month after the third dose (n = 335), (5) 3 months after the third dose (n = 343; including 37 cases of BI, 10.8%), (6) 6 months after the third dose (n = 335; including 186 cases of BI, 55.5%), and (7) 9 months after the third dose (n = 366; including 263 cases of BI, 71.9%). Because all participants were healthy and vaccinated at the time of the BI, individuals who experienced BI fully recovered from mild illness, and none progressed to severe disease or required hospitalization. There were nine dropouts during the study period and some were missing sampling points due to personal situations.
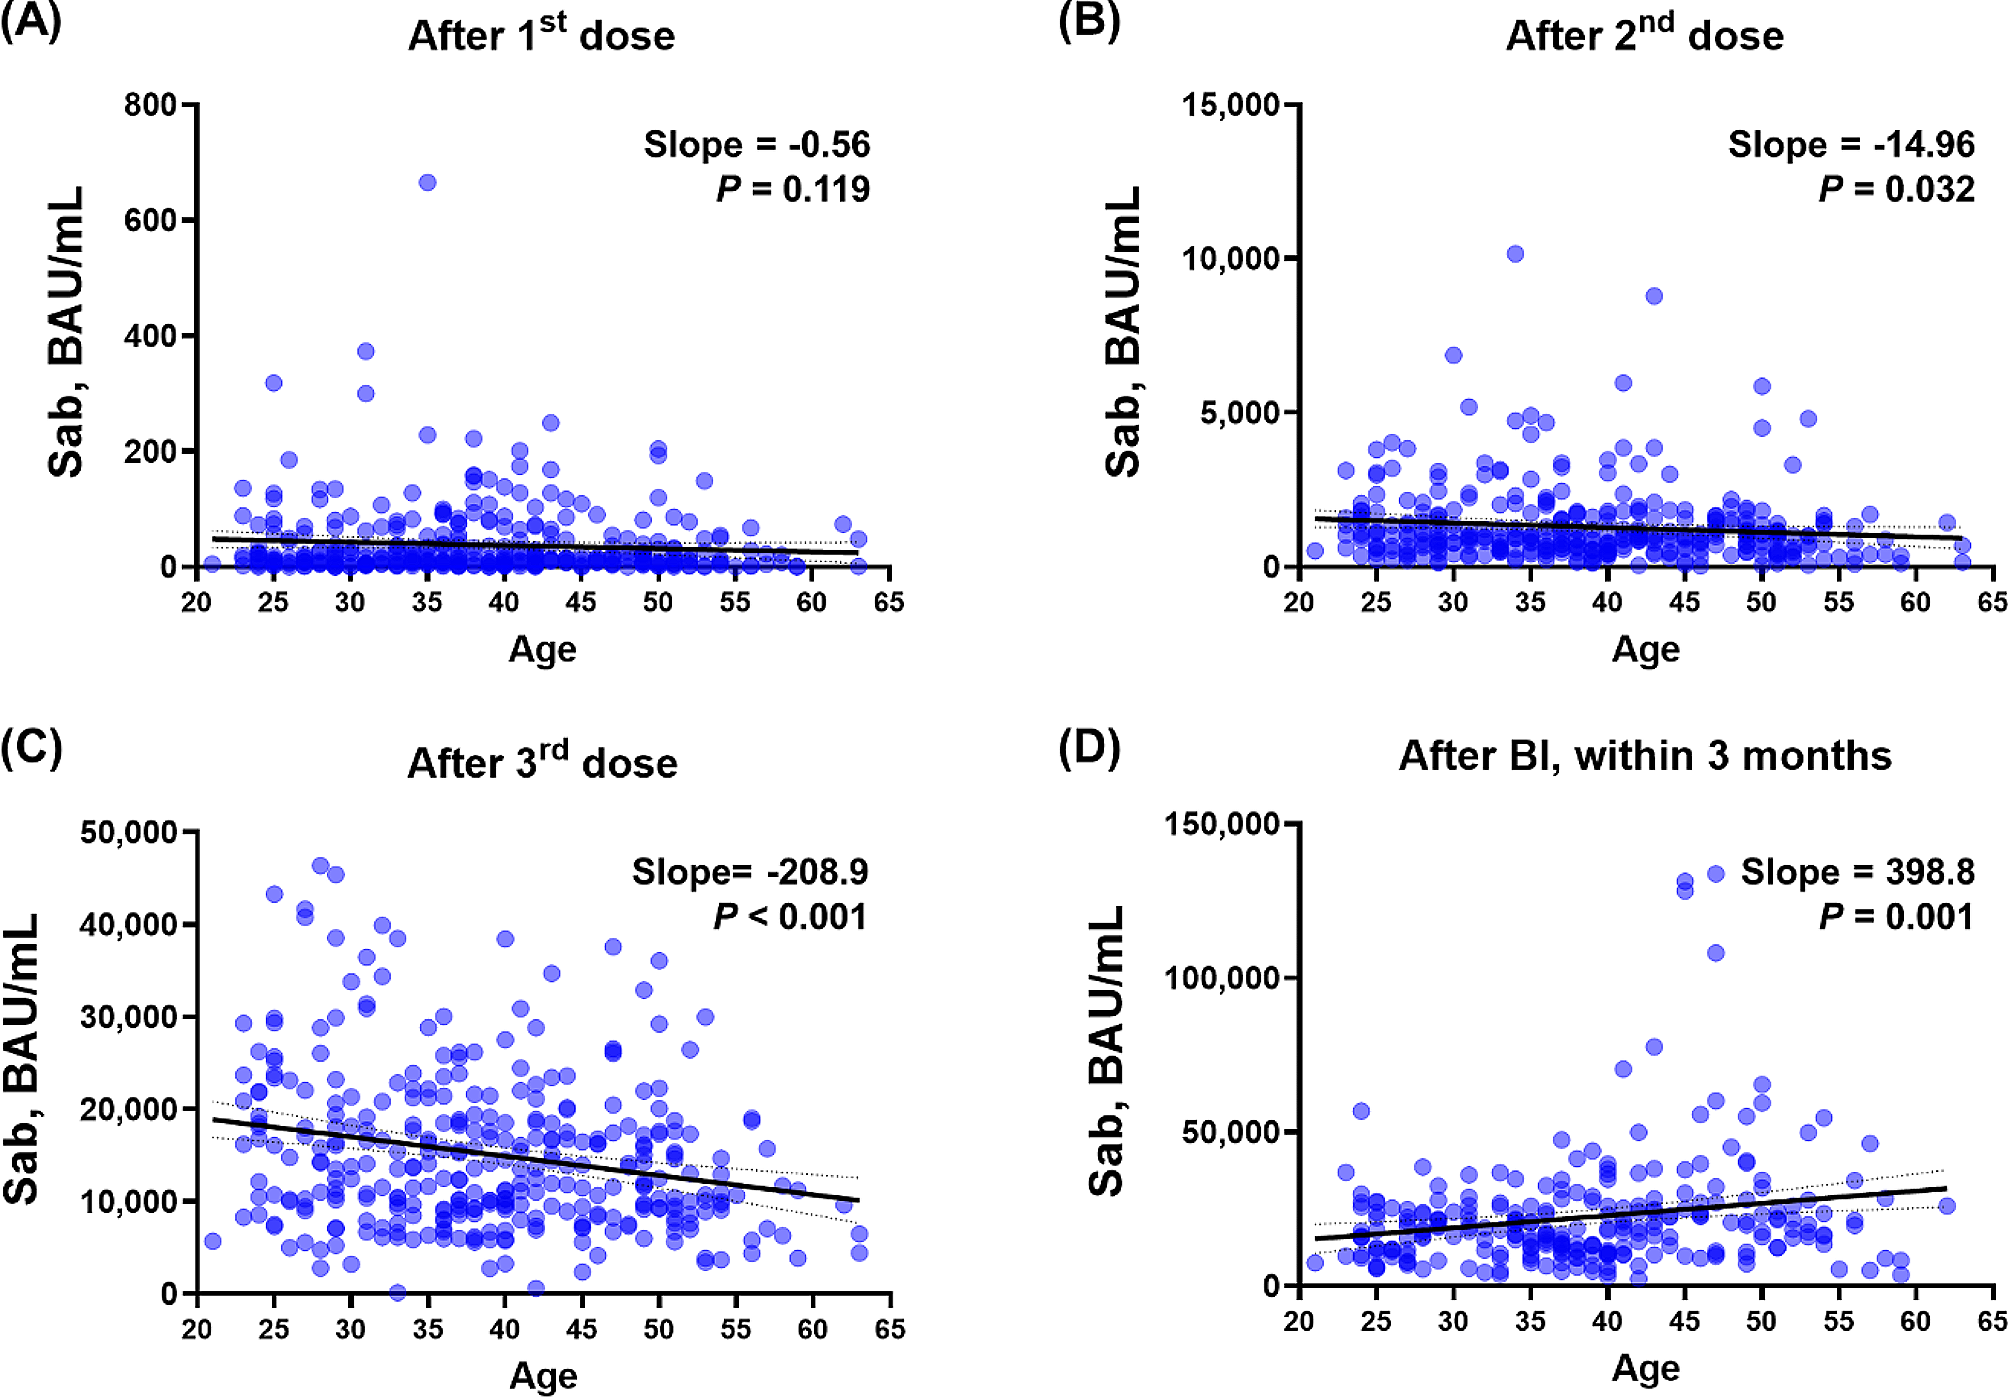
Table 1 Participant demographicsAge-dependent immunogenicity to vaccination and BIQuantile-quantile (Q-Q) plots were generated for Sab post-vaccination, as Additional file 2 illustrates. Despite the Q-Q plot’s overall linear appearance, there were a few variations from the predicted fitness. Consequently, in addition to linear regression, we applied Spearman’s correlation to all main figure sets, summarized the results, and presented them in Table S3. Overall, the significance of the P values from both linear regression and Spearman’s correlation was similar, allowing us to provide more precise statistical measures. As stated above, while the overall trend appeared linear, some deviations were observed. Therefore, we conducted a Spearman correlation analysis, and the significance of the P values was observed to be similar. To investigate age-dependent immune responses to COVID-19 vaccinations and subsequent BIs, we initially analyzed the correlation between age and Sab levels after each antigen-stimulating event (Fig. 1 and Additional file 3 A). After the first dose of vaccination, an inverse linear correlation was observed (slope − 0.56) without statistical significance (P = 0.119). The inverse linear correlation became significant (slope − 14.96, P = 0.032) after the second dose of vaccination and more pronounced after the third dose (slope − 208.9, P < 0.001). However, following BIs, older HCWs exhibited significantly higher Sab titers with a positive linear correlation (slope 398.8, P = 0.001), reversing the age-related decline in immune responses after vaccination. In addition, the Bonferroni correction method was used to correct the relationships of the multiple comparisons (Table S3). After this correction, Fig. 1B is no longer significant, while Fig. 1C and D remain significant. At the waning points, the inverse linear correlation after the third dose of vaccination and the positive linear correlation after BI remained, albeit with decreasing absolute slope values (Additional file 4). Although statistical significance was not achieved in the correlation analysis between age and PRNT titers, owing to the limited number of tested participants (n = 32), an inverse linear correlation was observed in the WT PRNT after the third dose of the vaccine. However, age-dependent correlations were not observed for the BA.1 PRNT or BA.5 PRNT titers, but a positive correlation after BI was observed for all PRNTs ( Additional file 5). Nab levels did not exhibit a clear age-dependent correlation after BI (Additional file 6).
Fig. 1
Age-dependent Sab response after COVID-19 vaccinations and BI. Correlation analysis between age and Sab titers measured at various time points. (A) after the first dose, (B) after the second dose, (C) after the third dose, and (D) after BIs. Each graph shows the slope of the correlation and the P value, indicating the strength and significance of the relationship between age and Sab levels. Abbreviations Sab, anti-spike-protein antibody; BAU, binding antibody unit; COVID-19, coronavirus disease 2019; BI, breakthrough infection
To determine the potential confounding factors, we further investigated other clinical factors that may affect Sab titers in addition to age. First, the association between responses to previous antigenic stimulations and subsequent stimulations was examined using log10 values (Additional file 7). Sab titers measured after the first dose of vaccination exhibited a significant positive linear correlation with those measured after the second dose (slope = 0.25, P < 0.001). Both Sab titers measured after the third dose and BI exhibited statistically significant positive linear correlations, but the correlation gradually diminished, as indicated by decreasing slopes (0.18 and 0.08, respectively). Similarly, Sab titers measured after the second dose exhibited a stronger correlation with those measured after the third dose and weakened after BI (slope = 0.45 and 0.16, respectively). Second, to investigate potential associations with immunogenicity induced by other vaccines, we measured HBsAb titers, as the hepatitis B vaccine is administered during childhood as part of the National Immunization Program. The analysis was conducted after excluding HCWs with positive HBsAg results, and no noticeable correlation was found between HbsAb titers and Sab titers or age (Additional file 8). Finally, sex-based differences were explored, as females tended to be younger in the HCW cohort (Additional file 9). Females exhibited significantly higher Sab titers after the second and third doses of vaccination. However, the difference was diminished after age matching (up to 1:2 matching within 1 year’s difference; male, n = 49, age = 39.7 ± 8.3; female, n = 93, age = 39.4 ± 7.9) and no significant difference between sexes was observed.
Next, to evaluate the age-dependent cellular immune response, we analyzed the interferon-gamma (IFN-γ) response to spike protein stimulation utilizing an IGRA kit (Fig. 2 and Additional file 3B). IFN-γ responses markedly increased after the third dose of vaccination and BI, but age-dependent correlations were not clearly observed overall. Although all the slopes indicated a weak positive correlation and statistical significance was noticed at the resting status before the third dose (P = 0.030, Fig. 2A), the trend was not pronounced after antigenic stimulating events (Fig. 2B and E). When the proportion of good and poor responders divided by the median values was compared at each antigenic stimulation event, there were no statistically significant differences between the young and old age groups (Additional file 10). Additionally, the relationships between the multiple comparisons are corrected using the Bonferroni-corrected P value summarized in Table S3. method. But they demonstrate that not significant.
Fig. 2
Age-dependent IGRA response after COVID-19 vaccinations and BI. Correlation between age and IFN-γ responses measured using an IGRA at various time points. (A) before the third dose, (B) 1 month after the third dose, (C) 3 months after the third dose, (D) 6 months after the third dose, (E) after BIs, and (F) 3–6 months after BIs. Each graph shows the slope of the correlation and the P value. Abbreviations IFN, interferon; IU, international unit; IGRA, interferon-gamma releasing assay; COVID-19, coronavirus disease 2019; BI, breakthrough infection
Immune cell profiling according to age, using multi-parametric mass cytometry analysisTo uncover the underlying immune landscape that may elucidate age-dependent immune responses before and after the third dose of COVID-19 vaccinations and BI, we conducted immune cell profiling using multiparametric CyTOF analysis. Table 2 and Additional file 11 represent immune cell profiling at two specific time points: (1) immediately before the third dose (booster) and (2) one month after the third dose and their responses at these critical points in the vaccination schedule, providing insights into how the immune system adapts to booster vaccination. The detailed profiling helps to identify changes in various immune cell subsets, including B cells, T cells, and other major immune cell types. Additionally, we conducted Spearman’s correlation, which showed no significant difference in terms of statistical significance. The proportion of myeloid cells, including classical/intermediate/non-classical monocytes, and myeloid/plasmacytoid dendritic cells, natural killer cells, and γδ T cells, did not exhibit a clear correlation with age. The proportion of B cell lineages, including naive B cells, memory B cells, plasma cells, plasmablasts, and spike-specific B cells, displayed a weak declining trend with age, supporting the decreased antibody response observed in the middle-aged group. A contrasting phenomenon was observed for T cell lineages. The proportion of naive T cells showed a clear inverse correlation with age. In particular, the age-dependent decline in the proportion of naive CD8+ T cells (P = 0.013) was significant. Meanwhile, the proportion of mature T cell subsets with memory functions, including memory CD4+ T cells, CD8+ central memory T (TCM) cells, CD8+ effector memory T (TEM) cells, CD8+ terminally differentiated effector memory T cells re-expressing CD45RA (TEMRA), and follicular helper T (TFH) cells, demonstrated an increasing trend with age. Additionally, UMAP visualizations (Fig. 3A, B) and quantitative analysis (Fig. 3C) of immune cell profiles before and after the third dose were conducted for age-dependent groups, including middle-aged and young individuals. We also illustrated Sab levels in groups with low and high Sab levels in Additional file 12. Differences in immune cell profiles between these age groups showed distinct patterns before the third dose, but no significant differences were observed after. Spearman correlation with Bonferroni-corrected P values was calculated and showed non-significance, as detailed in Table S3.
Table 2 Correlation between age and immune cell subtypes collected before the third doseFig. 3
Immune cell profiles before and after the third dose of vaccination (A) UMAP visualization of total immune cells, (B) UMAP visualization of immune cells sampled before and after the third dose of vaccination, highlighting the differences in immune cell populations. (C) statistical comparison of each cell type between the two sampling points, including proportions, and significant changes. Abbreviations UMAP, uniform manifold approximation and projection; pDC, plasmacytoid dendritic cell; mDC, myeloid dendritic cell; CD, clusters of differentiation; NK, natural killer; TFH, follicular helper T; CM, central memory; EM, effector memory; TEMRA, terminally differentiated effector memory T cell re-expressing CD45RA
Table 3 Correlation between Sab and immune cell subtypes collected before the third doseTaken together, the age-related decline in Sab titers is hypothesized to be associated with a decrease in B-cell-lineage cells and other immune cell types, P values and slopes are summarized in Table 3. In particular, there is a significant Sab-dependent decrease in the proportion of naive CD4+ T cells (P = 0.038) and an increase in CD8+ TEMRA cells (P = 0.003), as shown in Additional file 13. While IGRA responses were maintained or even slightly increased with age, this phenomenon may be attributed to the compensatory maintenance of memory T cell populations, despite the age-related decline in the proportion of naive CD4+ and CD8+ T cells. The increase in Sab titers after BI may be linked to interactions with these memory T cell populations and TFH cells, warranting further investigation.
留言 (0)