
記住我

Simultaneous Localization and Mapping (SLAM) is a technique where a robot utilizes its own sensors to perceive surrounding information, enabling self-localization without prior environmental knowledge (Khnissi et al., 2022; Sahili et al., 2023). SLAM can be categorized into two main types: laser SLAM and visual SLAM. Visual SLAM employs cameras as data acquisition sensors, providing richer image information. Therefore, it has emerged as a prominent research and application field (Li et al., 2021; Xing et al., 2022; Xu et al., 2023).
The visual SLAM approaches can also be broadly categorized into two main types: feature point method and direct method. In the mainstream feature point method, images captured by the camera are extracted and matched to locate corresponding features on a given map (Eslamian and Ahmadzadeh, 2022; Jiang et al., 2023). Building upon the foundation of traditional ORBSLAM2 (Mur-Artal and Tardós, 2017), Campos et al. (2021) proposed the ORBSLAM3 as an exemplar of the feature point method. The DTAM system proposed by Newcombe et al. (2011) serves as the precursor of the direct method, aligning the entire image for obtaining a dense map and camera pose, thereby enabling real-time dense 3D reconstruction. The LSD-SLAM system proposed by Engel et al. (2014) leverages grayscale information from images to achieve localization and construct a semi-dense point cloud map. The DSO system proposed by Matsuki et al. (2018) is a visual odometer that combines both the direct and sparse methods, utilizing an optimization algorithm to minimize the photometric errors to realize construction of a sparse point cloud map.
In addition to input data, alternative approaches have been put up to address the SLAM issues. These techniques can be broadly classified into two categories: filtering-based and optimization-based techniques (Huang et al., 2013; Liang et al., 2014; Tu et al., 2022). Particle filters and Extended Kalman filters are two instances of the filtering-based technique. Such methods are employed due to the prevalence of noise and inconsistencies in sensor data, allowing for modeling of diverse sources of noise and their impacts on measurements. The second set, the optimization-based technique, has gained significant popularity due to their superior stability, efficiency, robustness, and scalability compared to the filtering-based technique. In these approaches, measurements are typically represented as a graph structure wherein nodes correspond to the robot’s poses and edges denote spatial constraints between different poses (Chen et al., 2022).
The fundamental assumption underlying most early SLAM systems was that the camera constituted the sole moving object within the field of view (Soares and Meggiolaro, 2018; Shen et al., 2021), while the surrounding environment remained predominantly static (Li and Lee, 2016; de Backer et al., 2023). However, both in-door and outdoor scenarios present non-ideal conditions for these frequently encountered situations. Efforts have been made to treat such moving objects, particularly people, as outliers and exclude them from environmental representations. To enhance positioning accuracy in dynamic context, several other SLAM systems employ frame-works that integrate the SLAM system with target tracking and detection (Newcombe et al., 2015; Kim and Kim, 2016; Li and Lee, 2017; Ai et al., 2020; Cui and Ma, 2020; Cheng et al., 2021; Wu et al., 2021).
In recent years, significant achievements have been made in the field of computer vision through the utilization of deep learning algorithms. Currently, target detection algorithms based on deep learning can be mainly categorized into two types: the traditional two-step approaches including R-CNN (Hmidani and Ismaili Alaoui, 2022) and Fast R-CNN (Girshick, 2015), and the more modern end-to-end methods such as YOLO (Han et al., 2023) and SSD (Xiong and Fan, 2021). While the former exhibits high precision, they suffer from limited real-time performance; whereas the latter have greatly improved in real-time capabilities but struggle with detecting small tar-gets accurately. However, with continuous development in deep neural networks, there has been a notable enhancement in image-based target detection accuracy (Hary and Mandala, 2022).
Therefore, those deep learning approaches have been introduced into visual SLAM in recent years. For example, to mitigate the impact of dynamic objects on SLAM, Yu et al. (2018) incorporated semantic segmentation and optical flow techniques into ORB-SLAM2, proposing a DS-SLAM algorithm to alleviate the influence of moving individuals in complex environments. Additionally, they introduced the construction of a semantic octree map to enhance positioning and mapping accuracy. However, it should be noted that semantic segmentation entails significant computational time, hindering real-time performance and potentially leading to feature tracking failures due to insufficient feature points post-dynamic removal. Bescos et al. (2018) pro-posed the DynaSLAM algorithm, which incorporates dynamic target detection and background restoration functions into traditional ORB-SLAM. Additionally, Mask R-CNN (He et al., 2017) is utilized for instance segmentation of dynamic objects. This algorithm improves the accuracy of pose estimation localization; however, it also increases corresponding computational time, rendering it unsuitable for real-time SLAM applications. Zhong et al. (2018) developed the Detect-SLAM system by integrating the SSD (Single Shot Multi Box Detector) target detection network with a SLAM system to identify objects in image sequences using a pre-trained target detection network. Dynamic feature points are removed during the ORB feature extraction stage to significantly enhance the accuracy and robustness of SLAM in dynamic environments. Ran et al. (2021) introduced RS-SLAM as a robust semantic RGB-D SLAM system that improves region of interested extraction accuracy by incorporating context information based on Bayesian update to modify segmentation results. Furthermore, it is capable of constructing a clean static semantic OctoMap in a dynamic environment. Some experts and scholars have done some research in the field of YOLO and SLAM, such as, Tian et al. (2022) proposed a SLAM system based on ORB-SLAM2 for dynamic environment, Based on RGB-D camera, the system uses YOLOX-S to detect dynamic objects and combines depth information to filter dynamic points. Tang et al. (2023) introduced a visual SLAM framework designed for dynamic indoor environments. Cong et al. (2024) proposed a dynamic visual SLAM (SEG-SLAM) system based on the orientated FAST and rotated BRIEF (ORB)-SLAM3 framework and you only look once (YOLO)v5 deep-learning method. You et al. (2022) proposed a novel multimodal semantic SLAM system (MISD-SLAM), which removes the dynamic objects in the environments and reconstructs the static background with semantic information.
To enhance the positioning accuracy and real-time performance of visual SLAM, this study proposes a robust visual SLAM algorithm that integrates target detection and clustering in dynamic scenarios by incorporating the lightweight YOLOv5 net-work. The primary research contributions are as follows:
1. The original backbone network in YOLOv5 is substituted with a Ghost light-weight module to effectively reduce network parameters, while simultaneously incorporating the CBAM attention mechanism into the Backbone to enhance its ability in capturing important information. Additionally, the K-means clustering algorithm is employed to determine anchor frame sizes that align with the detection scale within the detection network. By introducing detection layers and expanding detection scales, notable improvements are achieved in terms of the network’s detection performance;
2. The target detection module has been integrated into the front end of SLAM, utilizing an improved YOLOv5 algorithm for enhanced performance.
2 Visual SLAM algorithm integrating target detection and clustering in dynamic scenarios 2.1 Visual SLAM mathematical modelSLAM requires the robot to perceive environmental information through its in-stalled sensors and subsequently accomplish self-localization map construction. This paper utilizes data from the camera sensors, whereby when the robot detects a land-mark point yj at a specific location xk, it generates an observation datum zk,j that can be represented by an abstract function h:
zk,j=h(yj,xk,vk,j) (1)Equation 1 is the observation equation, where vk,j represents the observation noise.
It can also be described by an abstract function f:
xk=f(xk−1,uk,wk) (2)Equation 2 is the motion equation, where xk−1 and xk denote the states of the robot at k−1 and k respectively; uk denotes the input of the motion sensor; and wk denotes the noise added in the process.
The SLAM process can be summarized into Equation 3:
{xk=f(xk−1,uk,wk)zk,j=h(yj,xk,vk,j) (3)where u represents the measured motion value and z the sensor reading. The above two equations explain the methodology for solving the positioning problem (estimation x) and the mapping problem (estimation y) when u and z are known. This is formulated as a state estimation problem, typically addressed through extended Kalman filter and nonlinear optimization techniques. Considering the superior performance of nonlinear optimization in visual SLAM, this paper adopts a nonlinear optimization scheme.
In this approach, all variables to be estimated are consolidated into a single state variable, the process is shown in Equation 4:
x=x(x1,x2⋯,xN,y1,y2,⋯,yN) (4)When the input data u and the observation data z are known, the conditional probability distribution of state x is P(x|,u|,z).
2.2 Traditional visual SLAM frameworkThe classic SLAM system is usually composed of a front end and a back end. The primary function of the front end is to construct the map by utilizing the sensor data to obtain initial state estimates and establish constraints between states. On the other hand, the back end employs the nonlinear optimization to mitigate cumulative errors. The algorithm framework is illustrated in Figure 1.
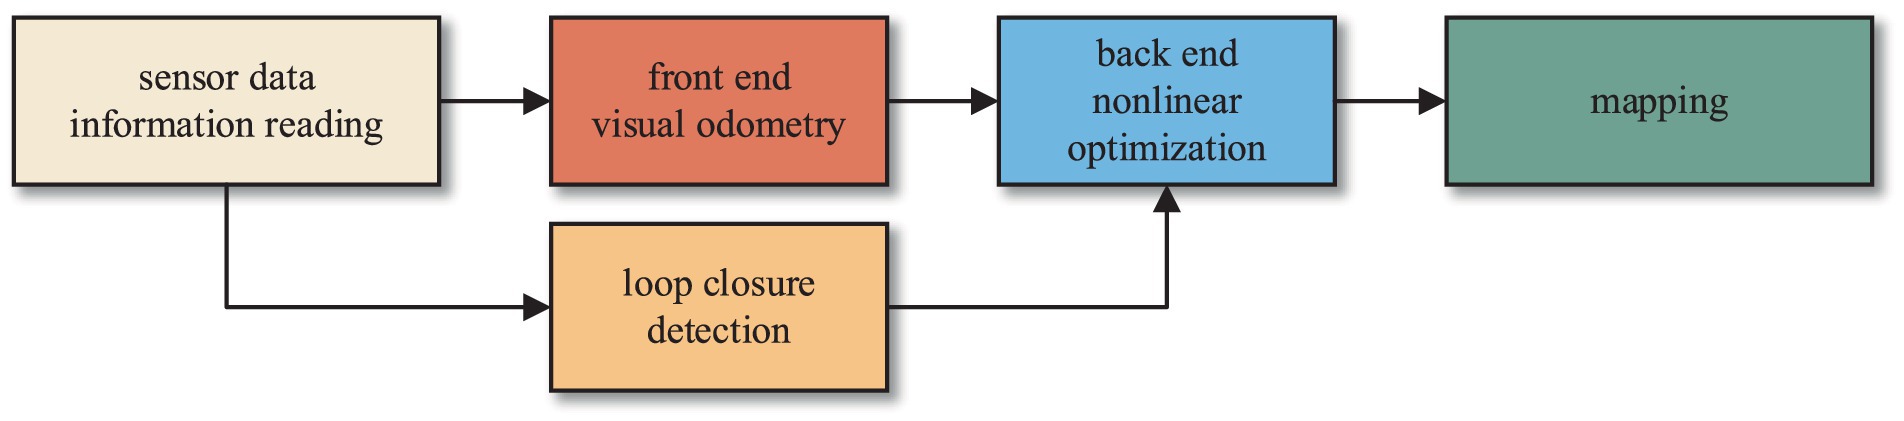
Figure 1. Classic visual SLAM framework.
Firstly, feature points are extracted from the images captured by the camera. Subsequently, feature matching is performed on the two consecutive images to eliminate mismatched feature points. Then, estimation of pose changes for the mobile robot at the current moment is conducted based on these adjacent images. The pose changes estimated by the visual odometry typically represent short-term variations and are prone to cumulative errors as the robot moves. Therefore, closed-loop detection and back-end optimization are employed in the SLAM system to reduce these cumulative errors.
ORB-SLAM3 is the pioneering feature-based tightly coupled VIO system. The Threads and structure diagram of ORB-SLAM3 is shown in Figure 2. It incorporates three concurrent threads for tracking, local mapping, closed-loop detection, and map fusion. The tracking thread extracts and matches ORB feature points while estimating the relative pose between two frames by minimizing the reprojection error. The local mapping thread integrates new keyframes and Map Points into the active map, eliminates redundancy, and updates the map using BA within a sliding window. The closed-loop detection and map fusion thread identifies keyframes to detect potential closed loops, and continuously corrects the accumulated drift errors through pose graph optimization. Finally, the global BA considers medium- to long-term matches from a closed-loop detection to provide an optimized MAP estimate.
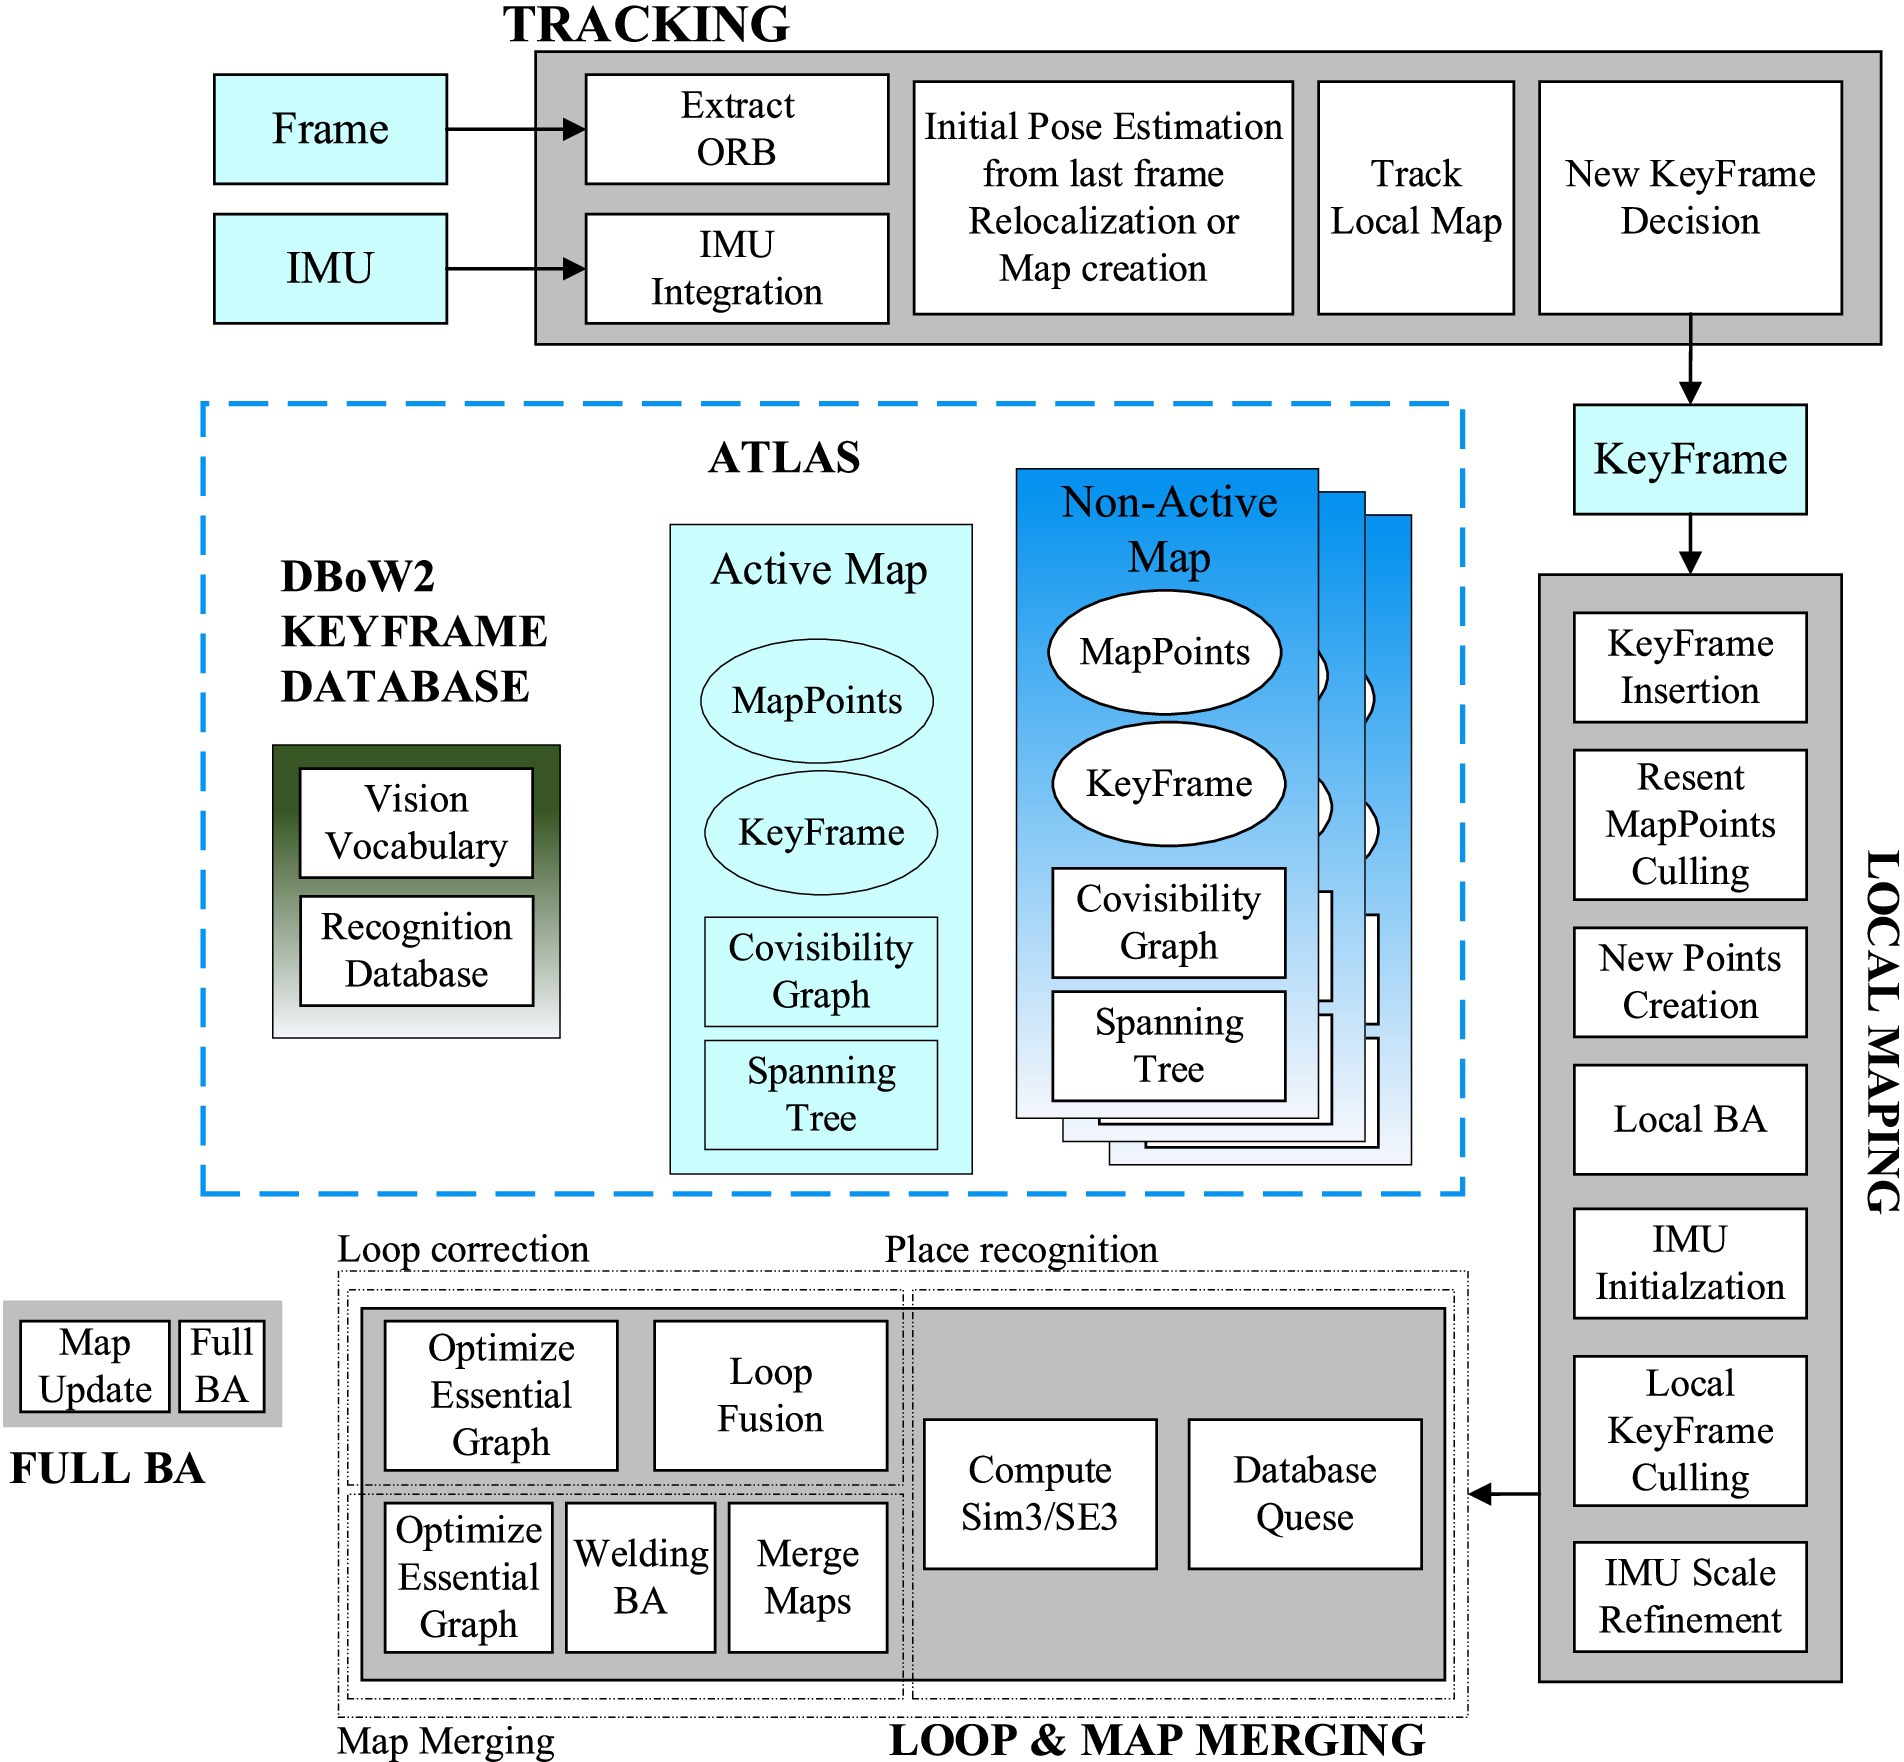
Figure 2. Threads and structure diagram of ORB-SLAM3 system.
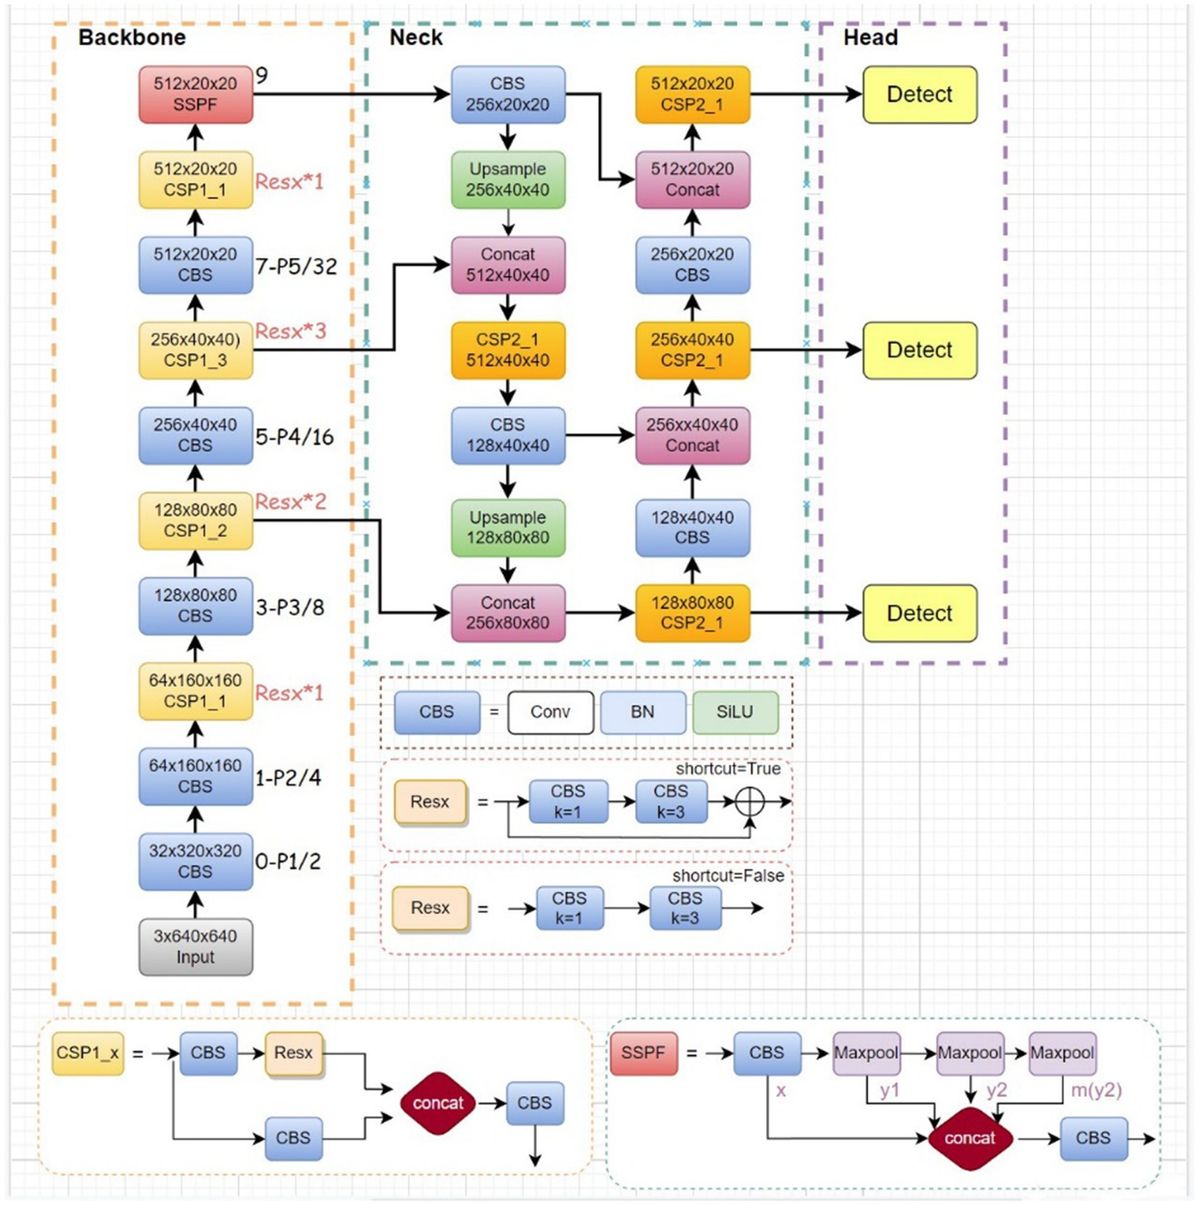
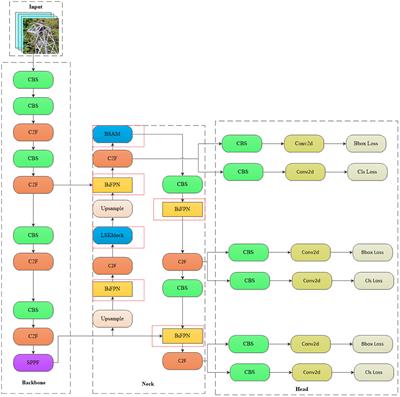
2.3 Lightweight target detection algorithm based on YOLOv5sThe YOLO series serves as an exemplary representative of the first-order target detection algorithms. Compared with traditional algorithms, the YOLO algorithm exhibits a simple structure, faster detection speed, and higher detection accuracy in detecting targets. Building upon YOLOv4, YOLOv5 further enhances its network architecture, training strategy, and data augmentation techniques to achieve improved speed and accuracy. Due to its lightweight characteristics and low memory usage, YOLOv5 proves advantageous for application scenarios involving mobile devices or resource-constrained systems. Among the YOLOv5 series models, YOLOv5s stands out with faster runtime performance while imposing lower hardware requirements; thus making it more suitable for deployment on mobile terminals. Considering that the indoor dynamic environment primarily consists of large targets and mobile devices have limited computing power, this section proposes an enhanced lightweight target detection algorithm based on YOLOv5s network to cater to the demands of real-time target detection in dynamic scenarios. The improvements include: (1) Replacing common convolutions with more lightweight Ghost convolutions to reduce computational complexity and enhance system performance; (2) Incorporating CBAM attention mechanism into Backbone for improved information capture capability; (3) Introducing the K-means clustering algorithm for better effects, adding detection layers and scales to enhance network’s detection performance. The modified structure of the YOLOv5s network is illustrated in Figure 3.
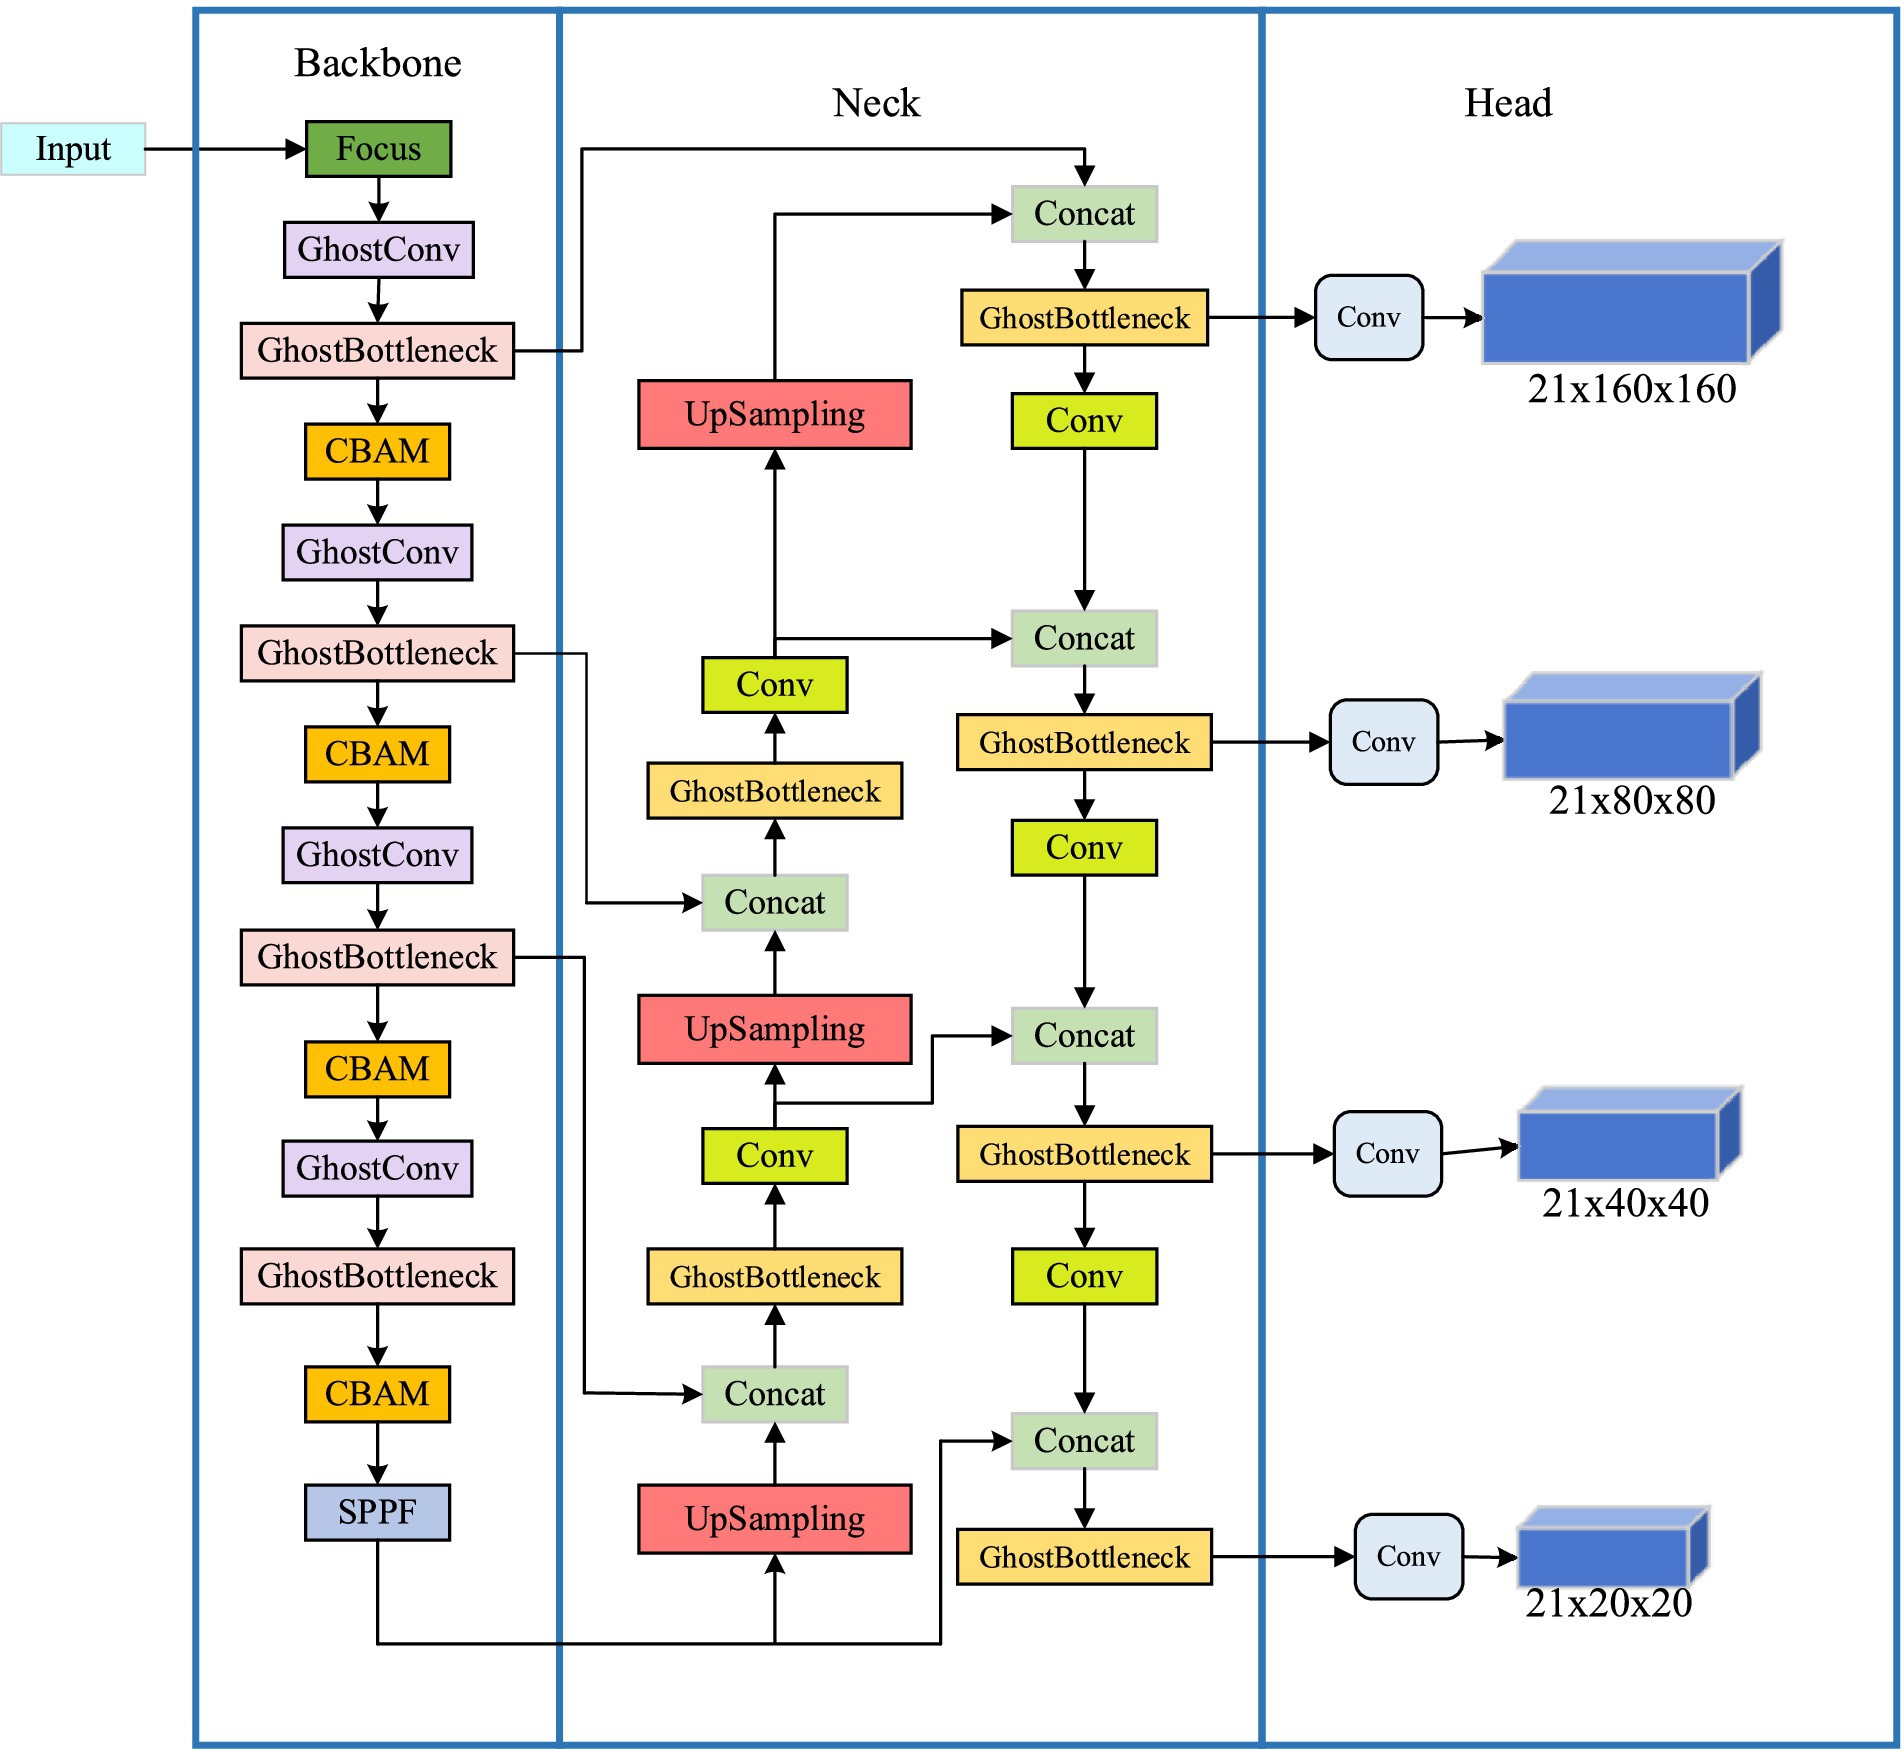
Figure 3. Improved YOLOv5s network structure diagram.
2.3.1 Replace ghost convolutionThe original backbone network is partitioned, and then the feature maps of three scales of 128×80×80, 256×40×40, and 512×20×20 are obtained through three rounds of downsampling. To reduce computational load, a lightweight module Ghost Bottleneck is introduced to replace the BottleneckCSP convolution module in the backbone network. The Ghost module primarily ensures network detection accuracy while employing less computationally intensive linear operations instead of the original convolution operation, achieving feature map generation via a convolution kernel. Furthermore, the depth wise convolution is employed to perform linear operations on each channel of the feature map for channel expansion, thereby effectively con-ducting hierarchical convolution processing on the input feature map.
The Ghost lightweight module structure diagram is depicted on the left in Figure 4, while the improved backbone network structure is presented on the right. By incorporating a lightweight network, computational load of the network is effectively reduced.
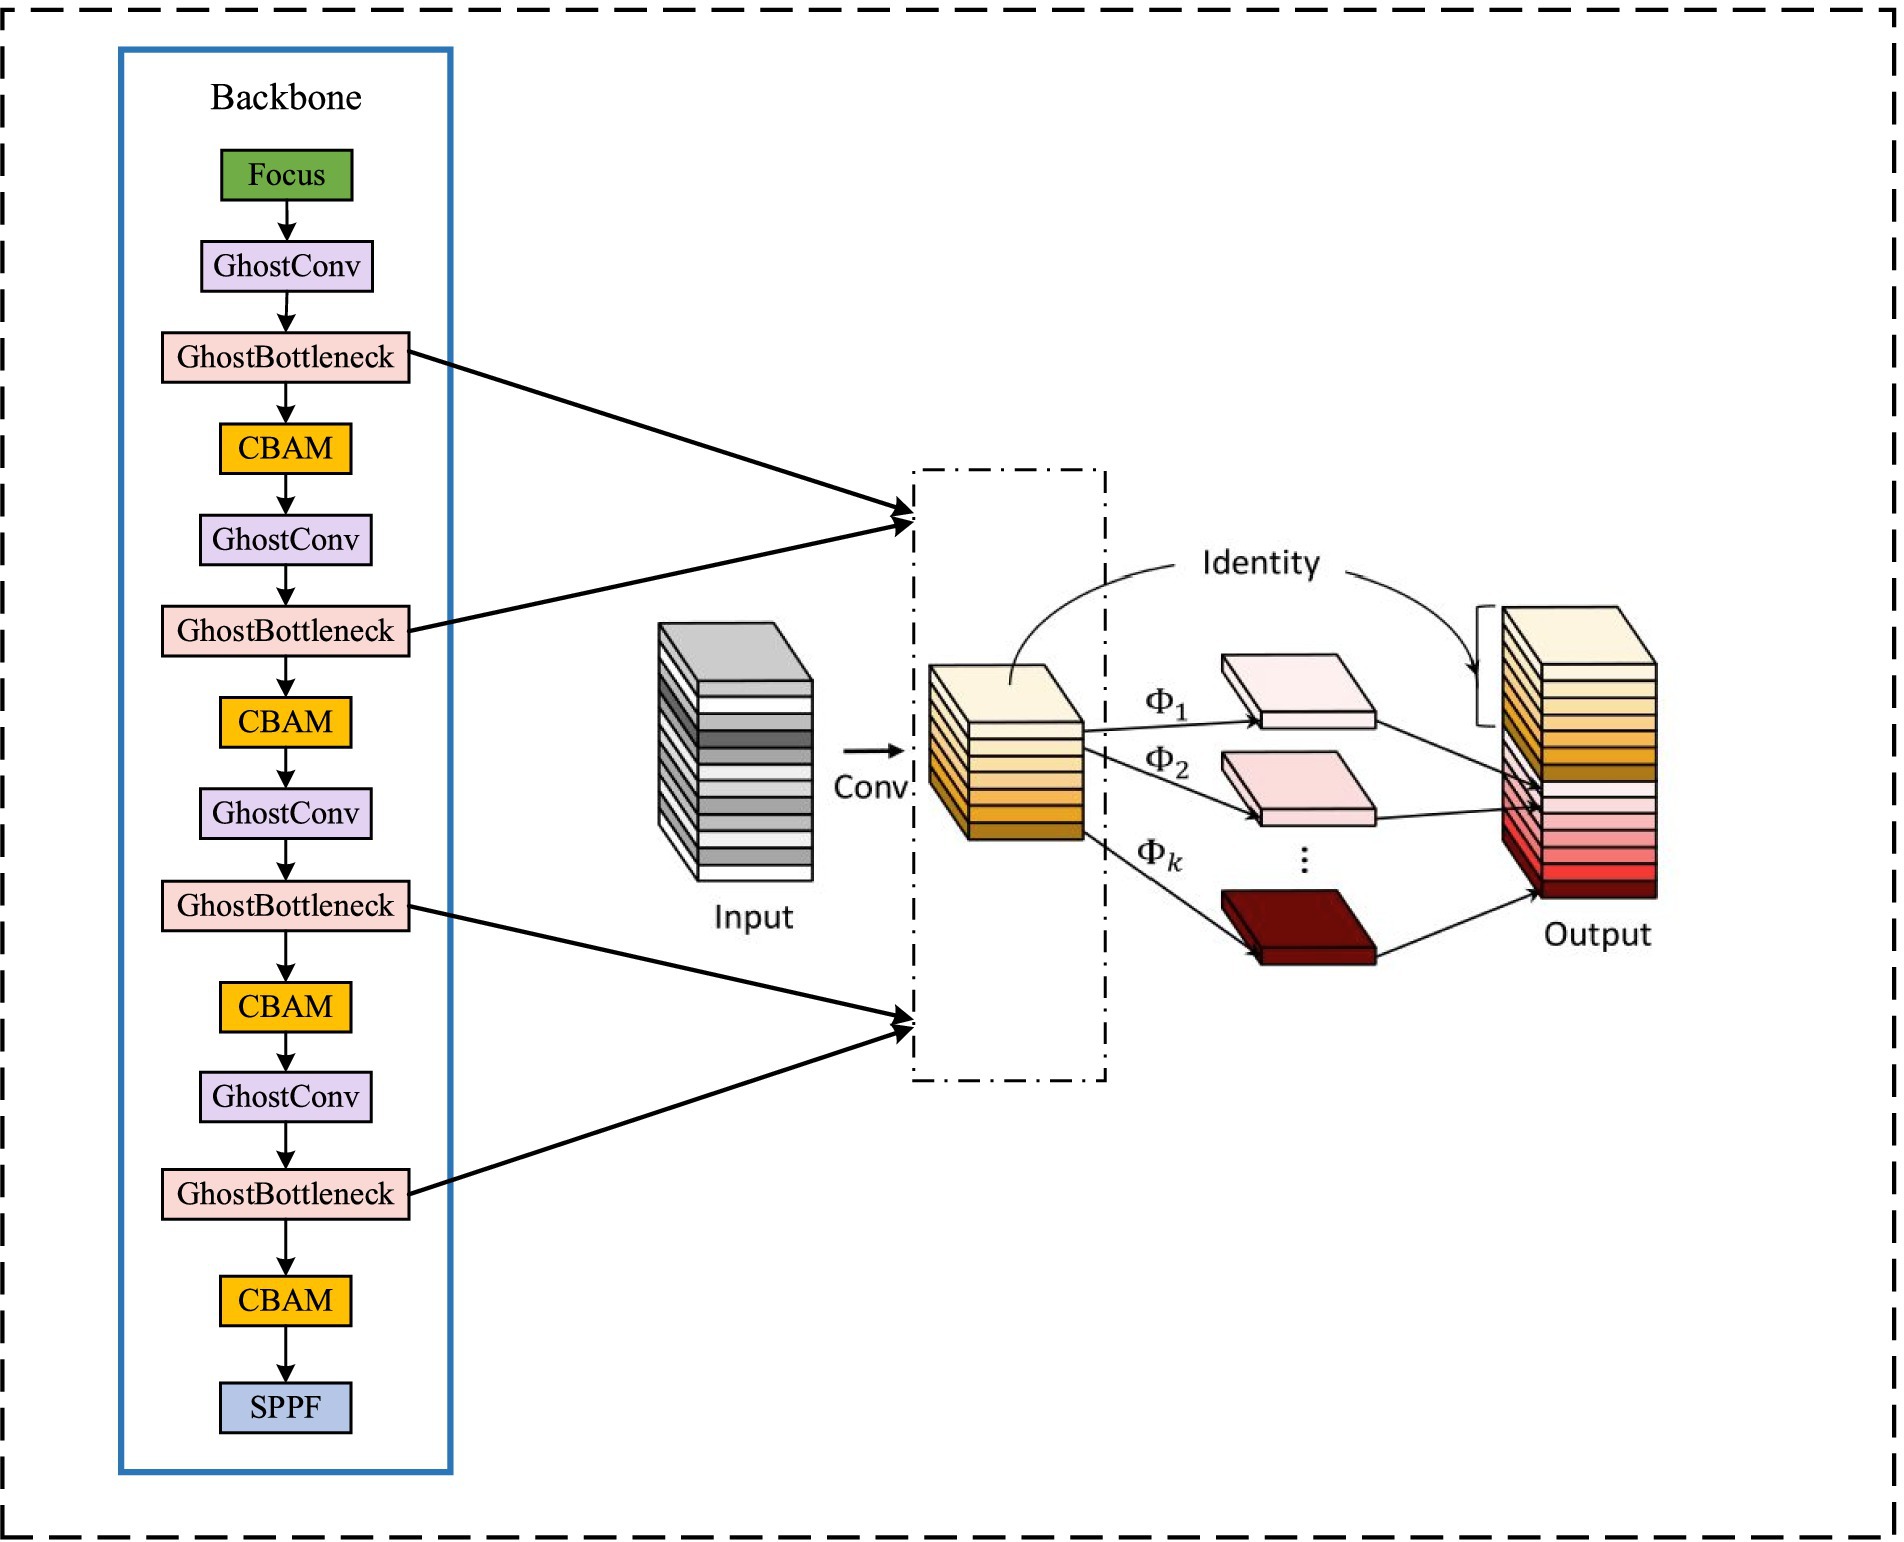
Figure 4. Ghost backbone network structure diagram.
The ordinary convolution operation, the parameter NUMparameters, and the calculation FLOPs expression are respectively:
NUMparameters=ksize×ksize×cin×cout (5) FLOPs=cout×hout×wout×cin×ksize×ksize (6)Where: ksize is the size of the convolution kernel; cin and cout are the number of input channels and output channels, respectively; hout and wout are the height and width of the output feature map, respectively.
The expressions of parameter G_NUMparameters and computation G_FLOPs of the GhostMoudle network are:
G_NUMparameters=1×1×cin×cout2×ksize×ksize×cout2 (7) G_FLOPs=cout2×hout×wout×cin×1×1+cout2×hout×wout×ksize×ksize (8)Through the comparison Eqs. (5–8), it can be seen that the calculation amount and parameter number of the GhostBottleneck network are 1/(2ksize×ksize) + 1/(2cin) times that of the ordinary convolution operation, which can achieve the purpose of network lightweight.
The network proposed in this paper fully leverages the feature map generated during the sampling process on the backbone network. Building upon the original YOLOv5 three-layer detection layer, we combine the downsampling-generated feature map with its corresponding scale feature map from the head to form a minimum scale detection layer.
2.3.2 Add K-means clusteringThe YOLOv5-based detection network in this study enhances the detection net-work by integrating the detection characteristics of target objects. In the original detection network, the anchor frame size is predetermined, and target objects are detected across different feature maps. Specifically, a smaller anchor frame is employed to detect small target objects on larger feature maps that contain more intricate details, while the larger anchor frame is set to detect large target objects on smaller feature map.
The detection network is designed to detect human objects, and the size of different types of objects varies greatly, requiring calculation of new anchor frame sizes ac-cording to the annotation information in the dataset. To obtain a more suitable anchor frame size for detection scale matching, the K-means clustering algorithm is utilized to divide annotated anchor frames in the dataset into clusters that match network detection scales.
The specific process of the K-means algorithm is as follows. Firstly, a value is randomly selected from the sample as the clustering center C1, and the minimum IoU distance d(x) between all samples and the existing clustering center is calculated. The clustering center C1 is selected according to the probability by using the Eq. (9). Repeat this step until K cluster centers are found. For each sample xi in the data set, the IoU distance from xi to K cluster centers is calculated, and it is divided into the category corresponding to the cluster center with the smallest distance. According to the division result, K clustering centers are recalculated by using Eq. (10), and the operation is repeated until the position of the clustering center does not change, and the final clustering center is output. Through the K-means clustering algorithm, the anchor box suitable for the TUM RGB-D dataset is finally generated.
Ci=(1/|C1|)∑x∈C1x (9) p=d(x)2/∑x∈Bd(x)2 (10) 2.3.3 Add CBAM attention mechanismThe Convolutional Block Attention Module (CBAM) attention mechanism ad-dresses both the channel and spatial dimensions in the feature graphs obtained through convolutional operations. In the channel attention module, the spatial dimension of the feature maps is compressed, assigning weights to different channels based on their respective features. Similarly, within the spatial attention module, the feature map is compressed along the channel dimension while obtaining an attention map with varying weights for different spatial positions.
The processing of the input feature map is illustrated in Figure 5, where CBAM exhibits a structured architecture comprising two interconnected components: the channel attention module and the spatial attention module. The input feature map is divided into two branches. One branch represents the feature map from the previous stage, which undergoes channel attention module to acquire attention weights of equal dimensions. The other branch corresponds to the original feature map, and their respective outputs are multiplied together to yield the input for the next stage. In the next stage, it further bifurcates into two branches: one for generating a feature map with spatial attention, and the other for a feature map with channel attention for the preceding stage. By multiplying these branch-specific feature maps, a composite feature map encompassing both channel and spatial attention is ultimately obtained.
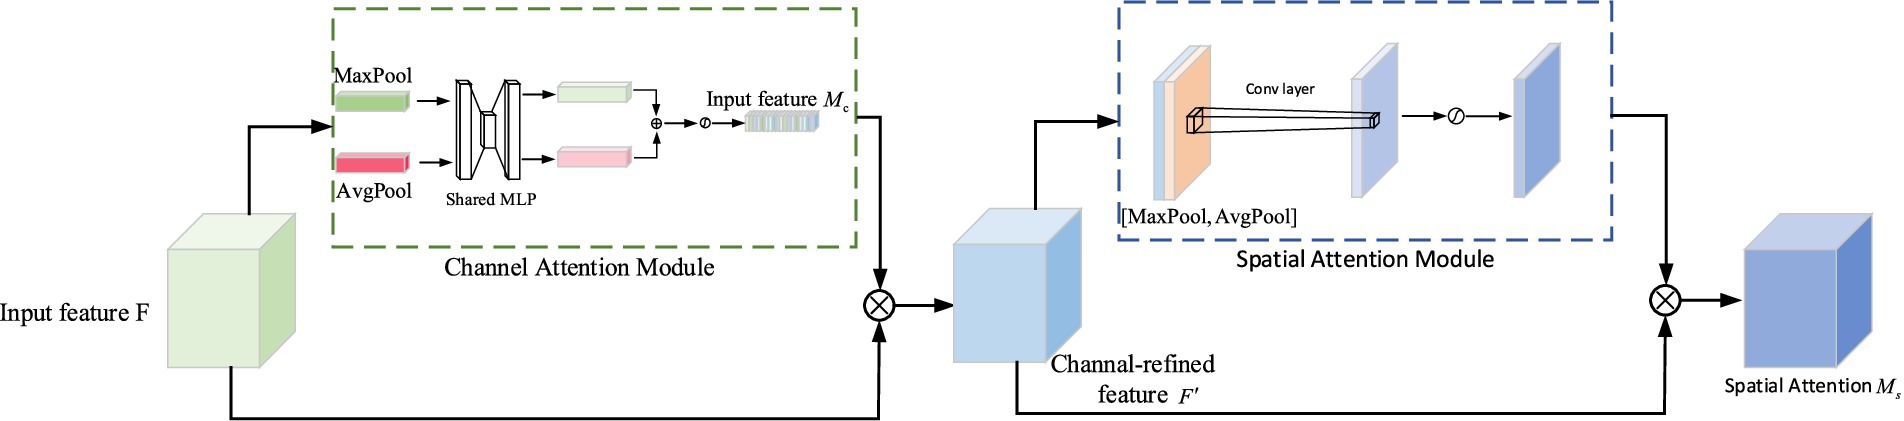
Figure 5. CBAM module structure diagram.
The following will introduce the access attention structure and the spatial attention structure, respectively.
Where: F is the input feature map; Mc is the feature map output after passing through the channel attention structure; F′ represents the result of the multiplication of Mc and F; Ms represents the feature map output after the CBAM attention mechanism; AvgPool represents the average pooling operation; MaxPool represents the maximum pooling operation; MLP represents multi-layer perceptron (fully connected layer); σ is the Sigmoid activation function.
As shown in the figure, the channel attention module in the CBAM attention mechanism extracts the spatial information of the feature map by summing the input feature map F through global average pooling and global maximum pooling to obtain two-channel feature maps Fmaxc and Favgc. Then, the shared network hidden layer MLP will process the two features passed in turn. Once the function σ is activated, the attention channel feature map Mc will be obtained. The two-layer parameters in the multi-layer perception model are represented by W0 and W1. The Channel Attention Module-specific calculation formula is shown in Equation 11:
Ms(F)=σ(MLP(AvgPool(F))+MLP(MaxPool(F)))=σ(W1(W0(Favgc))+W1(W0(Fmaxc))) (11)The Spatial Attention Module module in the CBAM attention mechanism first performs global maximum addition and global mean addition on each channel to obtain two H×W×1 feature maps and then performs channel splicing. After 7×7 convolution, the dimension is reduced to H × W × 1. Next, the spatial attention feature is generated by the Sigmoid activation function, and finally, the final feature output is obtained by multiplying the input feature map. The specific calculation formula of the Spatial Attention Module module is shown in Equation 12:
Ms(F)=σ(f7∗7([MaxPool(F);AvgPool(F)]))=σ(f7∗7([Favgs;Fmaxs])) (12)where σ represents the sigmoid function; Fmaxc and Favgc represent the maximum pooling operation and the average pooling operation in the Channel Attention Module, respectively. Fmaxs and Favgs represent the maximum pooling operation and the average pooling operation in the Spatial Attention Module, respectively. f7∗7 denotes a convolution kernel of size 7 × 7.
2.3.4 Add detection scaleDuring the target detection process, the network is required to simultaneously detect targets of different sizes, and the proportions of these targets can significantly impact the detection accuracy of the network model. In our dataset, mice constitute a relatively small proportion compared to other objects with larger proportions. As we increase the depth of the network, both the detailed and semantic information about target objects undergo continuous changes. Shallow layers in the network tend to pro-vide better semantic information for small target objects; however, deeper layers may diminish their semantic information while causing loss of details. On the other hand, larger target objects necessitate a deeper network to capture their semantic information effectively. To better improve the detection accuracy of convolutional neural networks, we design a network structure tailored o the size characteristics specific to four types of target objects present in the TUM RGB-D dataset: person, chair, computer, and keyboard.
As shown in Figure 3, the network architecture consists of three components arranged from left to right: the network backbone for image information acquisition, the network neck for feature fusion, and the network head for computational processing to detect target object category and position. Moreover, a four-scale detection hierarchy is incorporated into the design of the network to enable compatible detection of both large and small target objects. By effectively fusing the shallow detail information with the deep semantic information, valuable image details extracted from feature maps are retained, thereby facilitating simultaneous detection of target objects with significant proportion differences and ultimately enhancing overall network detection performance.
2.4 Robust visual SLAM based on target detection and clusteringTo enhance the positioning accuracy and robustness of the traditional ORB-SLAM system in dynamic environments, we integrate the above improved YOLOv5 algorithm as an object detection module into SLAM. The target detection module is incorporated into the tracking thread to identify and eliminate the dynamic ORB feature points on moving targets, ensuring that only the static feature points contribute to the pose estimation. The improved SLAM tracking thread in this paper is shown in Figure 6.
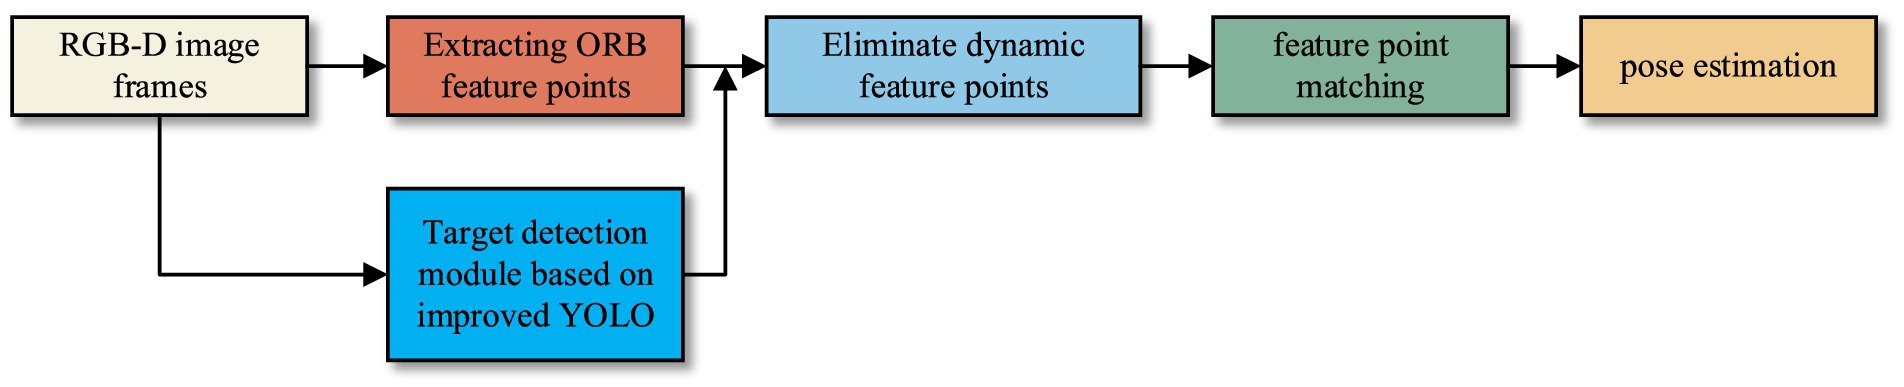
Figure 6. The improved SLAM tracking thread in this paper.
3 Results and discussion 3.1 Experiment settingWe implement all experiments on a computer with Intel Core i7-11700 CPU, Nvidia GTX 3060 GPU, 32 GB RAM. The operating system is Ubuntu 18.04 with ROS Melodic.
The input image size is 640×480, the initial learning rate is 0.01, the learning rate momentum is 20.8, the weight attenuation coefficient is 0.0005, the batch_size is 4, the workers is 1, and the epoch is 300.
3.2 Experimental datasetsThe TUM dataset, widely employed for evaluating SLAM performance in dynamic scenarios, is selected for this experiment. The TUM RGB-D dataset comprises two types of scenes: high dynamic scenes and low dynamic scenes. The high dynamic scene is denoted as “walking,” while the low dynamic scene is referred to as “sitting.” Each type of dynamic scene is further divided into four image sequences: halfsphere, xyz, rpy, and static. These sequences represent distinct camera movements during image acquisition: traversing in a 1 m hemisphere, moving along coordinate axes, rotating on rolling, pitch and yaw axes, or remaining stationary. In the sitting (S) sequence, two individuals are seated at a table engaged in conversation and gesturing, resulting in minimal movement. In the walking (W) sequence, two individuals simultaneously traverse the background and foreground before eventually taking their seats in front of the table. This dataset exhibits highly dynamism, posing significant challenges for conventional SLAM systems.
3.3 Lightweight target detection algorithm verification 3.3.1 DatasetConsidering that the primary dynamic objects in the indoor scene are predominantly individuals, this experiment aims to assess the efficacy of the enhanced Yolov5s algorithm by selecting a total of 1,000 images from the TUM dataset, specifically from the ‘people’ category, for training and testing purposes. All tests are conducted 5 times, and the final results are averaged.
3.3.2 Performance evaluationThe performance of the target detection algorithm is usually evaluated by mean average precision (mAP), which reflects the accuracy performance of the model under different recall rates. A higher mAP value indicates that the model can maintain high accuracy even under a high recall rate. Therefore, the higher the mAP value, the better the performance of the model. The calculation procedure is outlined in Equation 13:
mAP=1n∑i=1nAPi (13)Where m represents ‘mean’, and AP represents the average accuracy of a certain type of sample. In this paper, ablation experiments are carried out to compare the impacts of different strategies (replacing Ghost convolution, incorporating CBAM attention mechanism, and adding a detection layer) on model performance. The evaluation metric used is mAP@0.5 with an IoU threshold set at 0.5.
The results in Table 1 demonstrate that the replacement of the original convolution with Ghost convolution in the Yolov5s algorithm leads to a reduction in model parameters to 4.88 M, an increase in detection speed by 7 FPS, and a slight decrease in detection accuracy by 2.4%. Furthermore, incorporating CBAM attention mechanism and detection layer can further enhance the detection accuracy. Compared with the original algorithm, our proposed algorithm increases the mAP by 7%, reduces model size by 28.9%, and enhances detection speed by 6FPS. These improvements effectively address the demand for lightweight target detection algorithms on mobile devices as they not only improve the detection accuracy but also meet the real-time requirements.
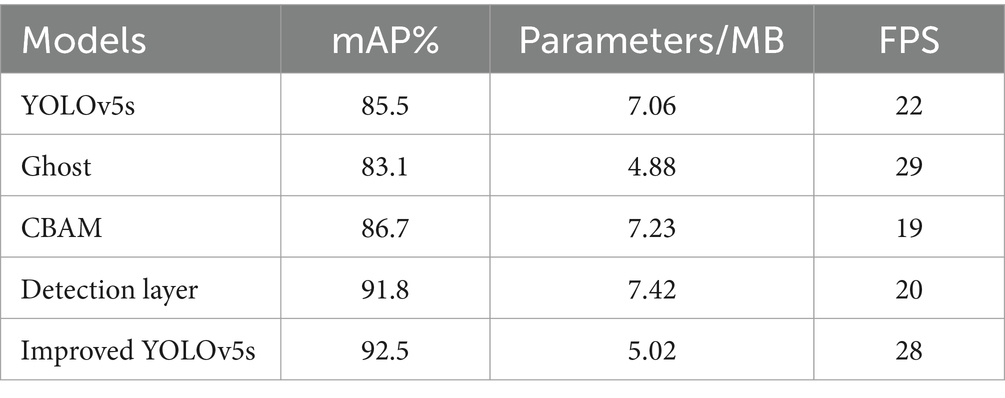
Table 1. Comparative results of ablation experiments.
3.3.3 Dynamic target detection experimentThe improved lightweight YOLOv5s network is employed for target detection, and the resulting detection performance is illustrated in Figure 7. As depicted, the category of the detection result is presented within the figure. In dynamic scenes, humans are considered as high-mobility targets; thus, the target detection network is configured exclusively for human recognition. The comparison test results before and after adding K-means clustering are shown in Figure 8, (a) listed as the test results after adding K-means, and (b) listed as the test results without adding K-means. It can be observed that on the one hand, the large target can be completely detected, and on the other hand, it still has high confidence when only the exposed head, arm or leg parts of the human body are visible.
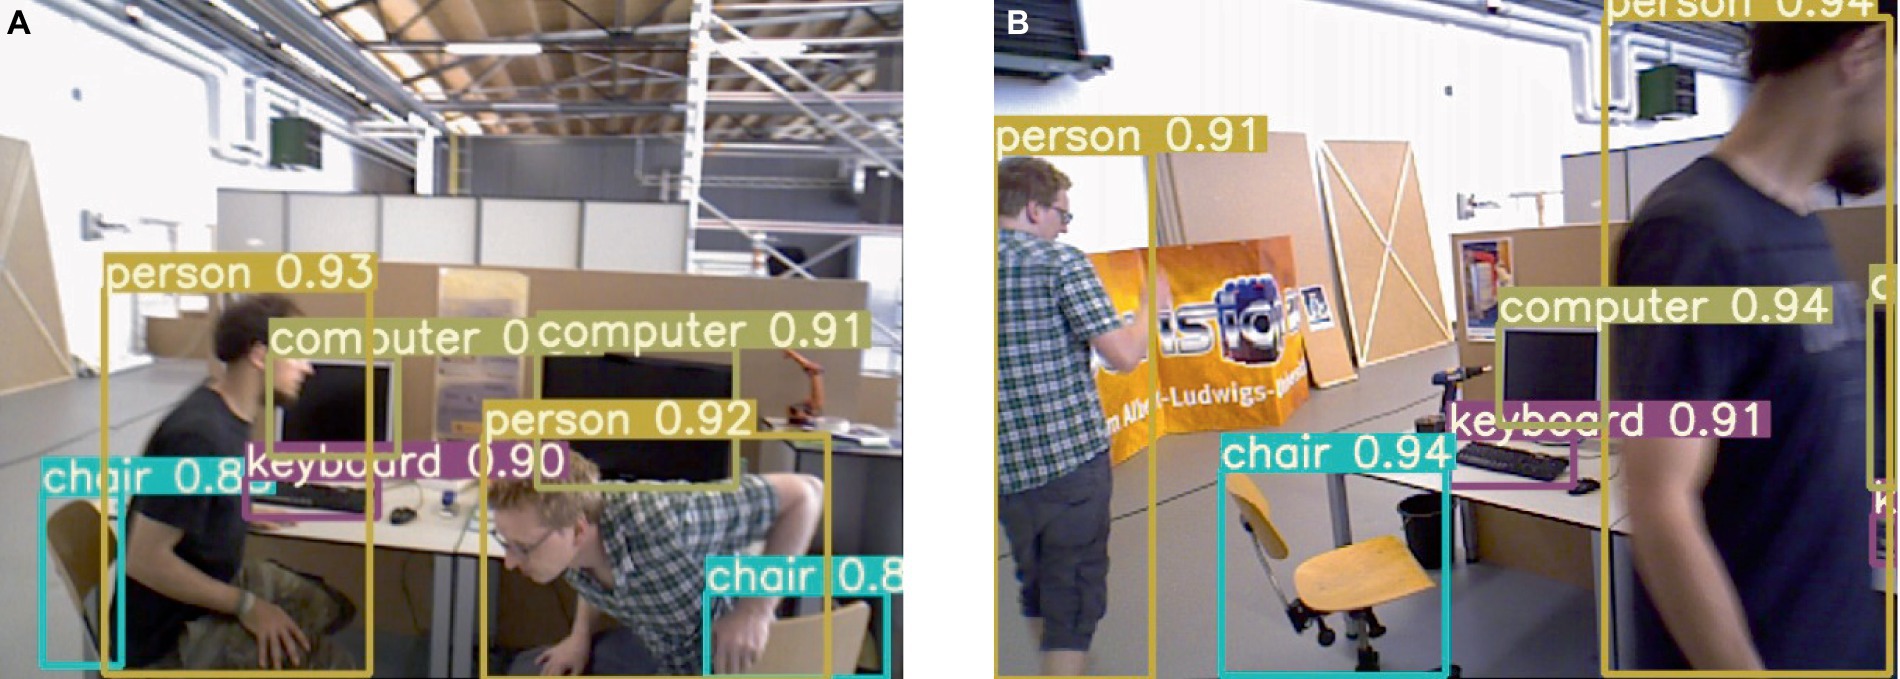
Figure 7. Example of improved YOLOv5s detection effect.
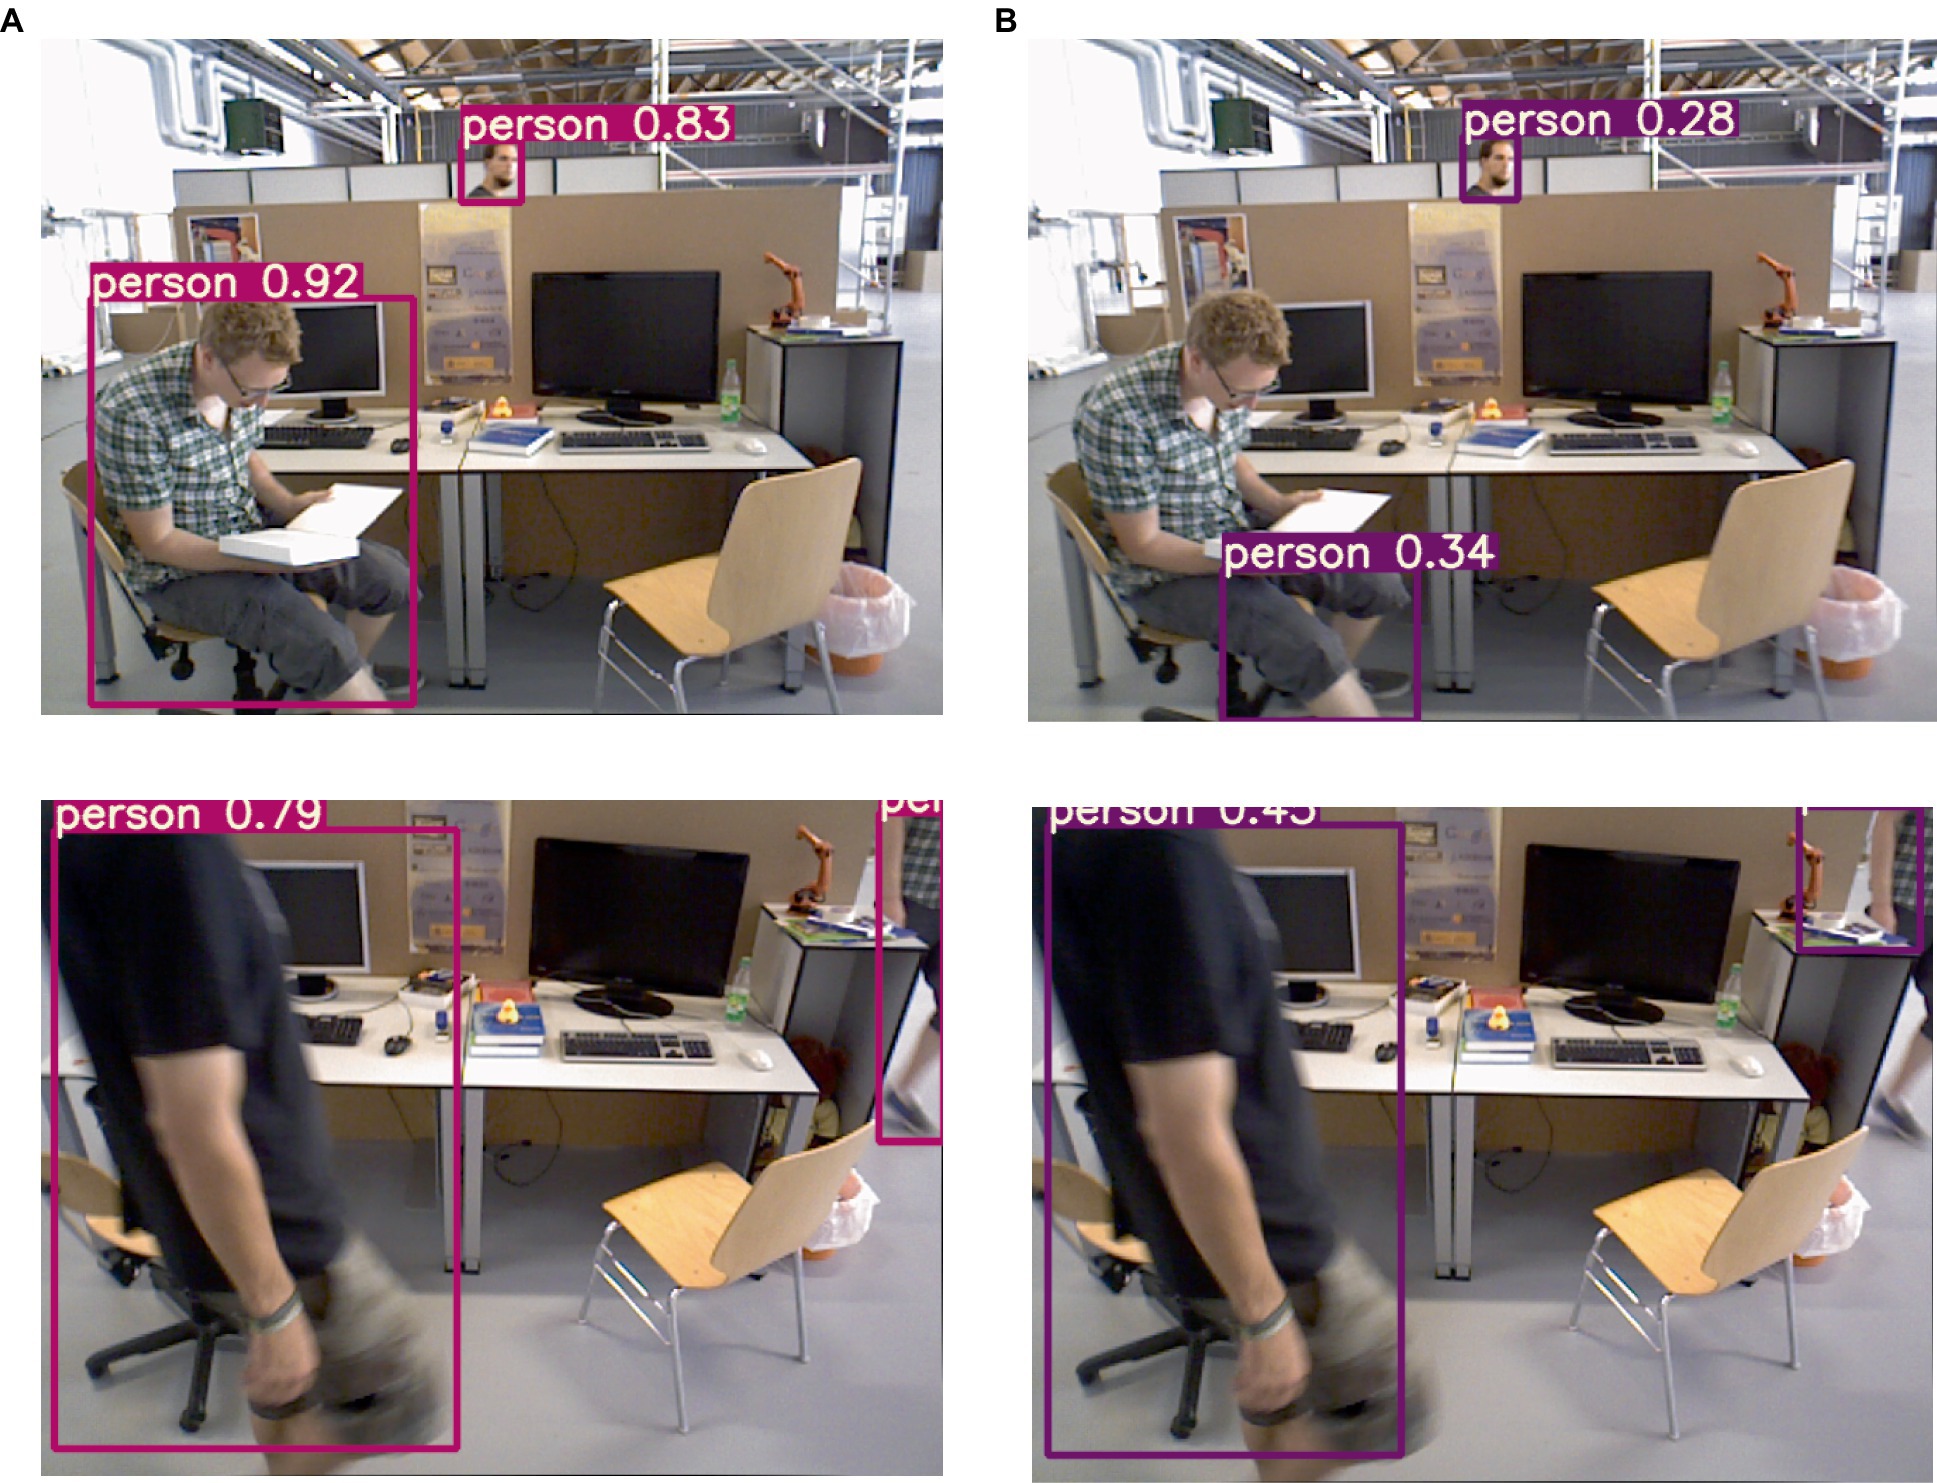
Figure 8. Results of detecting people in motion.
The comparative performance results between our algorithm and the traditional ORB-SLAM3 algorithm on the f3 dataset are illustrated in the Figure 9: (a) is the original image, (b) is the feature points extracted by the original ORB-SLAM3, and (c) is the feature points extracted by our proposed algorithm.
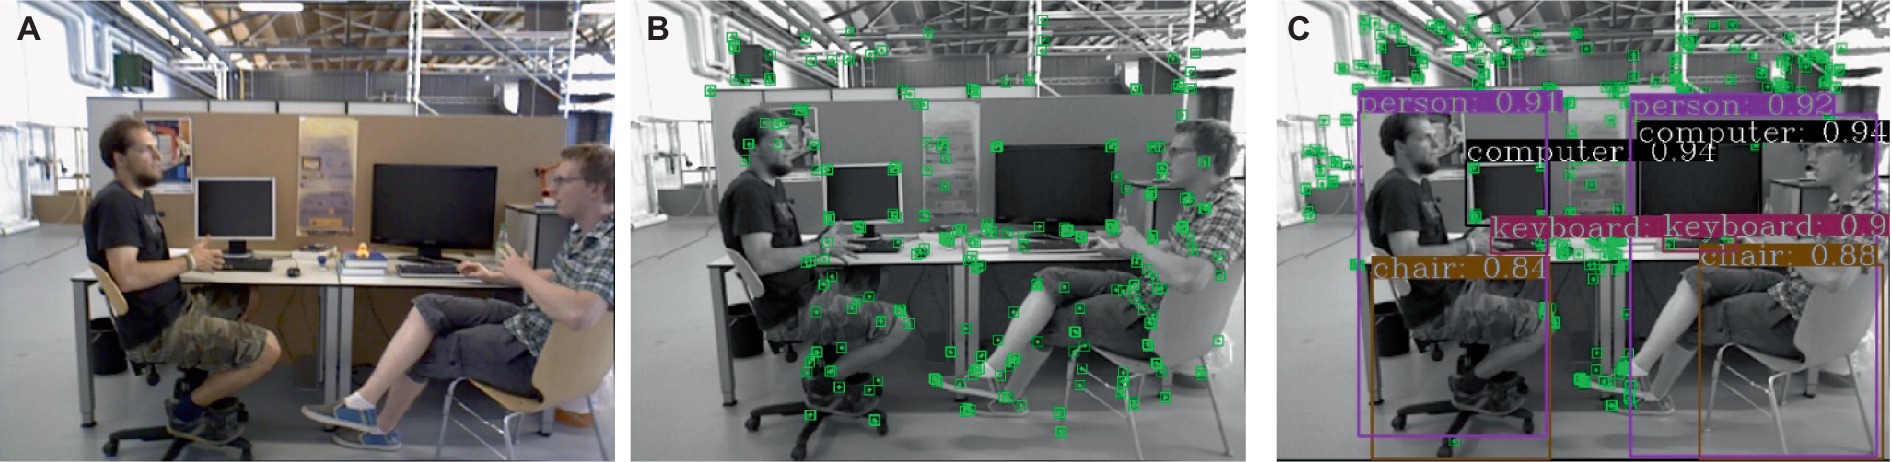
Figure 9. The comparison of feature point extraction between the proposed algorithm and the ORB-SLAM3 algorithm.
3.4 Pose estimation accuracy experiment 3.4.1 Comparison of trajectory error resultsAbsolute Trajectory Error (ATE) is commonly employed to evaluate the positioning accuracy of the SLAM systems. In our pose estimation error analysis experiment, we utilize the evo tool to evaluate and compare the camera pose CameraTrajectory.txt estimated by the ORB-SLAM system with the true pose groundtruth.txt given by the dataset. The ATE enables us to quantify the disparity between the true and estimated values of the camera pose, thereby assessing global consistency of the trajectory. We compute the root mean square error (RMSE), median (Median), mean (Mean), and standard deviation (Std) as evaluation metrics for quantifying errors.
Figure 10 presents the comparison results between the real trajectory and the trajectory estimated by, respectively, the ORB-SLAM3 and our algorithm in a low dynamic scene. Figure 11 demonstrates such comparison results in a high dynamic scene. The first and second columns of these figures represent the trajectory and error of ORB-SLAM3 respectively, while the third and fourth columns are the trajectory and error of our proposed algorithm. The gray das
留言 (0)