
記住我
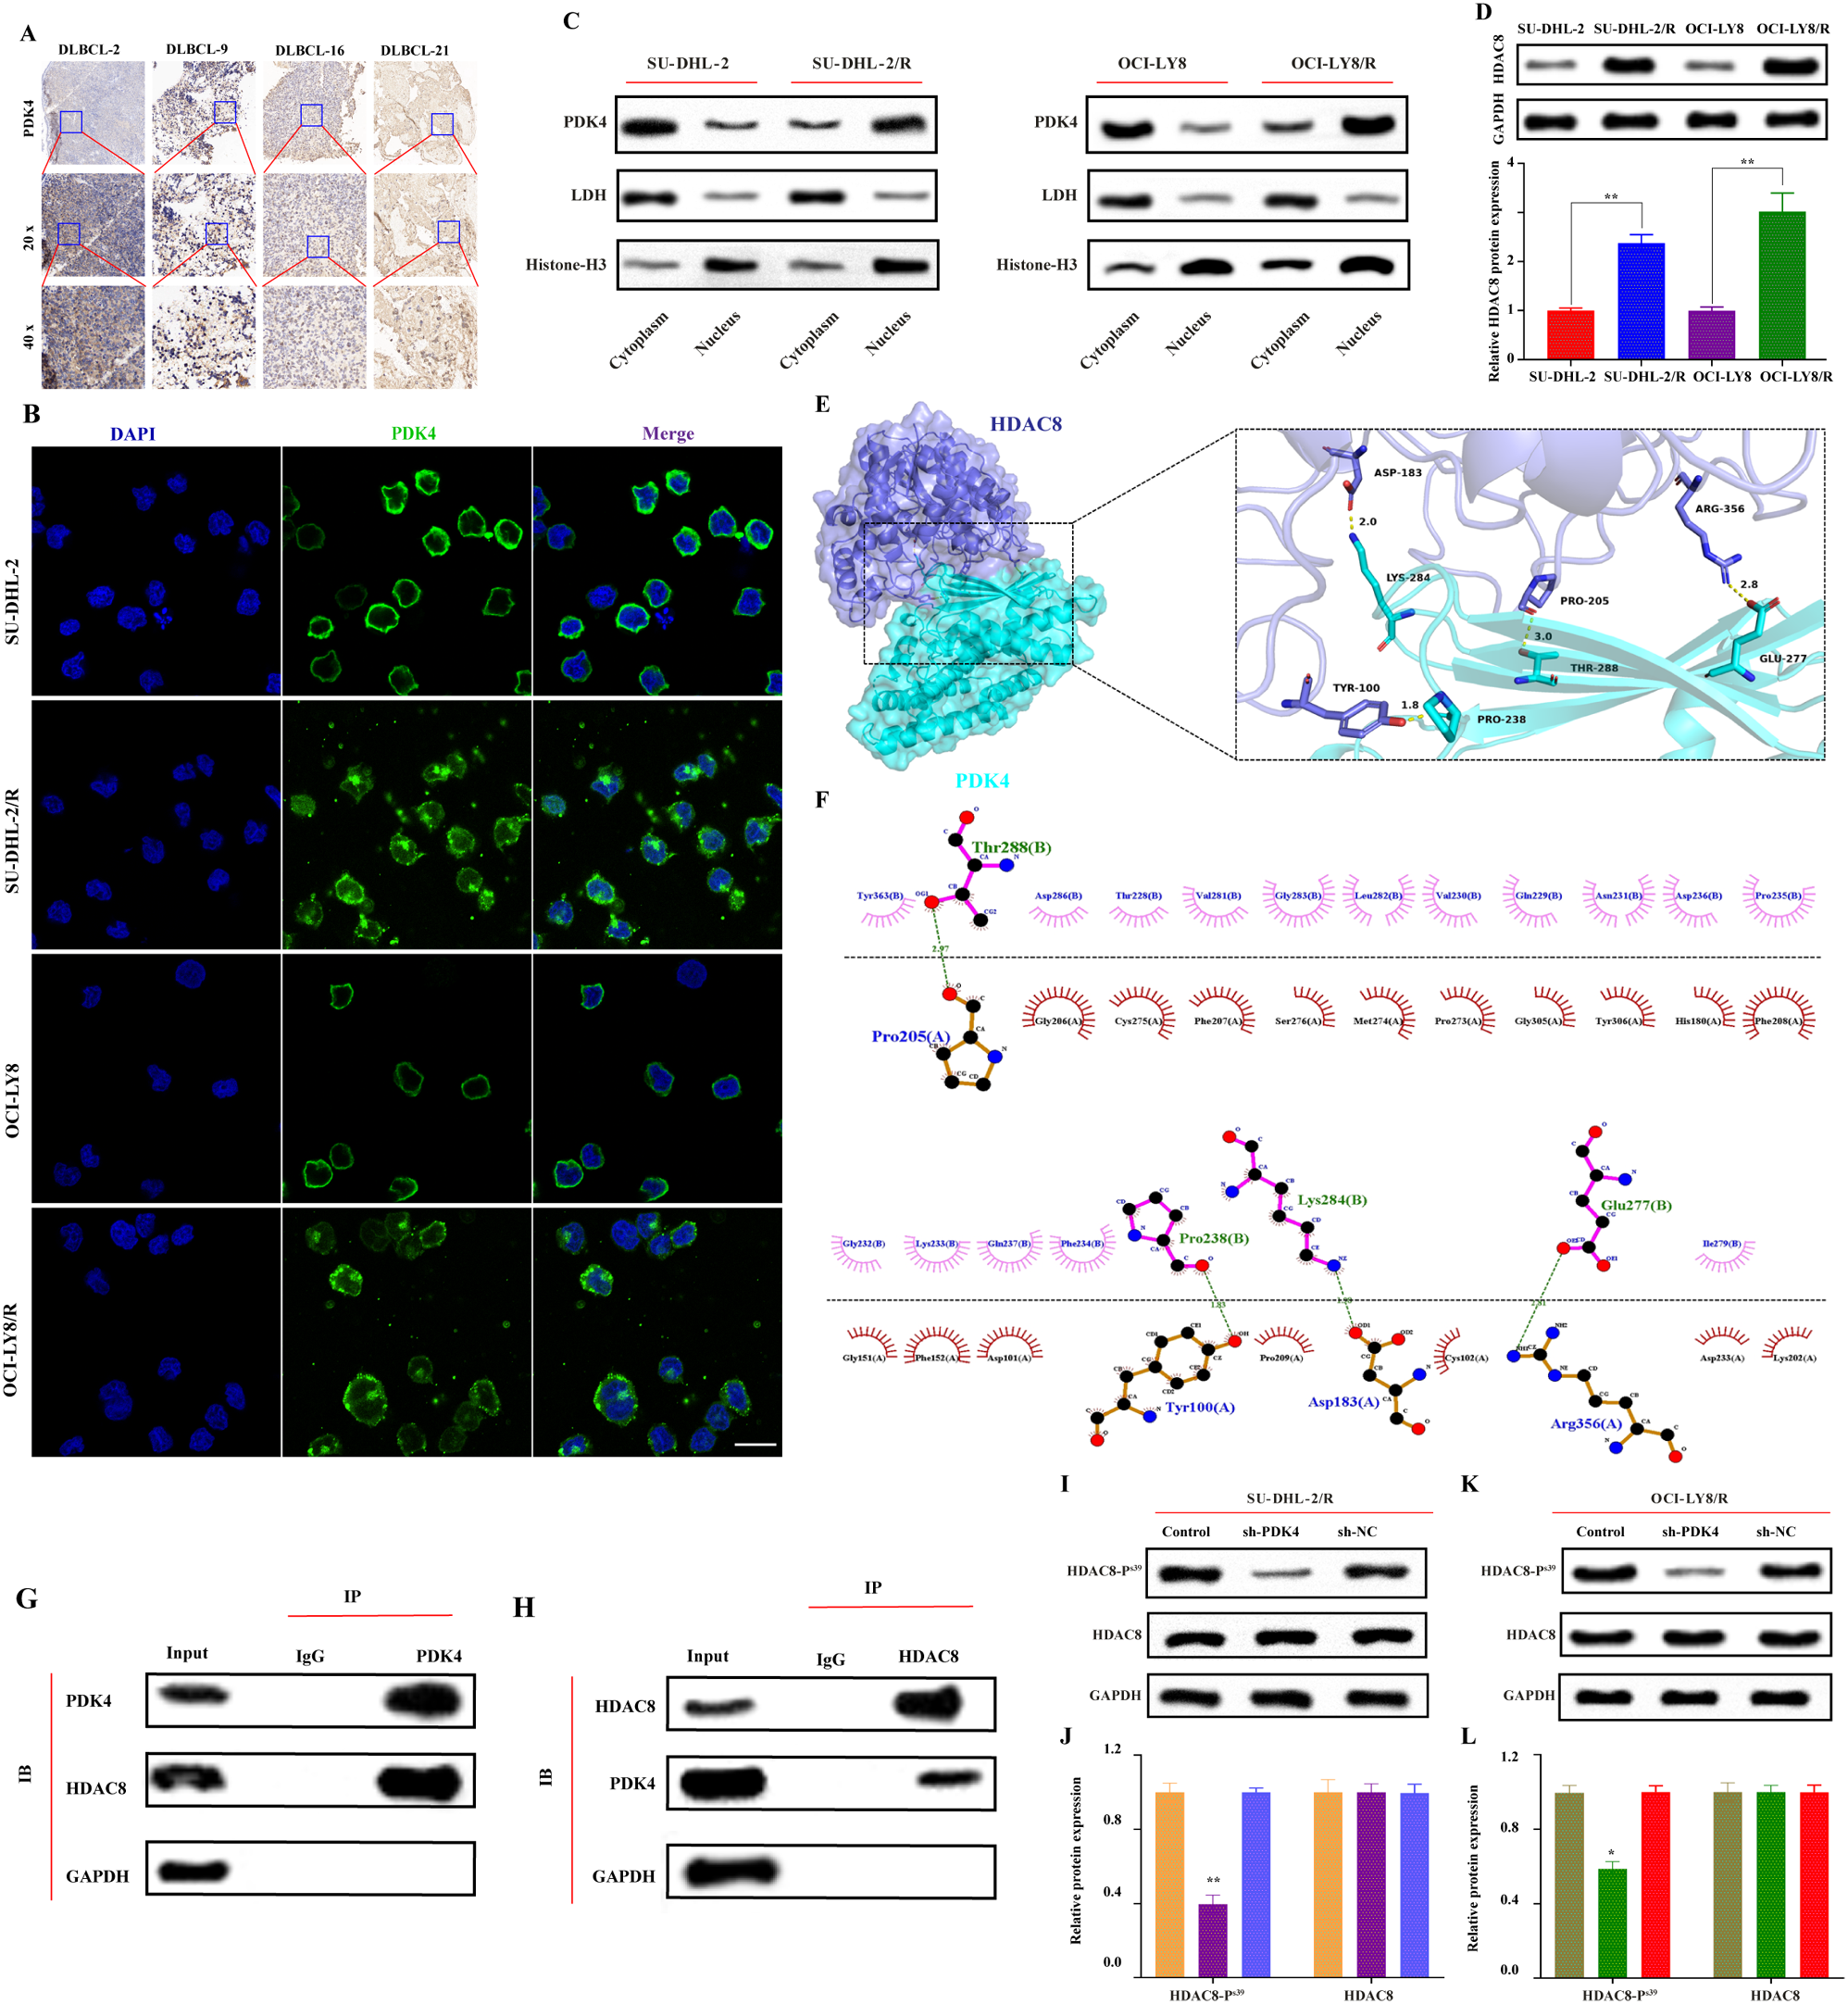


It has been found that in DLBCL, PDK4 mediates resistance to rituximab by inhibiting CD20 expression [8], yet the specific mechanism by which PDK4 regulates CD20 in DLBCL requires further investigation. Previous research has primarily focused on the role of PDK4 in the cytoplasm and mitochondria, but recent studies have revealed that PDK4 also plays a significant role in the cell nucleus. [31]. Investigating the cellular localization of PDK4 in DLBCL could further elucidate the mechanism by which PDK4 regulates CD20 expression. Initially, tumor tissues from DLBCL patients sensitive and resistant to rituximab chemotherapy were collected, and the expression and cellular localization of PDK4 in resistant tumor tissues were explored through immunohistochemistry. It was found that in resistant tumor tissues, PDK4 localization includes both the cytoplasm and the nucleus (Fig. 1A).
Fig. 1
(A) Immunohistochemistry validates the localization of PDK4 in DLBCL chemotherapy-sensitive and chemotherapy-resistant patient tissues (DLBCL-2 represents chemotherapy-sensitive patients, DLBCL-9, DLBCL-16, and DLBCL-21 represent chemotherapy-resistant patients); (B) Immunofluorescence demonstrates the cellular localization of PDK4 in DLBCL resistant cells and parent cells, where green fluorescence indicates the cellular localization of PDK4, and blue fluorescence indicates the nuclear localization of DAPI. The scale bar is 20 μm; (C) Cytoplasmic and nuclear fractionation, Western blot analysis of PDK4 expression and localization in sensitive and resistant cell lines, with LDH and Histone-H3 used as cytoplasmic and nuclear markers, respectively. (D) Western Blot analysis of HDAC8 protein expression levels and Statistical chart of bands by Image J software. **vs sh-NC: P < 0.01; (E) Analysis of the protein-protein interaction interface between HDAC8 and PDK4 based on structure. The image represents the predicted structure of the HDAC8-PDK4 complex, where interactive hot spot residues are marked. (F) Two-dimensional angle analysis and visualization of the interaction forces between HDAC8 and PDK4 proteins. The 205th Pro amino acid residue, the 100th Tyr amino acid residue, the 183rd Asp amino acid residue, and the 356th Arg amino acid residue of the HDAC8 protein can bind through hydrogen bonds with the 288th Thr amino acid residue, the 238th Pro amino acid residue, the 284th Lys amino acid residue, and the 277th Glu amino acid residue of the PDK4 protein, with lengths of 2.97Å, 1.83Å, 1.99Å, and 2.81Å, respectively; in the two-dimensional graph, green dashed lines represent hydrogen bonds. (G) In SU-DHL-2/R cells, PDK4 was immunoprecipitated using an anti-PDK4 antibody, and then HDAC8 was detected by a western blotting assay. The control immunoprecipitation was conducted with IgG. (H) In SU-DHL-2/R cells, HDAC8 was immunoprecipitated using an anti-HDAC8 antibody, and then PDK4 was detected by a western blotting assay. The control immunoprecipitation was conducted with IgG. (I, K) Western blot confirms that downregulation of PDK4 (sh-PDK4) can inhibit the phosphorylation of HDAC8 protein but does not affect the expression of HDAC8 protein, GAPDH is the internal reference for protein loading; (J, L) Statistical chart of bands by Image J software. *vs sh-NC or Control: P < 0.05; **vs sh-NC or Control: P < 0.01
Using immunofluorescence and WB nuclear-cytoplasmic fractionation techniques, we found that PDK4 is predominantly localized in the nucleus of resistant cells (SU-DHL-2/R, OCI-LY8/R) compared to sensitive cells (SU-DHL-2, OCI-LY8) (Fig. 1B-C). Therefore, the negative regulation of CD20 transcription, thereby promoting rituximab resistance, may be regulated by nuclear PDK4 protein.
To clarify the regulatory mechanism, lentiviral shRNA was used to knock down PDK4 in SU-DHL-2/R cells. Sh-PDK4 significantly reduced the mRNA and protein levels of PDK4 in SU-DHL-2/R and OCI-LY8-R cells (Supplementary Fig. 1A-B). Three groups of sh-PDK4 cells were randomly selected as the experimental group, with their corresponding three groups of sh-NC cells as the control group for RNA-seq sequencing analysis. Using |Fold change| > 2 and FDR < 0.05 as criteria for selection, 715 significantly upregulated genes were marked in red in the volcano plot, and 1145 downregulated considerably genes were marked in green (Supplementary Fig. 1C). KEGG enrichment analysis identified the top 20 biological processes different in drug-resistant cells, among which (Drug resistance: Antineoplastic) closely matches the research objectives of this project (Supplementary Fig. 1D). Drug sensitivity analysis suggests that high expression of PDK4 also upregulates the IC50 values of most drugs, leading to multidrug resistance (Supplementary Fig. 1E). Based on this biological function, the applicant screened for high and low expression genes (top 10, respectively) between the sh-PDK4 group and the sh-NC group for hierarchical clustering analysis, the results of which are displayed in the heatmap of Supplementary Fig. 1F. qRT-PCR was used to detect 20 significantly different genes in DLBCL drug-resistant cells (SU-DHL-2/R and OCI-LY8/R) between the sh-NC group and the sh-PDK4 group, showing that HDAC8 had the most significant difference in the two strains of drug-resistant cells in the sh-PDK4 group and its expression was significantly reduced (Supplementary Fig. 2A-B).
Western Blot analysis showed that the protein expression of HDAC8 in drug-resistant cells (SU-DHL-2/R and OCI-LY8/R) was significantly higher than that in sensitive cells (SU-DHL-2 and OCI-LY8) (Fig. 1D). Therefore, we believe that HDAC8 may play an important role in the process of PDK4-mediated rituximab resistance.To further clarify the interaction between HDAC8 and PDK4, we downloaded the three-dimensional protein structure files of HDAC8 and PDK4 from the Protein Data Bank. We performed three-dimensional and two-dimensional force analysis and visualization using AutoDockTools, ZDock, and PyMol software. In the three-dimensional images, HDAC8 is represented as a dark blue cartoon model, PDK4 as a cyan cartoon model, and their binding sites are shown as sticks of corresponding colors (Fig. 1E). In the two-dimensional images, several residues between HDAC8 and PDK4 form hydrogen bonds, such as the hydrogen bond formed between ASP183 of HDAC8 and LYS284 of PDK4. Under the influence of these interaction forces, the score of HDAC8-PDK4 is 1515.129 kcal/mol. Generally, the higher the binding energy between proteins, the more stable the binding. The above results suggest that HDAC8 may strongly interact with PDK4 (Fig. 1F). To further explore whether HDAC8 acts as a target of PDK4 in DLBCL, we first performed nuclear-cytoplasmic fractionation on sensitive cell lines and examined the binding of PDK4 and HDAC8 in both the nucleus and cytoplasm. The results showed that in sensitive cell lines, the expression level of PDK4 in the cytoplasm was significantly higher than in the nucleus. Moreover, the binding intensity of PDK4 and HDAC8 was significantly higher in the nucleus compared to the cytoplasm(Supplementary Fig. 2C-D). To further explore whether HDAC8 is a target of PDK4 in DLBCL, we observed a strong interaction between PDK4 and HDAC8 in SU-DHL-2/R cells through co-immunoprecipitation (Co-IP) experiments(Fig. 1G-H). In summary, this experiment indicates an interaction between PDK4 and HDAC8 proteins in DLBCL drug-resistant cells [32]; PDK4 is a protein kinase that can phosphorylate various target proteins. It has been found that the main phosphorylation site of HDAC8 is Ser-39 at the N-terminus. The applicant verified the protein expression by collecting proteins from the drug-resistant cell control group, PDK4 knockdown group, and knockdown control group using Western Blot. As shown in Fig. 1I-L, The expression of phosphorylated HDAC8 (p-HDAC8 Ser-39) protein was significantly downregulated in the PDK4 knockdown group, but there was no significant change in the expression of phosphorylated HDAC8 protein in the control group and the knockdown control group. In addition, there was no significant difference in the expression of HDAC8 protein between the groups.
PDK4 promotes rituximab resistance by inhibiting CD20 expression through phosphorylation and activating HDAC8’s deacetylation functionTo further explore whether HDAC8 mediates PDK4’s negative regulation of CD20, we first conducted molecular docking studies between HDAC8 and CD20. In the three-dimensional image, HDAC8 is represented as a dark blue cartoon model, and CD20 is displayed as a cyan cartoon model, with their binding points shown as sticks in corresponding colors (Fig. 2A). In the two-dimensional image, multiple residues between HDAC8 and CD20 form hydrogen bonds, such as the hydrogen bonds formed by TYR100 of HDAC8 and MET119 and SER123 of CD20. Under these interactions, the scoring of HDAC8-CD20 is 2200.938 kcal/mol. Generally, the higher the binding energy between proteins, the more stable the binding. The above results suggest that there may be a strong interaction between HDAC8 and CD20 (Fig. 2B). After separating the cytoplasm and nuclei of DLBCL-resistant cells, it was found that the knockdown of PDK4 could significantly downregulate the expression levels of nuclear PDK4 and phosphorylated HDAC8 but upregulate the cytoplasmic expression of CD20 (Fig. 2C), where Histone H3 was used as an internal reference for the nucleus. LDH was the internal reference for the cytoplasm. Our experimental results found that PDK4 could phosphorylate the Ser-39 site of nuclear HDAC8, but since HDAC8 is mainly localized in the nucleus, the leading promoter of HDAC8 phosphorylation is likely nuclear PDK4. Studies have shown that the HDAC family can regulate the transcription of CD20, but whether HDAC8 regulated by PDK4 phosphorylation can effectively regulate the expression of CD20 in DLBCL cells requires further investigation. To further explore whether HDAC8 can effectively regulate CD20, we observed a strong interaction between HDAC8 and CD20 in SU-DHL-2/R cells through co-immunoprecipitation (Co-IP) experiments (Fig. 2D-E). In summary, this experiment demonstrates that in DLBCL-resistant cells, there is an interaction between HDAC8 and CD20 proteins. Based on the results, PDK4, during the process of resistance to rituximab in DLBCL, could transcriptionally suppress the expression of CD20 by phosphorylating HDAC8, and there is an interaction between HDAC8 and CD20. However, the regulatory role of HDAC8 on CD20 warrants further investigation. To this end, we treated the drug-resistant cell lines SU-DHL-2/R and OCI-LY8/R with different concentrations of PCI-34,051 to determine the optimal concentration. This concentration should effectively inhibit the deacetylase activity of HDAC8 without affecting its expression levels (Supplementary Fig. 2E-F). At the selected optimal concentration, PCI-34,051 was applied to the resistant cells SU-DHL-2/R and OCI-LY8/R for 24 h, with DMSO used as a control. After treatment, we collected cell proteins and assessed the protein expression levels of HDAC8, acetylated histone H3 (Ac-Histone H3), histone H3, and CD20 using Western Blot analysis. As shown in Fig. 2F, PCI-34,051 could effectively inhibit the deacetylase activity of HDAC8 and upregulate the expression of CD20 protein. The results prove that HDAC8 plays a role in suppressing CD20 expression through its deacetylase activity. To verify that the suppression of CD20 expression by HDAC8, thereby mediating resistance to rituximab, is regulated by PDK4, the resistant cells of both the PDK4 knockdown and control knockdown groups were treated with the HDAC8 specific inhibitor PCI-34,051 for 24 h. CCK-8 assay revealed that the downregulation of PDK4 reverses rituximab resistance, but the knockdown control group was relatively insensitive to the reversal of rituximab resistance. The HDAC8 inhibitor PCI-34,051 significantly improved the reversal of rituximab resistance in the knockdown control group. Still, the effect of PCI-34,051 on reversing rituximab resistance in the PDK4 knockdown group did not show a significant enhancement (Fig. 2G-H). In conclusion, nuclear PDK4 activates HDAC8 by phosphorylating the Ser-39 site of HDAC8, thereby deacetylating and suppressing the expression of CD20 protein (Fig. 2I). Therefore, downregulating PDK4 can effectively promote the expression of CD20 and enhance the effect of rituximab, offering new strategies and methods for the clinical treatment of DLBCL patients with negative or low expression of CD20.
Fig. 2
(A) Analysis of the protein-protein interaction interface between HDAC8 and CD20 based on structure. The image represents the predicted structure of the HDAC8-CD20 complex, where interactive hot spot residues are marked. (B) Two-dimensional angle analysis and visualization of the interaction forces between HDAC8 and CD20 proteins. The 100th Tyr amino acid residue of HDAC8 protein can bind through hydrogen bonds with the 119th Met and the 123rd Ser amino acid residues of the CD20 protein, with lengths of 2.48Å and 3.16Å, respectively; the 338th Thr amino acid residue of HDAC8 can bind through a hydrogen bond with the 140th Asn amino acid residue of CD20 protein, with a length of 3.54Å; in the two-dimensional graph, green dashed lines represent hydrogen bonds. (C) Nuclear-cytoplasmic separation, Western blot detects the expression and localization of PDK4, p-HDAC8, and CD20 after downregulation of PDK4, where LDH and Histone-H3 are used as cytoplasmic and nuclear internal references, respectively (D) In SU-DHL-2/R cells, HDAC8 was immunoprecipitated using an anti-HDAC8 antibody, then CD20 was detected by a western blotting assay. The control immunoprecipitation was conducted with IgG. (E) In SU-DHL-2/R cells, CD20 was immunoprecipitated using an anti-CD20 antibody, and then HDAC8 was detected by a western blotting assay. The control immunoprecipitation was conducted with IgG. (F) Western blot confirms that the HDAC8 specific inhibitor PCI-34,051 can inhibit the deacetylase activity of HDAC8 and upregulate the expression of CD20 protein; (G-H) CCK-8 assay verifies that downregulation of PDK4 reverses rituximab resistance, but the HDAC8 inhibitor PCI-34,051 does not further enhance the reversal of rituximab resistance by downregulating PDK4. **vs. sh-NC: P < 0.01; *vs. sh-NC: P < 0.05; (I) A model diagram of the mechanism by which PDK4 downregulates CD20 expression and leads to rituximab resistance by phosphorylating HDAC8, promoting the deacetylation of CD20
Preparation and characterization of aCD20@ExoCTX/siPDK4 nanoparticlesBased on the full bone marrow adherent method, bone marrow mesenchymal stem cells (BMSCs) are improved and isolated for culture. The cells adhere in a spindle shape, resembling fibroblasts, and increase in a radial and swirling pattern, arranged orderly (Fig. 3B). Flow cytometry detects the lineage markers of the third-generation BMSCs: positive for CD73, CD90, and CD105, and negative for hematopoietic and endothelial markers (CD34, CD11b, CD19, CD45), and HLA-DR is negative (Fig. 3C). To analyze the optimal working concentration of cyclophosphamide without affecting the vitality of bone marrow mesenchymal stem cells in our study, BMSCs were co-incubated with CTX at concentrations of 0 µmol/L, 75 µmol/L, 125 µmol/L, 250 µmol/L, 500 µmol/L, and 1000 µmol/L for 24 h, and cell vitality was assessed using the CCK-8 assay. The results (Supplementary Fig. 3) show that compared to the control group, a slight decrease in cell survival rate (> 90%) occurs when BMSCs are treated with 500 µmol/L cyclophosphamide, but a significant reduction in cell survival rate is observed when the concentration of cyclophosphamide reaches 1000 µmol/L. Additionally, pre-treatment of bone marrow mesenchymal stem cells with cyclophosphamide, followed by extraction of exosomes, does not affect the internalization rate of exosomes into SU-DHL-2/R cells (Supplementary Fig. 4). Therefore, in this study, exosomes were extracted after pretreating the bone marrow mesenchymal stem cells (BMSCs) with 500 µmol/L cyclophosphamide for 24 h in all experiments. Observation under an inverted fluorescence microscope revealed no apparent abnormal morphology in BMSCs after CTX pretreatment (Fig. 3D), further indicating the low sensitivity of BMSCs to cyclophosphamide. Flow cytometry results showed that CTX does not affect the stemness characteristics of BMSCs (Fig. 3E). After the successful isolation of exosomes, their morphology was identified and analyzed using transmission electron microscopy (TEM) (Fig. 3F and H) for exosomes secreted by normally cultured bone marrow mesenchymal stem cells (Exo) and those pretreated with cyclophosphamide (CTX) (ExoCTX). According to electron microscopy analysis, both types of exosomes were round or elliptical, vesicle-enclosed structures, with no significant morphological differences observed between the two groups. The team used the iZON qNano nanoparticle analysis system to measure the exosomes secreted by normally cultured BMSCs (Exo) and those pretreated with CTX (ExoCTX). The results (Fig. 3G and I) showed that the diameter of the exosomes primarily ranged from 80 to 170 nm, with an average diameter of about 120 nm. The concentration of exosomes in the samples was approximately 6.19 × 10^8 particles/ml, as analyzed by qNano. Western Blot was used to detect the markers of surface proteins on Exo and ExoCTX; the proteins CD81, CD63, and TSG101 were highly expressed in both groups of exosomes, and the protein Calnexin was almost absent (Fig. 3J). Thus, it can be seen that the applicant successfully isolated and extracted the required exosomes secreted by BMSCs pretreated with CTX. Through WB and qPCR, the superior anti-PDK4 ability of SiPDK4 was validated (Supplementary Fig. 5A-B).The binding efficiency of exosomes and siRNA is a prerequisite for effective siRNA delivery. We used agarose gel electrophoresis to determine the loading rate of PDK4 siRNA in Exo, as shown in Supplementary Fig. 5C, indicating that the ExoCTX/siRNA nanoparticle complex was completely formed when the mass ratio of siRNA to exosomes was 4:1; under the conditions of a pulse time of 2 s, 400 V, and 125 µF, the loading rate of PDK4 siRNA in exosomes was approximately 31.71 ± 2.36%. The results suggest that exosomes have potential application value in delivering siRNA. To test the stability/anti-degradation capability of ExoCTX/siPDK4, we co-incubated ExoCTX/siPDK4 with RNase A (simulating the bodily fluid environment), with naked siPDK4 as the control group for 45 min. qRT-PCR results showed that the content of siPDK4 in ExoCTX/siPDK4 was significantly higher than that in naked siPDK4. After 45 min of treatment with RNase A, the ExoCTX/siPDK4 group retained 76.9 ± 9.48% of siPDK4 residues, while the naked siPDK4 group had 42.1 ± 6.32%. This indicates that exosomes, as natural carriers of siRNA, show good encapsulation ability and effectively prevent the degradation of siRNA in bodily fluids (Supplementary Fig. 5D). Further, we measured the transfection efficiency of ExoCTX/siPDK4 using flow cytometry. SU-DHL-2/R and OCI-LY8/R cells were cultured for 24 h, then incubated with ExoCTX/siPDK4 (100 nmol/L) for another 24 h before being collected by centrifugation at 1,000 g for 10 min. As shown in Supplementary Fig. 6, compared to the naked siPDK4 control group, 24 h after transfection, the transfection efficiency of ExoCTX/siPDK4 in SU-DHL-2/R and OCI-LY8/R cells was 82.1 ± 10.3% and 77.5 ± 8.6%, respectively, significantly higher than that of the naked siPDK4 group (p < 0.001).As shown in Supplementary Fig. 7, nuclear magnetic resonance (NMR), mass spectrometry results, and non-denaturing protein electrophoresis indicate that DSPE-Hyd-PEG2000-NHS and rituximab (RTX) were successfully coupled; the compound (named aCD20) formed by coupling RTX with NHS-Hyd-PEG2000-DSPE was then mixed with the exosome nanoparticles ExoCTX/siPDK4 in a 1:100 ratio in PBS, and gently rotated overnight at 4 °C. A novel exosomal nanoparticle drug, RTX-NHS-Hyd-PEG2000-DSPE @ExoCTX/siPDK4, was formed through dialysis and ultracentrifugation. The morphology of the exosomal nanoparticle drug aCD20@ExoCTX/siPDK4 shown in Fig. 3K-L did not exhibit significant differences from Exo and ExoCTX, with its particle size slightly increased to about 125 nm. Figure 3M study results indicate a zeta potential of -16 mV, suggesting that the negatively charged nanoparticles of aCD20@ExoCTX/siPDK4 can induce electrostatic repulsion, which ensures the physical stability of nanoparticles during storage and prevents the formation of aggregate [33]. Furthermore, nanoparticles carrying a negative charge often exhibit increased plasma circulation time [34, 35]. The average particle size of aCD20@ExoCTX/siPDK4 exosomal nanoparticle drug remained at 130 ± 5.0 nm with a polydispersity index (PDI) of 0.18 ± 0.03 and a zeta potential of -16 ± 1.2 mV over six days. Thus, the particle size, zeta potential, and dispersion index (PDI) of aCD20@ExoCTX/siPDK4 did not show significant changes, and additional research indicates that a PDI value below 0.2 signifies a uniform distribution and homogeneity of nanoparticles [36]. This further indicates the stability of aCD20@ExoCTX/siPDK4 over six days. Figure 3N depicted exosomes “re-educated” with cyclophosphamide (ExoCTX) did not show absorption bands in the near-infrared region. In contrast, Rituximab, DSPE-Hyd-PEG2000-NHS-Rituximab, DSPE-Hyd-PEG2000-NHS-Rituximab-Cy5 (as demonstrated in Supplementary Fig. 8, with an excitation wavelength of 666 nm and optimal excitation at 640 nm, where the fluorescence spectrum of Cy5 was detected, indicating successful modification of Cy5 on DSPE-Hyd-PEG2000-NHS-Rituximab), and DSPE-Hyd-PEG2000-NHS-Rituximab-Cy5@ExoCTX displayed broad absorption bands in the near-infrared region. This difference in transverse and longitudinal resonance wavelengths between the DSPE-Hyd-PEG2000-NHS-Rituximab-Cy5@ExoCTX exosome complex and unmodified ExoCTX confirmed the interaction between ExoCTX and DSPE-Hyd-PEG2000-NHS-Rituximab-Cy5. Furthermore, the UV-visible spectra of DSPE-Hyd-PEG2000-NHS-Rituximab, DSPE-Hyd-PEG2000-NHS-Rituximab-Cy5, and DSPE-Hyd-PEG2000-NHS-Rituximab-Cy5@ExoCTX showed the characteristic absorption peak of Rituximab at 275 nm, while DSPE-Hyd-PEG2000-NHS did not exhibit a significant peak, indicating that DSPE-Hyd-PEG2000-NHS-Rituximab was successfully modified on ExoCTX. The Fourier-transform infrared spectroscopy (FTIR) revealed vibrations at 2930 cm − 1, 1532 cm − 1, 1230 cm − 1, 946 cm − 1, and 833 cm − 1 attributed to –CH– vibrations; 3520 cm − 1 and 1639 cm − 1 attributed to N–H vibrations; 3300 cm − 1 attributed to O–H vibrations; 2359 cm − 1 attributed to S–H vibrations; 1449 cm − 1 attributed to –CH2– vibrations; and 1069 cm − 1 attributed to C–O vibrations. Absorption bands in the functional group region above 1500 cm − 1 have a clear correspondence between functional groups and frequencies, with sparse and easily identifiable bands; the region below 1500 cm − 1, known as the fingerprint region, features a series of absorptions characteristic of the molecule generated by its overall weak vibrations (Fig. 3O). These results further indicate that DSPE-Hyd-PEG2000-NHS-Rituximab was successfully modified on ExoCTX, and the newly synthesized exosomal nanoparticle complex is named aCD20@ExoCTX/siPDK4.
Fig. 3
(A) Schematic diagram of the synthesis of aCD20@ExoCTX/siPDK4 nanoparticles. (B) Typical cellular morphology of BMSCs; (C) Flow cytometry analysis of BMSC lineage biomarkers, identifying specific surface markers that confirm the mesenchymal stem cell identity; (D) Typical cell morphology after cyclophosphamide (CTX) pretreatment of BMSCs; (E) Flow cytometry analysis of lineage biomarkers in CTX-pretreated BMSCs; (F) Morphology of mesenchymal stem cell-derived exosomes (Exo) observed under transmission electron microscopy (TEM), showing the typical vesicle-enclosed structures; scale bar: 100 nm. (G) Particle size range and concentration of Exo; (H) Morphology of exosomes extracted from CTX-pretreated BMSCs (ExoCTX) under TEM, maintaining the characteristic exosome appearance; scale bar: 100 nm; (I) Particle size range and concentration of ExoCTX; (J) Western blot analysis of surface markers on both types of exosomes; (K) TEM analysis of the morphology of the aCD20@ExoCTX/siPDK4 exosomal nanoparticle drug; (L) Particle size of aCD20@ExoCTX/siPDK4 exosomal nanoparticle drug; (M) Dynamic light scattering analysis of aCD20@ExoCTX/siPDK4 over six days, measuring hydrodynamic diameter (HD), zeta potential, and polydispersity index (PDI), providing insights into the stability and dispersion of the nanoparticles in solution. (N) UV–vis spectra of the ExoCTX/siPDK4, Rituximab, DSPE-Hyd-PEG2000-NHS, DSPE-Hyd-PEG2000-NHS-Rituximab, DSPE-Hyd-PEG2000-NHS-Rituximab-Cy5, andDSPE-Hyd-PEG2000-NHS-Rituximab-Cy5@ExoCTX/siPDK4(aCD20@ExoCTX/siPDK4).The inset shows the magnified UV–vis spectra from 200 to 800 nm. (O) Fourier-transform infrared spectroscopy (FTIR) analysis of the ExoCTX/siPDK4, Rituximab, DSPE-Hyd-PEG2000-NHS, DSPE-Hyd-PEG2000-NHS-Rituximab, DSPE-Hyd-PEG2000-NHS-Rituximab-Cy5, andDSPE-Hyd-PEG2000-NHS-Rituximab-Cy5@ExoCTX/siPDK4(aCD20@ExoCTX/siPDK4)
The in vitro release characteristics, blood compatibility, and cellular uptake of aCD20@ExoCTX/siPDK4 nanoparticlesTo investigate the in vitro release properties of the nanoparticle aCD20@ExoCTX/siPDK4, the nanoparticles were suspended in PBS at pH 7.4 (representing the pH conditions of blood or normal organs) or pH 6.5 (mimicking the extracellular microenvironment of tumor cells), and the dissociation process is shown in Supplementary Fig. 9A. The suspensions were incubated at 37 °C in a constant temperature shaker at 100 rpm, and supernatants were collected every 24 h. The BCA method detected the release of antibodies, and the release rate of nanoparticles under different pH conditions was calculated. The results showed (Supplementary Fig. 9B) that the release rate within 72 h was 21.2 ± 1.8% under neutral conditions at pH 7.4 and 90.3 ± 2.8% under acidic conditions at pH 6.5, indicating that nanoparticles could effectively release antibodies under acidic conditions to exert their functions. Given that the nanoparticles are intended for intravenous injection to function inside the body, various concentrations of nanoparticles were co-incubated with mouse erythrocytes at 37 °C. The absorbance of supernatants at 540 nm was measured with a microplate reader to calculate the hemolysis rate of erythrocytes. The experimental results demonstrated that nanoparticles at different concentrations exhibited good blood compatibility, with a hemolysis rate below 5% for all concentrations tested (Supplementary Fig. 10A). Subsequently, the protein adsorption capacity of the nanoparticles was tested, revealing that under both pH 6.5 and pH 7.4 conditions, all nanoparticles showed minimal protein adsorption, indicating good stability of the nanoparticles (Supplementary Fig. 10B). Cytotoxicity assays (Supplementary Fig. 10C) revealed that even at a high dosage (2 mg/mL), all formulations had virtually no effect on the viability of normal B cells. These results suggest that the nanoparticles possess good blood compatibility, stability, and safety, laying an experimental foundation for the in vivo application of the nanoparticles. DLBCL is classified into two main types: Germinal Center B-cell-like (GCB type) and Activated B-cell-like (ABC type). Compared to the GCB subtype, the ABC subtype exhibits more resistance to the existing standard treatment regimen based on rituximab [37]. Therefore, we selected the ABC subtype cell line SU-DHL-2 and the rituximab-resistant cell line SU-DHL-2/R for subsequent experiments. To explore the cellular uptake of nanoparticles, we first examined the relationship between nanoparticle cellular uptake and nanoparticle dosage. Different concentrations of aCD20@ExoCTX/siPDK4 (labeled with PKH67) were co-incubated with SU-DHL-2 or SU-DHL-2/R cells. One hour later, the fluorescence intensity of the exosome nanoparticle complexes entering the cells was observed under a laser confocal microscope. As the concentration of aCD20@ExoCTX/siPDK4 increased, the fluorescence intensity in the tumor cells gradually increased, reaching its maximum when the cells were co-cultured with 2 µg/ml of aCD20@ExoCTX/siPDK4 nanoparticles (Fig. 4A-B), and the same trend was confirmed by flow cytometry analysis (Fig. 4C). Subsequently, the same concentration of aCD20@ExoCTX/siPDK4 nanoparticles was co-incubated with SU-DHL-2 or SU-DHL-2/R cells for different periods, and the fluorescence intensity was observed under a laser confocal microscope. The results showed that cellular uptake of nanoparticles increased over time, with significant cellular uptake occurring as early as 0.5 h of co-incubation. After 1 h, cellular uptake reached a stable state with no significant changes (Fig. 4E-F). The fluorescence intensity within the cells was measured by flow cytometry, which was consistent with the results shown by the confocal microscope images indicating the fluorescence signal intensity (Fig. 4G).
Fig. 4
(A-B) CLSM images of SU-DHL-2 or SU-DHL-2/R cells after incubation with increasing PKH67-labeled aCD20@ExoCTX/siPDK4 concentrations. Scale bar: 20 μm. (C) FCM analysis of intercellular uptake of aCD20@ExoCTX/siPDK4 NPs in SU-DHL-2 and SU-DHL-2/R cells at various doses. (E-F) Fluorescence images and (G) FCM analysis of intercellular uptake of aCD20@ExoCTX/siPDK4 NPs in SU-DHL-2 and SU-DHL-2/R cells at different times. Scale bar: 20 μm
Validation of the antitumor effect and mechanism of aCD20@ExoCTX/siPDK4 nanoparticles in reversing drug resistance in vitro.
To verify the in vitro reversal of drug resistance and antitumor effects of aCD20@ExoCTX/siPDK4 nanoparticles, we first examined their impact on the proliferation of SU-DHL-2 and SU-DHL-2/R cells using the CCK-8 assay and live/dead cell staining assay. The CCK-8 assay results showed that the proliferation of SU-DHL-2 and SU-DHL-2/R cells was significantly inhibited in the aCD20@ExoCTX/siPDK4 treatment group, with a marked statistical difference compared to other control groups (Fig. 5A-B). This demonstrates the specific cytotoxic effect of aCD20@ExoCTX/siPDK4 on drug-resistant SU-DHL-2/R cells. To visually confirm the cytotoxicity of aCD20@ExoCTX/siPDK4 nanoparticles, the study further employed the Calcein-AM/PI double staining method to detect cell viability. Following 24 h of co-incubation with PBS, RTX, RTX + siPDK4, aCD20@Exo/siPDK4, and aCD20@ExoCTX/siPDK4, fluorescence staining was performed to identify live cells (Calcein-AM, green) and dead cells (PI, red). As shown in Fig. 5C, the aCD20@ExoCTX/siPDK4 treatment group displayed clear red fluorescence in SU-DHL-2 and SU-DHL-2/R cells (with the largest area), indicating that cell viability was impaired by the nanoparticles, leading to a significant difference in cell viability compared to other groups. These experiments indicate that aCD20@ExoCTX/siPDK4 nanoparticles can effectively inhibit the proliferation of DLBCL cells. After 24 h of co-incubation of SU-DHL-2 and SU-DHL-2/R cells with different treatments, apoptosis was detected using flow cytometry. The results showed that the proportion of apoptotic cells was significantly increased in the aCD20@ExoCTX/siPDK4 treatment group compared to other control groups, indicating that early apoptosis in drug-resistant SU-DHL-2/R cells can be induced, further demonstrating the reversal of drug resistance (Fig. 5D and Supplementary Fig. 11A-B). Many biological events during the process of cell apoptosis are closely related to mitochondria, including the release of caspase activators and changes in the electron transport chain. Western blot results indicated that in SU-DHL-2 and SU-DHL-2/R cells treated with aCD20@ExoCTX/siPDK4 exosome nanoparticle complexes, the expression of Bcl-2 protein, which plays a vital role in the development of tumors, drug resistance, and apoptosis signaling, was significantly lower compared to other control groups. Additionally, clear cleavage bands of caspase-3 and PARP were observed (Fig. 5E and Supplementary Fig. 12A-B). These experimental results suggest that aCD20@ExoCTX/siPDK4 treatment can effectively induce apoptosis in DLBCL cells and reverse their drug resistance. Previous studies have shown that PDK4 activates HDAC8 by phosphorylating the Ser-39 site of HDAC8, leading to the deacetylation and suppression of CD20 expression. Therefore, after co-incubating SU-DHL-2 or SU-DHL-2/R cells with different treatments for 24 h, Western blot results also showed that in the drug-resistant cells treated with aCD20@ExoCTX/siPDK4 nanoparticles, the expression of PDK4 and phosphorylated HDAC8 was significantly inhibited, thereby further promoting the high expression of CD20 (Fig. 5F and Supplementary Fig. 12A-B). Hence, aCD20@ExoCTX/siPDK4 nanoparticles can effectively promote the expression of CD20 by inhibiting the PDK4/HDAC8/CD20 signaling axis and downregulating PDK4, thereby sensitizing the effect of rituximab. This provides a new strategy and theoretical basis for treating DLBCL patients resistant to therapy.
Fig. 5
(A-B) After co-incubation for 24 h with PBS, RTX, RTX + siPDK4, aCD20@Exo/siPDK4, and aCD20@ExoCTX/siPDK4, the cytotoxicity towards SU-DHL-2 and SU-DHL-2/R cells was determined using a CCK-8 assay kit; (C) Fluorescent images of SU-DHL-2 and SU-DHL-2/R cells after 24 h co-incubation with PBS, RTX, RTX + siPDK4, aCD20@Exo/siPDK4, and aCD20@ExoCTX/siPDK4. Green: Calcein-AM; Red: PI. Scale bar: 20 μm; (D) The apoptosis rate of SU-DHL-2 and SU-DHL-2/R was detected by FCM. (E-F) The expression of Bcl-2, cleaved PARP, cleaved caspase-3, PDK4, HDAC8, p-HDAC8, and CD20 were assessed by western blot assay. Data are presented as means ± SD. *p < 0.05, **p < 0.01, ***p < 0.001. (Different groups are represented by a: PBS; b: RTX; c: RTX + siPDK4; d: aCD20@Exo/siPDK4; e: aCD20@ExoCTX/siPDK4)
Single-cell resolution overview of the DLBCL immune microenvironment and detection of aCD20@ExoCTX/siPDK4-induced in vitro ICD formation and immune cell activationThis study utilized publicly available single-cell transcriptome databases (GSE182434, heiDATA-VRJUNV, GSE252455, and GSE252608) to explore cell types and molecular characteristics in DLBCL. We first excluded cells with high mitochondrial gene expression, then applied highly variable genes (HVGs) and principal component analysis (PCA) for dimensionality reduction and clustering analysis while also examining the impact of cell cycle genes on cell classification (Supplementary Fig. 13A-C), and assessing the association between mitochondrial-related genes, cell counts (ncount), and features (nfeature) (Supplementary Fig. 13D-E). We further detailed each patient’s nfeature, ncount, and mitochondrial gene proportion (Supplementary Fig. 13F-H). After quality control and batch effect correction, 53,916 valid cells were obtained. Furthermore, we demonstrated the impact of different clustering resolutions on cell grouping through dendrogram analysis (Supplementary Fig. 13I). We showcased the uniform distribution of cells in two-dimensional space after batch effect removal through t-SNE (Supplementary Fig. 13J). By integrating and analyzing marker genes from published literature, we successfully identified seven significant immune cell populations, including B cells, CD8+ T, CD4+ T, Treg, Momo.macro, NK, and Plasma cells, and further analyzed the differentially expressed genes and their functions in the seven major cell types in DLBCL (Fig. 6A and Supplementary Fig. 14A-B). To further distinguish malignant B cells from normal B cells, we performed inferCNV analysis and successfully identified 12,689 malignant B cells (Supplementary Fig. 14C-D). We found that the level of CNV and the expression of PDK4 were significantly higher in malignant B cells compared to normal B cells (Supplementary Fig. 14E-F). To explore the distribution of PDK4 among tumor cell clusters, we further extracted malignant B cells for dimensionality reduction and clustering (Supplementary Fig. 14G). Interestingly, we found that the Malignant2 subgroup with high PDK4 expression was mainly enriched in the ABC subtype, which has a poorer prognosis, and exhibited the highest CNV levels. This further suggests the critical role of PDK4 in DLBCL (Supplementary Fig. 14H-L). We explored the relationship between the PDK4 gene and cell composition in the DLBCL-TME by combining bulk-seq and scRNA-seq analyses. We discovered that the TME of DLBCL is predominantly composed of B cells, showing significant heterogeneity in immune infiltration. This is consistent with previous studies [37,38,40]. Patients with high expression of CD8 + T cells present a better prognosis (Supplementary Fig. 15A-C).Interestingly, our data revealed that PDK4 is associated with most cell types in the TME(Supplementary Fig. 15D),especially highly expressed in Treg cells(Fig. 6B, Supplementary Fig.
留言 (0)