
記住我


A total of 195 patients who underwent treatment for metastatic colorectal cancer between 12th of November 2014 and 12th of December 2018 were included in the study (hereafter referred to as the discovery cohort). All patients had samples collected at inclusion and 189 patients had samples collected both at inclusion and at two months (median 63 days) evaluation. In total, 384 samples underwent small RNA-sequencing. All patients underwent chemotherapy as first-line treatment, except for two patients who received immunotherapy. Irinotecan-based regimens were most common, administered to 65% of the patients, followed by oxaliplatin-based regimens (15%), 5-fluorouracil (5-FU) (12%) monotherapy, a combination of irinotecan and oxaliplatin (6%), and immunotherapy (2 patients) (Supplementary Fig. 1A). Thirteen patients were classified as MSI, and the treatment types were generally similar for MSS and MSI patients, except for two MSI patient who received immunotherapy (Supplementary Fig. 1B). The clinical characteristics for the cohorts are described in supplementary Table 1. In addition to the aforementioned discovery cohort, the miRNA-related survival associations were validated in an independent validation cohort of 20 metastatic CRC patients [10].
Clinical variables associated with overall survivalTo investigate clinical variables with prognostic impact in metastatic CRC (mCRC) we performed Cox Proportional-Hazards (coxph) overall survival analysis of the main clinical variables at diagnosis. Performance status was the most significant clinical factor associated with overall survival, followed by CRP and CEA, of which high levels were associated with reduced overall survival (Supplementary Fig. 1C). Patients with wild type BRAF had improved survival compared to patients with mutated BRAF (Supplementary Fig. 1). The CRP/CEA to albumin (Alb) ratios has previously been investigates as an alternative marker than CRP/CEA alone. We therefore tested both (CRP/Alb) and (CEA/Alb) in our cohort and found slightly more significant associations for the combined markers than CRP or CEA alone (Supplementary Fig. 1C). Low level of albumin alone was associated with overall survival, although not significant at the 0.05 statistical threshold (P = 0.07). The study population was divided into five treatment categories and the overall survival probability differed depending on treatment type. Specifically, focusing on the three main treatment types, patients receiving oxaliplatin-based regimens had the longest median survival (1108 days), followed by patients receiving irinotecan-based regimens (636 days) and patients receiving 5-FU monotherapy (462 days) (Supplementary Fig. 1D). The variations in survival among treatment types may not solely reflect the efficacy of the treatments themselves, but rather the biology of the underlying disease and patient situation. Patients with advanced, unresectable disease tended to receive irinotecan-based treatment, while those with less advanced or resectable disease typically received oxaliplatin-based treatment. 5-FU monotherapy was often administered to elderly or less fit patients.
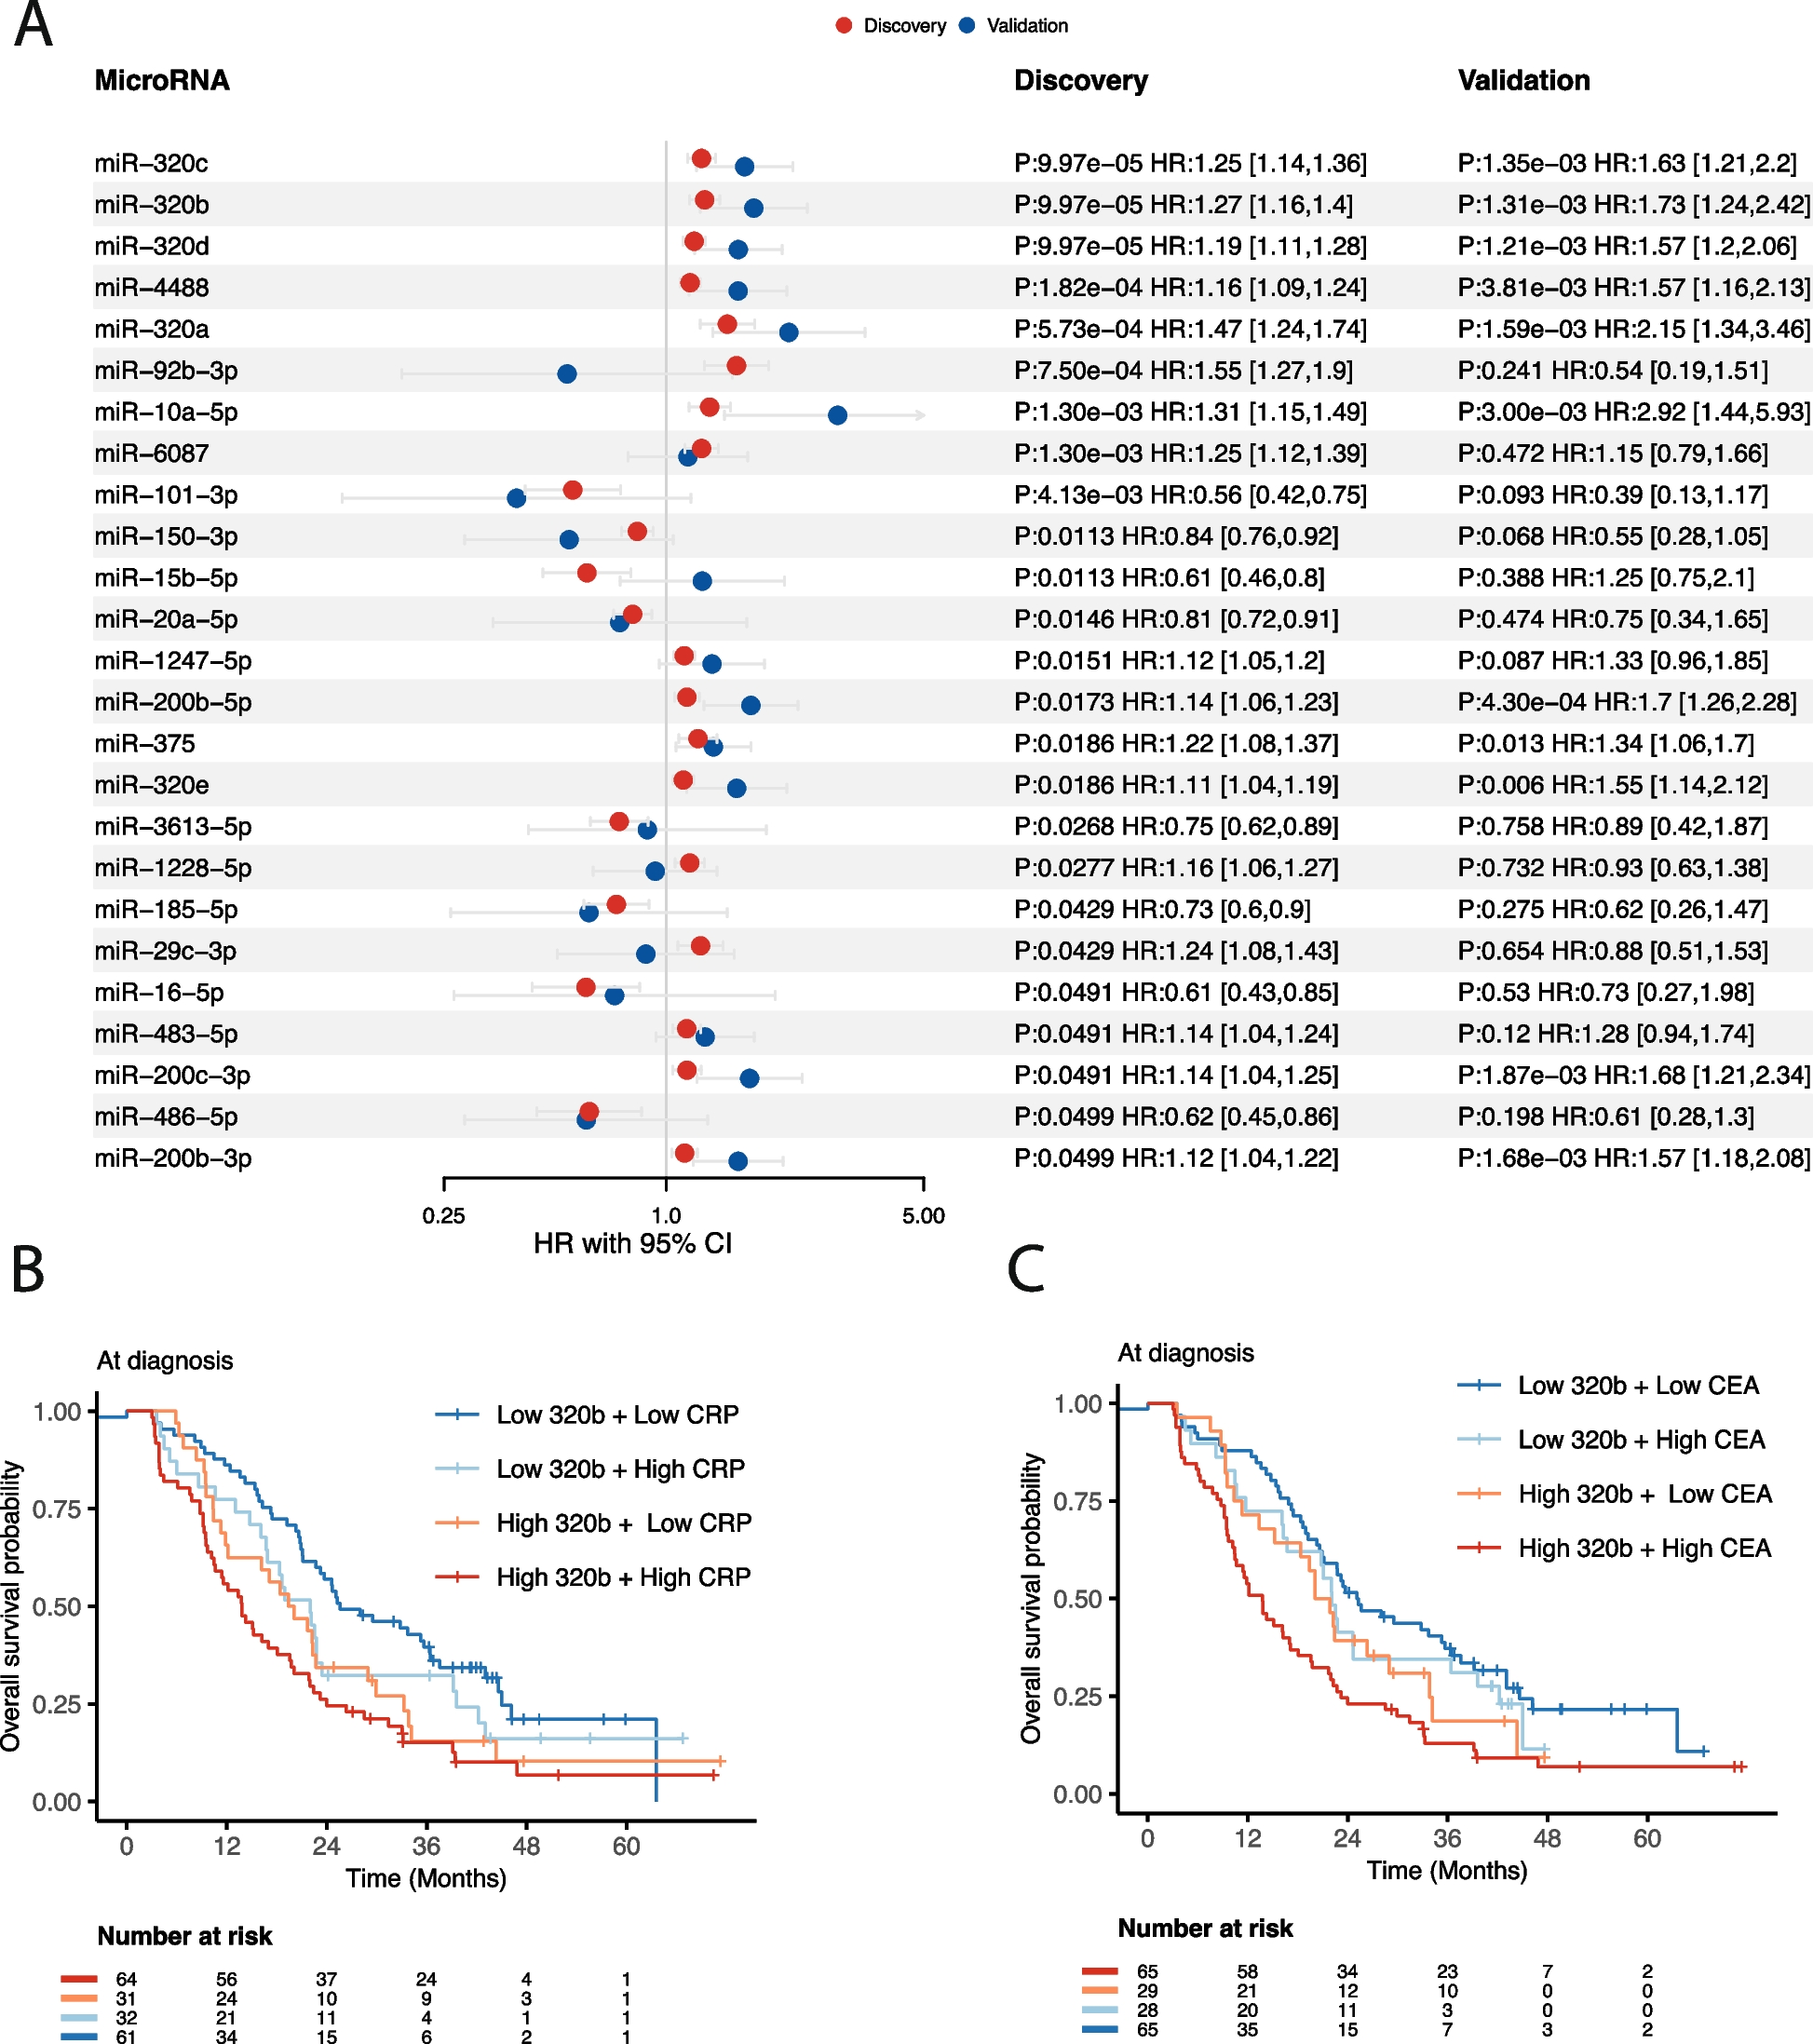
Serum miRNA-levels at diagnosis are associated with overall survivalSmall RNA-sequencing were performed on the whole study population, with the aim of identifying novel prognostic sRNAs related to mCRC. The sequencing statistics of the sRNA data showed that microRNAs were the most abundant RNA type comprising almost half of the reads with a fragment length peak of 22 nucleotides (Supplementary Fig. 2A-F), followed by lncRNAs, tRNAs and rRNAs. For all RNA-classes, we investigated if specific sRNAs were associated with overall survival by analyzing 195 treatment-naïve serum samples collected at diagnosis (the discovery cohort), while adjusting for sex, age, microsatellite status and treatment type. After correcting for multiple testing across the tested sRNAs, miRNAs were the only class showing significant associations, with a total of 25 significant miRNAs (Fig. 1A). 17 of the miRNAs had a positive hazard ratio and eight miRNAs had a negative hazard ratio (Fig. 1A). We sought to validate these associations by reanalyzing a sRNA sequencing dataset from 20 treatment-naïve patients with metastatic CRC, all of which had serum collected at diagnosis, like the current discovery cohort. We found that 11 of the 25 significant miRNAs were also significantly associated with overall survival in the validation cohort (coxph p < 0.05), and the direction of hazard ratios were generally consistent between the discovery- and validation cohort, except for four miRNAs (Fig. 1A). Importantly, the top five miRNAs from the discovery cohort were also significant in the validation cohort, including all miR-320 family of miRNAs.
Fig. 1
Overall survival results for miRNAs. A Forest plot showing the hazard ratios, confidence intervals and adjusted p-values with respect to overall survival for the significant miRNAs at diagnosis. Shown are results from the discovery and validation cohort, colored in red and blue, respectively. B Kaplan–Meier survival curves for miR-320b in combination with CRP. High and low miR-320b and CRP are defined as above or below the median value, respectively. The risk-table shows the number of individuals at risk for the different time intervals. C Similar as in A) for miR-320b and CEA. High and low CEA is defined as above or below the median CEA value
High-risk mCRC-patients have elevated levels of miR-320Having established a panel of significant miRNAs, we aimed to refine patient stratification by integrating clinical variables with miRNA expression. C-reactive protein (CRP) and carcinoembryonic antigen (CEA) are widely used clinical indicators, typically associated with poor survival, as observed in our dataset. Hence, we examined whether combining CRP and CEA with miRNA expression enhances prognostic stratification in mCRC patients. We selected miR-320b as our focus, given its pronounced significance and higher hazard ratio both in the discovery and validation cohort compared to the other miR-320 members, which shared the same p-value. However, since all miR-320 members showed significant associations with survival, we provide detailed results for these and other miRNAs at our interactive browser https://github.com/MjelleLab/mCRC. Patients were categorized into four groups based on median miR-320b expression and CRP levels. Our findings revealed that individuals with elevated miR-320b and high CRP or CEA levels experienced the poorest survival outcomes, while those with low miR-320b and low CRP or CEA levels had the best survival (Fig. 1B-C). Notably, patients with low miR-320b and elevated CRP/CEA demonstrated significantly better survival than those with high miR-320b and elevated CRP/CEA, underscoring the independent prognostic value of miR-320b (p = 0.005 and p = 0.01 for miR-320b in multivariate models with CRP and CEA, respectively). Median survival for patients with high CRP and high miR-320b was 420 days, whereas those with high CRP and low miR-320b survived a median of 600 days, highlighting high miR-320b as a crucial subgroup with metastatic disease and significantly elevated risk (Fig. 1B). A similar trend was observed for CEA, where patients with high miR-320b and high CEA had a median survival of 418 days, compared to 638 days for those with high CEA and low miR-320b (Fig. 1C). Importantly, other members of the miR-320 family exhibited similar patterns regarding CRP/CEA levels and overall survival (results accessible through the provided interactive browser).
Although survival analyses were adjusted for treatment type, we further investigated and visualized survival outcomes for miR-320b stratified by the three primary treatment types. Our findings underscored the significant association between high miR-320b levels and overall survival across different treatment types, reinforcing miR-320b as an independent prognostic biomarker, irrespective of treatment type (Supplementary Fig. 3A-C).
Survival associated microRNAs at two-months evaluationAfter establishing the prognostic significance of miRNA expression at diagnosis in identifying high- and low-risk metastatic colorectal cancer (mCRC) patients, we aimed to assess whether miRNA expression at the two-month evaluation also holds predictive value. Conducting coxph survival analysis on miRNAs at the two-month evaluation, we identified 17 miRNAs significantly associated with overall survival (Supplementary Fig. 4A). While many of these miRNAs overlapped with those significant at diagnosis, several were uniquely significant at the evaluation point, including miR-200a-3p, miR-151b, miR-16-5p, miR-21-5p, miR-144-5p, miR-483-5p, and miR-96-5p. Although fewer miRNAs showed significant associations with overall survival at the two-month evaluation, the miR-320 family of miRNAs showed increased significance compared to the diagnosis samples. Notably, patients with low miR-320b and elevated C-reactive protein (CRP) or carcinoembryonic antigen (CEA) levels demonstrated significantly better survival than those with high miR-320b and elevated CRP levels (p = 2.97e-05 and p = 3.11e-06 for miR-320b in multivariate models with CRP and CEA, respectively), surpassing the predictive capability of the model at diagnosis (Supplementary Fig. 4B-C). Consistent with the findings in the diagnosis samples, we observed that miR-320b remained significantly associated with survival regardless of the type of treatment administered (Supplementary Fig. 3D-F).
Major changes in serum small RNA expression two months after chemotherapyTo investigate alterations in serum small RNAs among metastatic colorectal cancer (mCRC) patients following chemotherapy, serum sRNAs were sequenced at diagnosis and at the two-month evaluation. Substantial changes in miRNA expression were observed when comparing samples collected before and after chemotherapy. A total of 70 miRNAs showed significant differential expression, with seven up-regulated and 63 down-regulated in the evaluation samples compared to the baseline samples (Fig. 2A). Notably, all miRNAs associated with survival demonstrated differential expression, including the miR-320 family, which ranked among the most significantly downregulated miRNAs post-treatment. Additionally, significant differential expression was observed for small RNAs across six different sRNA classes (Fig. 2A). Particularly, a pronounced up-regulation of small nuclear RNAs (snRNAs) was detected post-chemotherapy (Fig. 2A). Analysis of protein-coding RNA fragments revealed an up-regulation of hemoglobin RNAs (HBA), suggestive of pre-existing anemia in mCRC patients prior to treatment. Furthermore, inflammation-associated gene RUVBL1 exhibited higher expression levels pre-treatment compared to post-treatment (Fig. 2A). Other RNA classes displayed down-regulation of small nucleolar RNAs (snoRNAs), up-regulation of Y-RNAs, and differential expression of vaultRNAs, albeit only four vaultRNAs met our expression threshold, limiting definitive conclusions regarding the overall impact of chemotherapy on vaultRNAs. (Fig. 2A). Interestingly, one snRNA, RNU2-37P, showed reduced levels post-chemotherapy and served as a predictive marker for future progression when measured at diagnosis (Fig. 2A). Subsequently, we investigated whether serum sRNAs in responders and non-responders demonstrated differential changes from diagnosis to the first evaluation. To ensure comparable group sizes, we randomly selected 29 patients from the responder group, to match the group size of the non-responder group. Differential expression analysis between diagnosis and the two-month evaluation was performed for non-responding patients and the randomly selected responders. Comparison of p-values and effect sizes between these two groups, focusing solely on sRNAs significant in the overall analyses involving all patients, revealed significantly lower p-values and higher effect sizes in responders compared to non-responders (Fig. 2B-C), suggesting that changes in serum sRNAs post-chemotherapy may serve as potential biomarkers for treatment response.
Fig. 2
Differentially expressed miRNAs with respect to treatment. A Volcano plot showing differentially expressed sRNA-groups when comparing the expression before and after treatment of mCRC patients. Shown are the sRNA-groups for which significant sRNAs were detected. The x-axis shows the fold-changes values (log2) comparing the evaluation samples to the inclusion samples. The y-axis shows the inverse adjusted p-values (-log10). Selected sRNAs are indicated with name. Red indicates significance (Benjamini–Hochberg adjusted p-value < 0.05). B Differences in adjusted p-values for sRNAs detected as significant in A) from a differential expression analysis between two-month evaluation and diagnosis, for non-responding patients and an equal sized sampling of responding patients. The p-values are from a wilcoxon signed-rank test comparing the two groups. C Similar as in B) for the log-fold changes values (effect sizes). P-values calculated as in B). D Differentially expressed miRNAs, isomiRs and snRNAs between patients with progressive and stable disease (non-responders and responders, respectively), as defined after two months evaluation. The x-axis shows the fold-changes values (log2) between patients with progressive and stable disease. The y-axis shows the inverse adjusted p-values (-log10). Selected sRNAs are indicated with name. Red indicates significance (Benjamini–Hochberg adjusted p-value < 0.05) E ROC-curve for the leave-one-out cross-validated model predicting progressive disease at two-month evaluation based on isomiR serum-levels at diagnosis. The model is based on the top 5 differentially expressed isomiRs between responders and non-responders
Small RNA levels at diagnosis identify non-responding patientsHaving demonstrated the potential of miRNA levels at diagnosis and at the two-month evaluation in identifying high-risk patients, we next investigated whether miRNAs and other small RNAs at diagnosis could predict patient response to chemotherapy. We conducted a differential expression analysis comparing patients who had progressive disease (PD) two months after chemotherapy (n = 29) with those who showed remission or stable disease (SD) during the same period (n = 160). Notably, we identified eight miRNAs, 62 isomiRs (miRNA variants), and one snRNA (RNU2-37P) that showed significant differential expression between the two groups (Fig. 2D, Supplementary Table 2). These significant isomiRs were associated with 52 different miRNAs, including five belonging to miR-451a and three to let-7i-5p. Among them, miR-15b-5p emerged as a significant miRNA and isomiR, with low levels at diagnosis correlating with poor survival, consistent with its down-regulation in PD patients at diagnosis. Subsequently, we assessed whether a small RNA signature based on differentially expressed isomiRs at diagnosis could predict patients' future PD status at the two-month evaluation. We found that by combining the five most significant isomiRs from patients with PD and SD, it was possible to distinguish between them based on their isomiR levels at diagnosis. The predictive performance of this isomiR signature was validated using leave-one-out cross-validation, yielding an area-under-the-curve (AUC) of 0.80 (P = 1.9e-7, 95% CI: 0.71–0.88) (Fig. 2E).
留言 (0)