
記住我


A total of 38 patients with metastatic TFE3-rRCC from our RCC database were enrolled in the study from January 2011 to February 2023. The median follow-up time was 28.8 months (range: 3.7-153.2). The baseline characteristics of the included patients are summarized in Suppl. Table 1 and Fig. 1A. The median age at initial diagnosis was 36 years (range: 11–70 years) and the male-to-female ratio was 1:2.5. Regarding nephrectomy, 50.0% (19/38), 15.8% (6/38) and 21.1% (8/38) of patients underwent radical nephrectomy (RN), nephron-sparing surgery (NSS) and cytoreductive nephrectomy (CN), respectively. The median size of tumors was 5.7 cm (range: 2.2–19.4 cm) and 60.5% (23/38) tumors had an ISUP grade ≥ 3. Collectively, the fusion partners were identified in 33/38 (86.8%) patients, including ASPSCR1-TFE3 (n = 13), NONO-TFE3 (n = 6), PRCC-TFE3 (n = 5), MED15-TFE3 (n = 3), SFPQ-TFE3 (n = 2), U2AF2-TFE3 (n = 2), RBM10-TFE3 (n = 1), ARID1B-TFE3 (n = 1).
Fig. 1
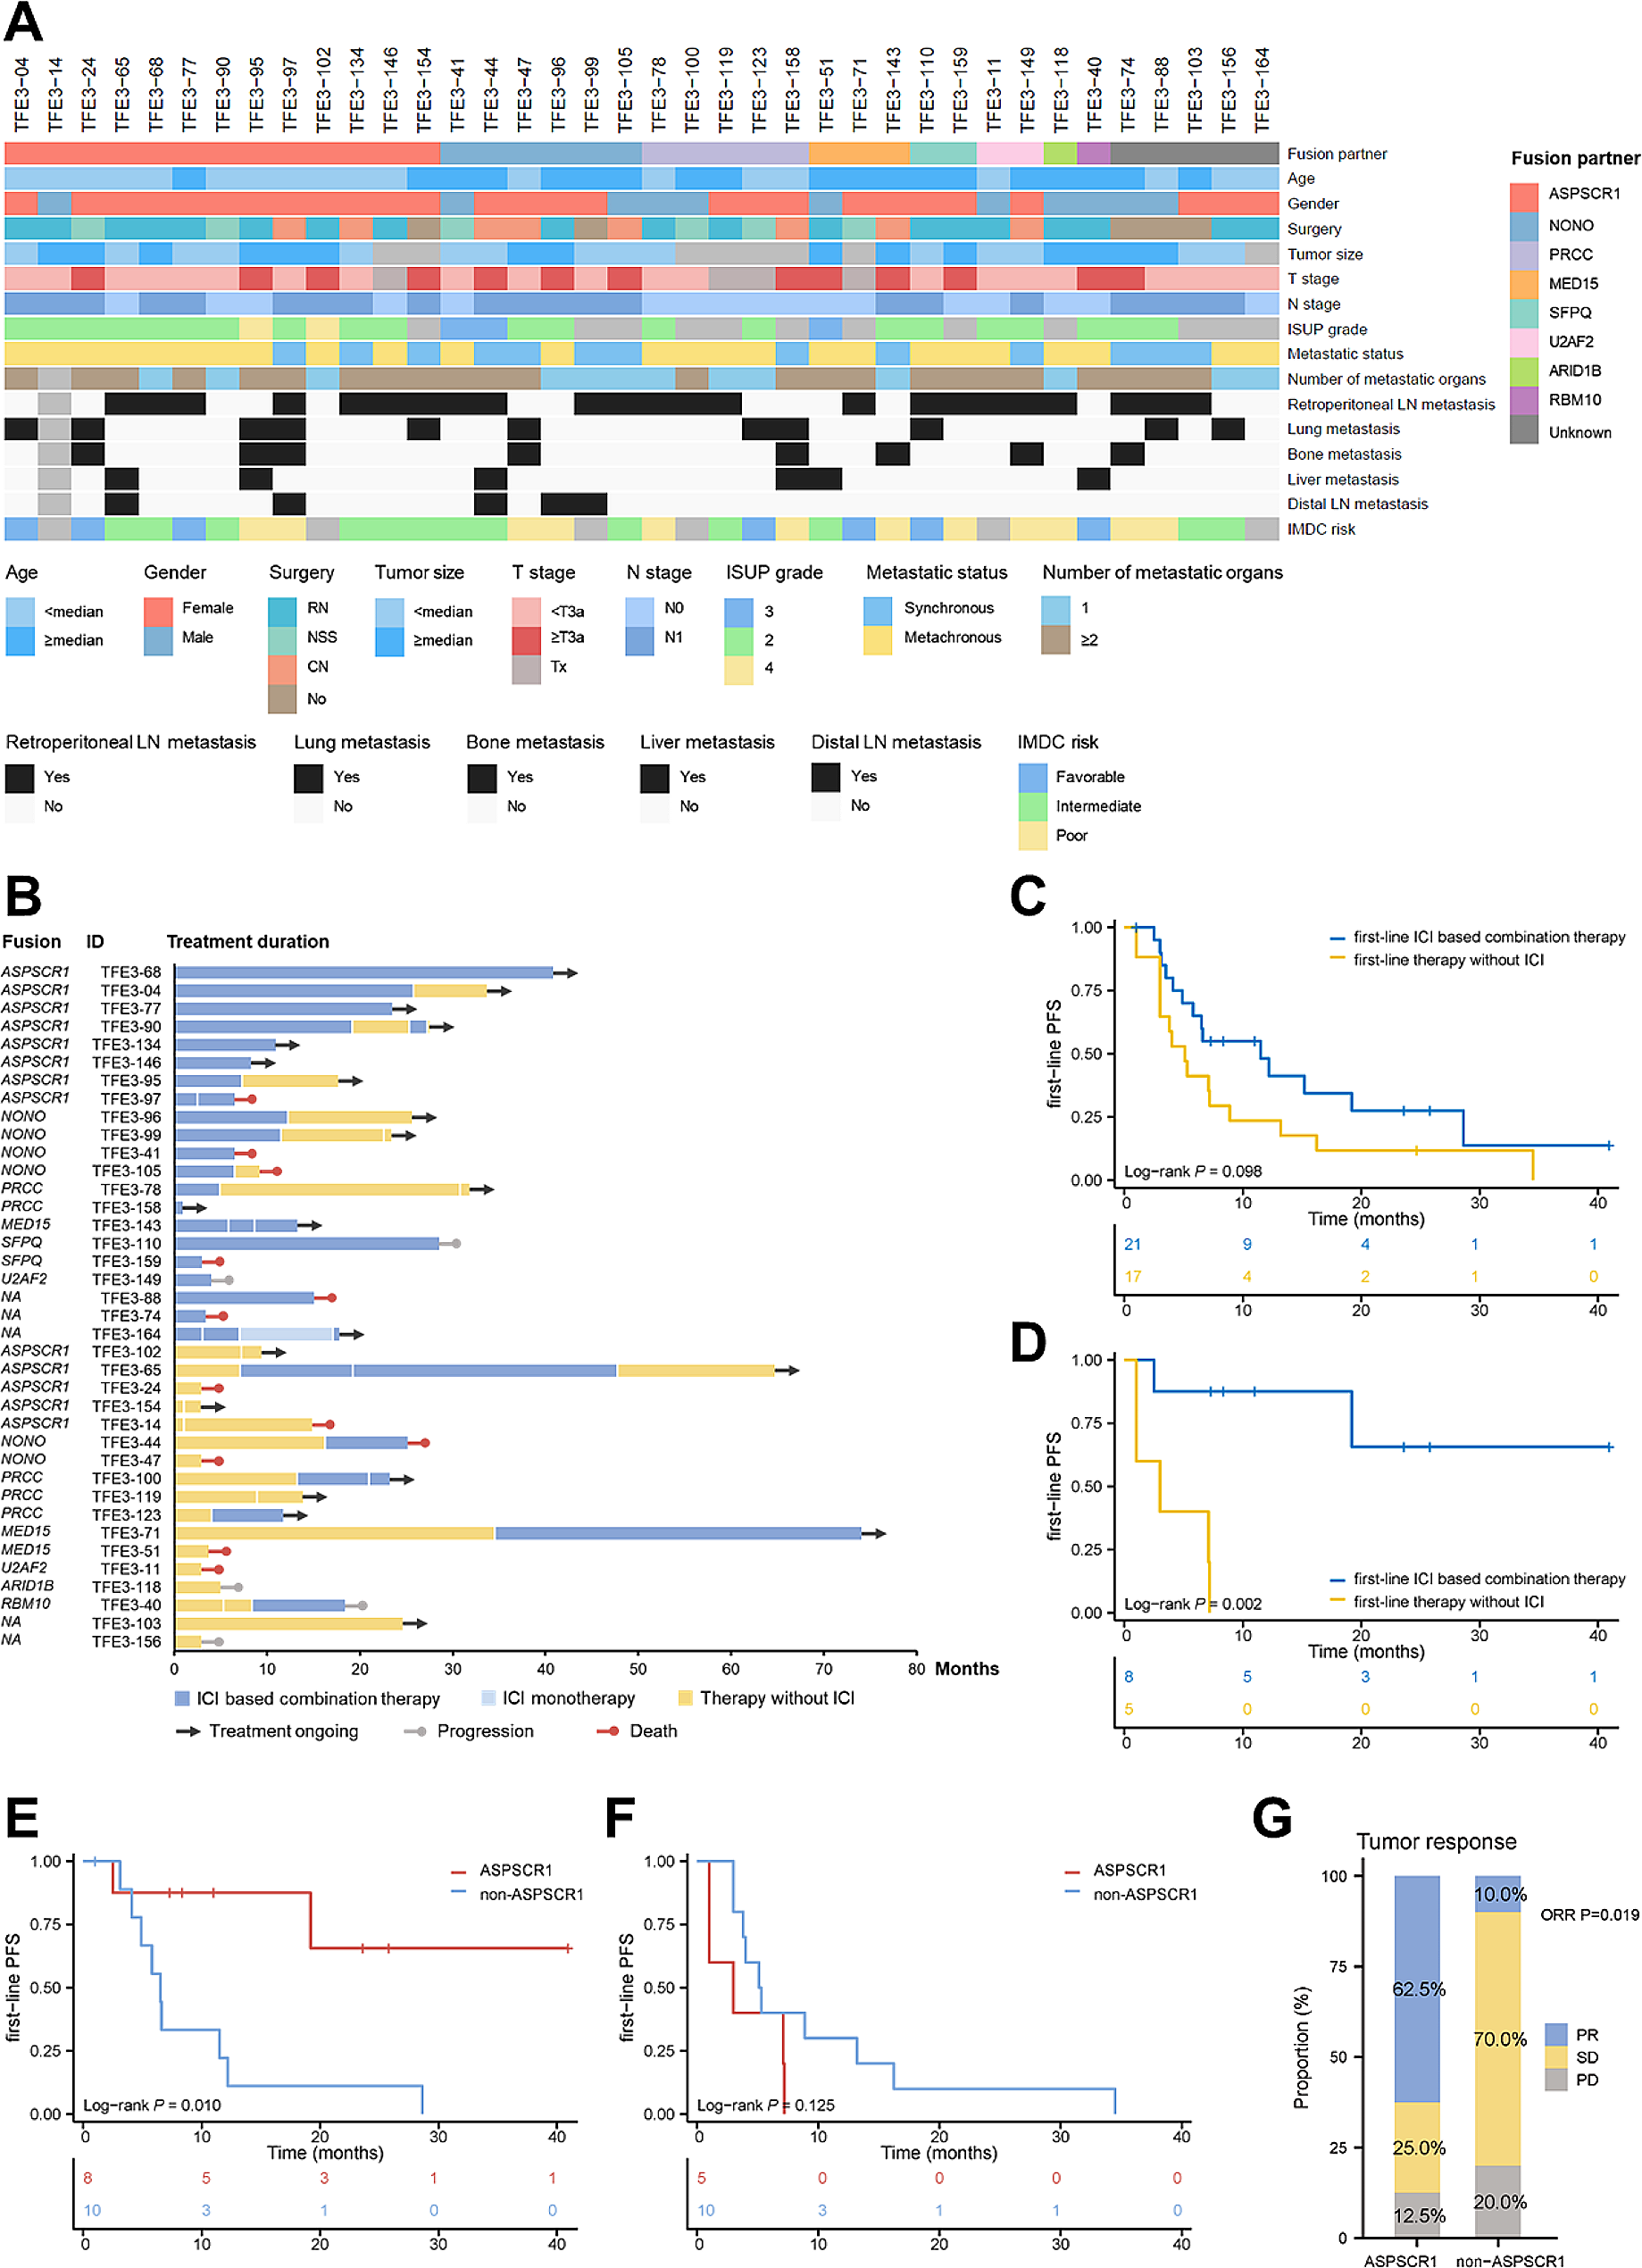
Characteristics and treatment outcomes of patients with metastatic TFE3-rRCC. A Heatmap showing clinicopathologic characteristics of patients with metastatic TFE3-rRCC patients (n = 38). B Swimmer plot showing the treatment response and duration of each patient receiving systemic treatments. C First-line PFS between patients receiving ICI based combination therapy and therapy without ICI at first-line. D First-line PFS between ASPSCR1-TFE3 rRCC patients receiving ICI based combination therapy and therapy without ICI at first-line. E First-line PFS between patients with ASPSCR1-TFE3 rRCC and non-ASPSCR1-TFE3 rRCC when receiving first-line ICI based combination therapy. F First-line PFS between patients with ASPSCR1-TFE3 rRCC and non-ASPSCR1-TFE3 rRCC when receiving first-line therapy without ICI. G Tumor response between patients with ASPSCR1-TFE3 rRCC and non-ASPSCR1-TFE3 rRCC when receiving first-line ICI based combination therapy
Within the cohort, 65.8% (25/38) patients had metachronous metastases. Twenty-four (63.2%) patients developed metastasis in more than one organ. Involvement of retroperitoneal lymph node was the most common site of metastasis at the time of diagnosis of metastatic disease (60.5%). Lung, bone, liver and distal lymph node metastases were each observed at diagnosis of metastatic disease in 28.9%, 21.1%, 15.8%, 13.2% of cases, respectively. Among 32 patients with complete clinical data to evaluate IMDC risk, 78.1% (25/32) patients were stratified into intermediate/poor-risk group.
Systemic treatment outcomes of metastatic TFE3-rRCCAll the 38 patients received systemic treatment. The details of systemic therapies for individual patients on each treatment line are shown in Fig. 1B. For the first-line treatment, 21 patients received ICI based combination therapy, including ICI plus TKI (n = 19) (sitilimab plus axitinib, n = 9; toripalimab plus axitinib, n = 4; tislelizumab plus axitinib, n = 2; pembrolizumab plus sunitinib, n = 1) and ICI plus TKI plus mTORi (n = 2) (toripalimab plus axitinib plus everolimus, n = 2). The other 17 patients received therapy without ICI, including TKI monotherapy (n = 13) (axitinib, n = 6; sunitinib, n = 5; sorafenib, n = 2) and TKI plus mTORi (n = 4) (axitinib plus everolimus, n = 3; lenvatinib plus everolimus, n = 1).
For the first-line setting, the median PFS was 6.6 (95% CI: 4.3–8.9) months, and the median OS was not reached (Suppl. Figure 1 A, 1B). All patients were evaluable for the best tumor response by RECIST 1.1. Patients receiving ICI based combination therapy had a higher ORR (7/21, 33.3%) than those treated without ICI (3/17, 17.6%) (P = 0.275), as well as DCR (16/21, 76.2% vs. 8/17, 47.1%, P = 0.064) (Suppl. Figure 2 A). Compared to patients treated without ICI at first-line, those receiving ICI based combination therapy at first-line had longer PFS (median PFS: 11.5 vs. 5.1 months, P = 0.098), although without statistical significance (Fig. 1C). Regarding OS, there was no significant difference between the two groups (median OS: not reached vs. 27.4 months, P = 0.593) (Suppl. Figure 2B). However, after comparing patients receiving first or subsequent-line ICI based combination therapy with those who never received ICI during their treatment history, we found that the former had longer OS (median OS: not reached vs. 15.2 months, P = 0.045) (Suppl. Figure 2 C).
Treatment-related adverse events (AEs) of any grade occurred during first-line treatment are summarized in Suppl. Table 2. The most common AEs were palmar-plantar erthrodysesthesia syndrome (20/38, 52.6%), proteinuria (15/38, 39.5%), increased blood creatinine (14/38, 36.8%). Most AEs were grade 1/2, AEs of grade ≥ 3 occurred in 9 (23.7%) patients. For patients receiving ICI based combination therapy and patients treated without ICI at first-line treatment, AEs of grade ≥ 3 occurred in 6 (28.6%) and 3 (17.6%) patients, respectively.
ICI based combination therapy improved prognosis in ASPSCR1-TFE3 rRCCSubgroup analysis was further performed to identify patients in whom first-line ICI based combination therapy could effectively improve PFS (Suppl. Figure 3). The results demonstrated that, first-line ICI based combination therapy significantly prolonged PFS compared with therapy without ICI in patients younger than median age (PFS HR: 0.177, 95% CI: 0.045–0.705, P = 0.014), patients with ISUP grade ≥ 3 (PFS HR: 0.183, 95% CI: 0.058–0.578, P = 0.004), and patients having metachronous disease (PFS HR: 0.349, 95% CI: 0.137–0.894, P = 0.028). Moreover, we observed that patients with ASPSCR1-TFE3 fusion significantly benefited from ICI based combination therapy (PFS HR: 0.068, 95% CI: 0.008–0.609, P = 0.016), whereas no improvement in PFS was observed in patients with other fusions (PFS HR: 1.063, 95% CI: 0.416–2.714, P = 0.898). Kaplan-Meier curves illustrated that, among patients with ASPSCR1-TFE3 fusion, those receiving ICI based combination therapy achieved longer PFS than those treated with therapy without ICI (median PFS: not reached vs. 3.0 months, P = 0.002) (Fig. 1D).
Univariate and multivariate cox regression analysis was further performed to identify prognostic factors that can determine the response to ICI. In the univariate analysis, we found that metastatic status (synchronous vs. metachronous), involvement of bone metastasis and ASPSCR1-TFE3 fusion were significantly associated with treatment outcomes (Suppl. Table 3). Kaplan-Meier curves demonstrated that patients with ASPSCR1-TFE3 fusion had longer PFS than those with other fusions when receiving ICI based combination therapy at first-line (median PFS: not reached vs. 6.5 months, P = 0.01) (Fig. 1E, Suppl. Table 4). In the contrary, patients with ASPSCR1-TFE3 fusion could not benefit from first-line therapy without ICI (median PFS: 3.0 vs. 5.1 months, P = 0.125) (Fig. 1F, Suppl. Table 4). In the multivariate analysis, only ASPSCR1-TFE3 fusion remained as the only independent prognostic factor for PFS in patients receiving first-line ICI based combination therapy (Suppl. Table 3). Regarding tumor response, ORR was 62.5% (5/8) in ASPSCR1-TFE3 rRCC patients, much higher than that in other TFE3-rRCC subtypes (10.0%, 1/10) (P = 0.019) (Fig. 1G, Suppl. Table 4). We also observed that patients with ASPSCR1-TFE3 fusion experienced longer OS compared to those with other fusions when receiving ICI based combination therapy at first-line or subsequent line. However, the difference did not reach statistical significance. (Suppl. Figure 4 A, 4B). Meanwhile, we have utilized data from the IMmotion151 cohort to corroborate our findings (Suppl. Table 5). Although the cohort included only 5 patients with metastatic TFE3-rRCC received ICI plus TKI combination therapy in the IMmotion151 cohort, it is notable that the sole responder (PR) was an ASPSCR1-TFE3 rRCC case, which also exhibited the best PFS. This outcome provides some validation of our findings.
Transcriptome features of ASPSCR1-TFE3 rRCC correlated with response to systemic treatmentWe then attempted to figure out why patients with ASPSCR1-TFE3 fusion exhibited better response to ICI based combination therapy than other fusions through transcriptome analysis. RNA-seq was performed on 32 tumors, of which 31 had information of fusion partners. Additionally, we derived data from the IMmotion151 trial to validate findings from our cohort, and partner genes were identified in 10 out of 12 patients with TFE3 fusion (Suppl. Table 5) [8].
Analysis of differentially expressed genes (DEGs) identified a total of 337 up-regulated and 232 down-regulated genes in ASPSCR1-TFE3 rRCC compared to non-ASPSCR1-TFE3 rRCC (Fig. 2A). Principal component analysis further revealed that ASPSCR1-TFE3 rRCC and non-ASPSCR1-TFE3 rRCC harbored distinct transcriptomic landscapes (Fig. 2B). We firstly observed enrichment of multiple pathways involved in angiogenesis by gene set enrichment analysis (GSEA) in both our cohort and the IMmotion151 cohort (Fig. 2C, Suppl. Figure 5 A). Scores calculated using single sample GSEA (ssGSEA) further confirmed a higher activity of angiogenesis in ASPSCR1-TFE3 rRCC (P < 0.05) (Fig. 2D). As a central regulator of neovasculature and common target of numerous anti-angiogenic agents, the expression level of VEGFA at mRNA level was higher in ASPSCR1-TFE3 rRCC (P < 0.001) (Fig. 2E, Suppl. Figure 5B). In addition, enrichment of VEGF signaling was also observed in ASPSCR1-TFE3 rRCC, suggesting the probable favorable response to anti-angiogenic therapy (Fig. 2F). Obviously, omics features and clinical practice was inconsistent. In the present cohort, 5 patients with ASPSCR1-TFE3 fusion could not benefit from TKI based therapy (Fig. 1F, Suppl. Table 4).
Fig. 2
Transcriptomic landscape between ASPSCR1-TFE3 rRCC and non-ASPSCR1-TFE3 rRCC. A Differentially expressed genes between ASPSCR1-TFE3 rRCC and non-ASPSCR1-TFE3 rRCC. B Principal component analysis for the expression profiles between ASPSCR1-TFE3 rRCC and non-ASPSCR1-TFE3 rRCC. C Enrichment of angiogenesis signaling pathways in ASPSCR1-TFE3 rRCC revealed by gene set enrichment analysis (GSEA). D Scores of angiogenesis signaling pathways between ASPSCR1-TFE3 rRCC and non-ASPSCR1-TFE3-rRCC by single sample GSEA (ssGSEA). E The mRNA expression level of VEGFA between ASPSCR1-TFE3 rRCC and non-ASPSCR1-TFE3 rRCC. F Enrichment of VEGF signaling pathway in ASPSCR1-TFE3 rRCC revealed by GSEA. G Enrichment of ECM and collagen-related pathways in ASPSCR1-TFE3 rRCC revealed by GSEA. H Down-regulation of ECM and collagen-related pathways in responders of all patients receiving first-line therapy without ICI, irrespectively of fusion type. I First-line PFS between patients with high and low expression of collagen-related genes when receiving first-line therapy without ICI, irrespectively of fusion type. J Enrichment of immune-related signaling pathways in ASPSCR1-TFE3 rRCC revealed by GSEA. K Scores of immune-related signaling pathways between ASPSCR1-TFE3 rRCC and non-ASPSCR1-TFE3 rRCC by ssGSEA. L Enrichment of immune-related signaling pathways in ASPSCR1-TFE3 rRCC revealed by GSEA in IMmotion151 cohort. M Enrichment of immune-related signaling pathways in responders receiving first-line ICI based combination therapy
At the same time, in ASPSCR1-TFE3 rRCC, we also found enrichment of pathways involved in extracellular matrix (ECM) and collagen by GSEA (Fig. 2G, Suppl. Figure 6). Conversely, down-regulation of these pathways were observed in responders (PR), compared to non-responders (SD + PD), in all the patients who received first-line therapy without ICI, irrespectively of fusion types (Fig. 2H). Moreover, high expression of several collagen-related genes indicated shorter PFS in all the patients receiving therapy without ICI (Fig. 2I). These results demonstrated that ECM and collagen-related pathways enriched in ASPSCR1-TFE3 rRCC might interfere with the potential efficacy of anti-angiogenic therapy. To our interest, positive correlations were observed between collagen-related genes, ECM and collagen-related signaling activity and expression of immune checkpoints (CD274, PDCD1), indicating the application of ICI (Suppl. Figure 7).
The immune microenvironment between TFE3-rRCC with ASPSCR1-TFE3 and other fusion partners was then explored. GSEA and ssGSEA both indicated enrichment of multiple immune-related pathways in ASPSCR1-TFE3 rRCC, which was further verified by data from the IMmotion151 trial (Fig. 2A-C). Similarly, up-regulation of immune-related pathways were also observed in responders receiving ICI based combination therapy (Fig. 2D). In addition, we calculated and compared the infiltration level of immune cells between ASPSCR1-TFE3 rRCC and non-ASPSCR1-TFE3 rRCC using CIBERSORT algorithm (Suppl. Figure 8 A). Our focus then shifted to T cells due to their vital roles in tumor immunity. We observed that T cell levels are comparable between ASPSCR1-TFE3 rRCC and non-ASPSCR1-TFE3 rRCC (Suppl. Figure 8B). we also evaluated the expression of several immune checkpoint molecules, finding that the ASPSCR1-TFE3 rRCC exhibited lower CTLA4 expression level than the non-ASPSCR1-TFE3 rRCC (P = 0.014) (Suppl. Figure 9). The results indicated a relative more inflamed immune microenvironment in ASPSCR1-TFE3 rRCC, which might explain why these patients could benefit from ICI based combination therapy.
留言 (0)