
記住我
The intratumoral microenvironment develops hypoxia over an extended time frame, generating a continuum of oxygen concentrations, resulting in differential HIF1 activity (Fig. 1A) [15]. First, to monitor tumor cell adaptation to long term and severe hypoxia, we established a reporter cell line using a lentiviral HIF1α-eGFP fusion construct in B16-F10 mouse melanoma cells (Fig. S1A). Flow cytometry and confocal microcopy analyses revealed that most cells (98%+) transduced with this construct had no GFP signal under normoxia, but had clear nuclear accumulation of GFP under HIF1α stabilizing conditions (Fig. 1B, Fig. S1B, C). We single-cell sorted GFP positive cells following CoCl2 treatment to obtain a clone, termed B16-HG, with high HIF1α-eGFP accumulation while remaining GFP negative under normoxic conditions and confirmed integrity of the protein fusion product by Western blot (Fig. S1C-E). Finally, we monitored the dynamics and longevity of B16-HG GFP signal following incubation in severe hypoxia and hypoxia recovery to determine the sensitivity and precision of ascribing GFP signals to a cell hypoxic state. B16-HG cells transferred directly from normoxia (TC) to 0.2% O2 expressed detectable GFP signal in as little as 2 h, peaked at 14 h and remained stable for a minimum of 5 h after re-oxygenation with full loss of GFP signal observed after 24 h (Fig. S1F, G). Other than a small but statistically significant difference in proliferation profile compared to the polyclonal B16-WT counterpart, most likely due to the high expression of mCherry and HIF1α-GFP mRNA, the B16-HG phenotype remained unaltered, (Fig. S1H). Nevertheless, based on these results, we determined that the B16-HG cell line can accurately track hypoxia-adaptation.
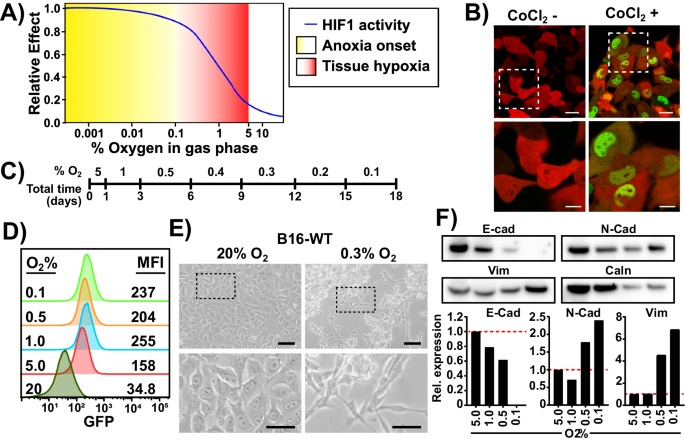
Fig. 1: Long-term severe hypoxia adaptation induces EMT-like morphological changes.
A The definitions of hypoxia and anoxia commonly used in the literature and their effect on HIF activity. B Confocal microscopy images of B16-HG cells under normal culture conditions (left), or after CoCl2 treatment (200 µM, 24 h). Scale bars: top = 20 µm; bottom = 10 µm. Green: HIF1α-GFP. Red: mCherry (cytoplasmic). C Definition of the Long-Term Hypoxia (LTHY) time course. D GFP levels of B16-HG cells over the course of the LTHY protocol. Numbers represent geometric Mean Fluorescent Intensity (geoMFI) of GFP signal. E B16-HG cell morphology under normal tissue culture conditions (left). B16-HG cell morphology after reaching the 0.3%O2 timepoint of the LTHY protocol (right). Scale bars: top = 100 µm; bottom = 50 µm. F Western blot (top) and analysis (bottom) of B16-HG harvested at indicated LTHY time points and probed for EMT-associated E-Cadherin (E-Cad), N-cadherin (N-Cad) and vimentin (Vim) and loading control calnexin (Caln). Band intensities were normalized to loading control. Data expressed as expression fold change relative to the 5%O2 condition.
To recapitulate the gradual onset and near anoxic tumor microenvironments, we developed a long-term hypoxia (LTHY) incubation protocol, where cells endure increasingly severe hypoxia after days of acclimatization (Fig. 1C). These kinetics mimic the overall time course of tumor progression in the B16 mouse melanoma model and oxygen levels previously described in melanoma [16,17,18]. Flow cytometry analyses of B16-HG cells during LTHY adaptation revealed partial stabilization of HIF1α-GFP at physoxia (5% O2) and reached maximum stabilization at 1% O2 and below (Fig. 1D) [19].
Interestingly, we observed significant morphological changes in B16-HG cells during LTHY (Fig. 1E). Starting from an epithelial-like “cobblestone” morphology in normoxic to mild hypoxic conditions (5% and 1% O2), the cells developed a more mesenchymal-like morphology, with elongated and polarized cell features under more severe hypoxic conditions (below 0.5% O2), formed large aggregates, and were semi-attached to the culture dish. These morphological changes, in addition to increased expression of Vimentin (Vim) and N-cadherin (N-Cad), and decreased expression of E-cadherin (E-cad) made us investigate whether the cells were undergoing EMT (Fig. 1F).
LTHY adaptation upregulates EMT-promoting miRsGiven these observations, we investigated whether cells were indeed undergoing EMT at the transcriptomic level. We collected miRNAseq and mRNAseq data at end of the 5%, 1%, 0.5%, and 0.1% O2 time points during LTHY to identify differentially expressed miRs (DEmiRs) and genes (DEGs). PCA analyses confirmed that oxygen content was a major determinant in shaping the transcriptome, as PC1 correlates with the LTHY stages (Fig. S2A). After verifying the expression of all components of the miRNA biogenesis and effector pathways during LTHY (Fig. S2B), we performed hierarchical clustering analyses, which revealed a dynamic DEmiR landscape across conditions with two clusters (clusters 3&4) being highly regulated at the 1-0.5% and 0.5-0.1% O2 transitions. (Fig. 2A). As a validation step, we examined miR-210-3p, a canonical hypoxia-induced miRNA. Although miR-210-3p was already elevated at 5% O2, indicative of some level of hypoxic stress, levels were further significantly upregulated during LTHY, indicative of an increased state of hypoxic stress (Fig. 2A, B). These results agree with our previous observations made with HIF1α-GFP (Fig. 1D).
Fig. 2: Long-term hypoxia adaptation induces an miRNA signature linked to EMT.
A Hierarchically clustered heatmap of all differentially expressed (Benjamini-Hochberg adjusted p-value < 0.05 in the 5% vs 0.1% O2 comparison, and > 100 normalized DESeq2 reads in any condition) miRs, normalized to contribution to total expression in the dataset. Red denotes the classical hypoxia-induced miR, miR-210-3p. Green denotes EMT-promoting miRs miR-221/222. Blue and purple denote other miRs of interest. Heatmap clustered using WardD.2 hierarchical linkage metric, with the number of clusters chosen subjectively. B Expression values for miR-210-3p. C Expression values for miR-125b-1-3p. D Expression values for miRs of interest in cluster 4. E Expression values for miRs of interest in cluster 5. F, G Expression values for genes Cpeb1 and Sema6d. B, G Expression levels are DESeq2 normalized reads. * denotes relative significance as calculated by DESeq2 Benjamini-Hochberg adjusted p-value (padj). *padj < 0.05, **padj < 0.01, ***padj < 0.001.
Interestingly the top DEmiR at 0.1% O2 was miR-125b-1-3p, which has been linked to increased metastatic potential in colorectal cancer cells and was the top upregulated miR in an EMT-inducing assay using pancreatic cancer cells along with miR-100-5p (Fig. 2A, C) [20, 21]. All other miRs present in this cluster also have links to EMT and have been shown to be regulators of TGFβ-induced EMT [22,23,24,25]. Remarkably, except for the uncharacterized miR-3965, all of the miRs that were significantly upregulated at 0.5% O2, concomitant with observed morphological changes, are known to be positively correlated or directly involved in EMT (Fig. 2D) [26,27,28,29,30,31,32,33,34,35]. Most notably, miR-221 and miRs-222 are directly involved in EMT [26, 27, 36,37,38].
Furthermore, other miRNAs with direct links to EMT were identified as significantly increased during LTHY (Fig. 2A, E) [39, 32]. Indeed, miR-145a-3p and miR-23a-3p, shown to promote EMT through the repression of CPEB1 and SEMAD6 respectively, were upregulated during LTHY which correlated with a reduction of their targets (Fig. 2F, G) [40, 41]. We observed a similar trend for miR-27a/b, another EMT inducing miR, although the impact on their known targets was less pronounced (Fig. S2C, D) [32,33,34,35, 39]. Other miRs in this cluster have all been linked to EMT [42,43,44]. Complimentarily, except for just few (identified with asterisk), all miRNAs downregulated in LTHY are known oncogenic, motility/invasion or EMT suppressors providing an even stronger case for LTHY-induced EMT. Of these, miR-146a-5p and miR-330 have been shown to promote apoptosis and reduce levels of Vim [45, 46]. Together, miRNA profiling across LTHY supports the hypothesis that spontaneous EMT occurs at 0.5% O2, but that the pathways leading to EMT may differ from canonical pathways. It should be noted that all miRNAs identified within these clusters share a high degree of sequence homology or the exact sequence to their human orthologs, which suggests a conservation of function, as is the case for microRNA regulatory circuits [47].
LTHY adaptation induces non-canonical EMTTo further investigate the LTHY-induced EMT-like state across hypoxic conditions at the mRNA level, we performed non-hierarchical clustering of DEGs followed by Gene Ontology (GO) term analyses to identify DEGs and assess potential functional pathways (Fig. 3A). Statistically significant enrichment for the EMT-associated phenotype “positive regulation of cell migration” was identified in clusters upregulated at 0.5% O2 and below (Fig. 3A) [48]. Additionally, genes ascribed to “negative regulation of cell adhesion” were significantly downregulated across LTHY, consistent with the increase in cell aggregation we observed at 0.5% O2 and below. Finally, these findings were further corroborated through Gene Set Enrichment Analysis (GSEA) analyses. While GSEA analyses revealed a significant enrichment for hypoxia adaptation (Fig. 3B), as expected, there was greater enrichment for EMT hallmark genes (Fig. 3C) as measured by Normalized Enrichment Score (NES), strengthening our hypothesis that LTHY induced EMT.
Fig. 3: Long-term hypoxia adaptation induces non-canonical EMT at the mRNA level.
A LTHY DEG k-means clustered heatmap. Gene expression normalized using row Z-score. Cluster number was determined using the elbow method. GO term enrichment was done using DAVID and cluster gene lists as input. Displayed GO terms are all significantly enriched (p < 0.05). B, C GSEA of LTHY 5% vs 0.1% DEGS. B Enrichment plot for Hallmark of Hypoxia. C Enrichment plot for Hallmark of Epithelial-Mesenchymal Transition. Normalized Enrichment Scores (NES) and statistical significance are found in each plot, as calculated by GSEA. D Expression values for genes associated with negative regulation of TGFβ and BMP signaling, and negative regulation of SMAD phosphorylation. E Expressions of EMT effector genes. F Expressions of potential EMT-driving genes. D–F Values are DESeq2 normalized reads, error bars are SD. * denotes relative significance as calculated by DESeq2 Benjamini–Hochberg adjusted p-value (padj). *padj < 0.05, **padj < 0.01, ***padj < 0.001.
Contrasting with these findings were some GO term analyses for clusters upregulated at 0.5% and 0.1% O2. Indeed, genes associated with negative regulation of TGFβ signaling, SMAD phosphorylation, and BMP signaling, all pointing to an inhibition of EMT, were enriched (Fig. 3A, D). This suggests a dampening of TGFβ signaling, a major EMT-inducing pathway, at the late LTHY stages [49, 50]. In line with this was the upregulation of negative TGFβ signaling genes (Fig. 3D). Together, these data suggest a non-canonical, TGFβ-independent induction of the EMT signature during LTHY [51].
To determine if this was the case, we first examined canonical EMT drivers. Most of the classical EMT-driving genes were either not expressed at all, or not differentially expressed across LTHY, suggesting they were not driving the LTHY-induced EMT-like state of the cells (Fig. S3A). However, significant upregulation of hallmark EMT effector genes (s100a4, Fn1, Col4a1, Col4a2, Col4a1, and others) was observed, confirming the EMT-like state of the cells (Fig. 3E). In addition, Vim was also upregulated at both 0.5% O2 and 0.1% O2 (Fig. S3B), although this upregulation was not significant (lowest padj = 0.13) and doesn’t match the increase observed at the protein level (Fig. 1F). This discrepancy, however, may be explained by the reduction in miR146a-5p, a known repressor of vimentin [52, 53]. It may also be that like miR-210-3p, Vim is also moderately upregulated at 5% O2 relative to normoxic conditions, thereby making the increases in expression non-significant. Finally, the E-to-N Cadherin switch, another EMT hallmark, was also dysregulated at the mRNA level; as E-cadherin (Cdh1) was not sufficiently expressed, and N-cadherin (Cdh2) was only moderately upregulated across LTHY, contrasting with results obtained at the protein level (Fig. S3C, Fig. 1F). Despite this, our data and analyses confirm the EMT-like state of the cells induced during LTHY and highlight potential non-canonical EMT pathways.
We therefore investigated potential drivers for this non-canonical EMT induction. To do so, we filtered for transcription factors (TFs) expressed at 0.5% O2 and below and cross-referenced them to EMT, allowing us to identify candidate drivers (Fig. 3F). Some of the TFs identified were of interest as they are related to EMT. However, most did not correlate with downstream effectors known to impact EMT/MET or follow the onset on EMT-like morphological changes. Indeed, while ETV4/5 have links to glycolytic adaptation and EMT, they have been shown to act through CXCR4 and S100A8/9 axes, both of which are not expressed in our system (zero mapped reads). CEBPD, another known TF with ties to EMT, has been shown to regulate Cdh1/2 as well as ZO-1 (Tjp1) expression in relation to TGFβ-driven EMT (Fig. S3C). However, these target genes did not change in expression in our setting pointing away from a canonical role for CEBPD in LTHY-induced EMT [54]. Furthermore, both Klf2 and Atoh8, which are considered as EMT inhibitors, were upregulated during LTHY adaptation conflicting with our morphological and biochemical assessment of B16 adapting to LTHY [55, 56]. However, Klf2 has been mostly characterized in TGFβ-driven EMT as a TGFβ signaling inhibitor, which we have here, and yet LTHY-adapted cells display a clear EMT transcriptional phenotype. Klf2 has also been shown to promote quiescence, which we did not observe throughout LTHY [56]. Finally, Atoh8 is another known EMT inhibitor known to act through SMAD3 to induce senescence. However, due to evident negative regulation of TGFβ signaling and continual cell growth throughout LTHY, it too was cast aside [57,58,59]. In contrast, Wt1 is well established in the literature as an EMT driver in both developmental and cancer settings and was the most significant DEG (>24 fold-change) in the dataset (Fig. 3F). In addition, Wt1 expression has been shown to be regulated by hypoxia through HIF1α [60]. However, its role in being involved in hypoxia induced EMT had yet to be characterized.
Gradual adaptation to severe hypoxia induces a novel Wt1 transcriptGiven the diversity of WT1 mRNA isoforms in humans and mice, we examined the RNAseq read coverage for the WT1 locus to identify which isoforms were expressed [14] (Fig. 4A, Fig. S4H, I). Surprisingly, there was no read coverage for the first five exons of WT1, with all reads mapping to the exon 6-10 region of the gene (Fig. S4A). We confirmed that unexpressed exons were present and without mutation in the B16-HG genome, confirming the genomic integrity of the locus (Fig. S4B and supporting material). RNAseq read coverage began 195 bp upstream of exon 6, within intron 5, suggesting that transcription was being initiated from a previously undescribed transcription start site (TSS). To investigate a potential promoter region upstream of the RNAseq read coverage, we performed a Transcription Factor Binding Site (TFBS) analysis across the entire 20 kb intron 5 sequence, considering only the transcription factors expressed at 0.5% O2 (Fig. 4B). With this approach, we identified several HIF1 binding sites (HREs) within intron 5 and determined that all these HREs were accessible to Hif1 by ChIP-qPCR (Fig. 4B, Fig. S4C). In addition, several other TFBSs for transcription factors expressed in the B16-HG cell line at 0.5% O2 were identified throughout the intron, suggesting extensive transcriptional regulation within intron 5 (Fig. S4D).
Fig. 4: The long-term hypoxia adaptation induces novel truncated Wt1 mRNA transcripts from an intronic HRE-driven promoter.
A LTHY read coverage of the Wt1 locus, at 0.1% O2 of the LTHY time course, generated in IGV. Number ranges are coverage depths at the nucleotide level. Histogram is representative of replicates (n = 2, n2 shown). Introns 1–4 are condensed for visual clarity. B Transcription Factor Binding Site analysis of murine Wt1 intron 5 from beginning of intron 5 to beginning of RNAseq read coverage for Wt1. Only considered TFBSs with a score ≥ 0.95. Intron 5 sequence is broken into 40 bins, ~500 bp/bin. Analysis done using TFBStools in R. C FACS samples of the empty promoter-reporter construct, and the wild-type (WT) across the LTHY time course. Gate represents mCherry+ gate used for promoter activity calculations. FACS plots are representative of their triplicates. D Functional investigation into tWT1 promoter subregions. “Dist”: Distal region. “P1”: Proximal subregion 1. “P2”: Proximal subregion 2. “pT”: Poly-Thymine stretch. +: DNA region is present. −: DNA region is not present. M: DNA region has specific TFBSs scrambled. Promoter activity calculated using a ratio ZsGreen expression in transduced cells relative to untransduced cells, normalized to their normoxic counterparts. Significance calculated using 2-way ANOVA with Tukey’s multiple comparisons. Black stars represent intra-construct statistical comparisons; only reporting statistics relative to 5% O2. Blue stars represent significance relative to WT at 0.1% O2. Other comparisons are not shown for visual clarity. E Functional investigation into the P1 subregion of the tWt1 promoter at 0.1% O2. Promoter activity was calculated as in D. Statistics are a 2-way ANOVA with Tukey’s multiple comparisons test. Black stars represent statistical comparisons. Blue stars represent significance relative to WT at 0.1% O2. Other comparisons not shown for visual clarity. D, E “-“: an absence of subregion. “+“: presence of wild-type sequence. “M”: Transcription factor binding sites listed in Fig. S4F are scrambled. *p < 0.05. **p < 0.01. ***p < 0.001 ****p < 0.0001.
Given the hypoxia-dependent nature of Wt1 upregulation and the binding of Hif1 to intron 5 HREs, we investigated whether the genomic region upstream of the RNAseq coverage constituted a functional promoter. To do so, we developed a reporter construct, which constitutively expresses mCherry and where ZsGreen expression is driven by the putative promoter or variants thereof (Fig. S4E). The putative promoter encompassing 551 bp upstream of the TSS, was broken down into four distinct regions (Fig. S4F). Upstream from the TSS, the first region is the poly-thymine (PolyT) stretch due to its sequence composition. Beyond this is the proximal region, which was subdivided into P1 and P2, and the distal region, which contains a long poly-AG stretch. It is important to note that we observed no changes in the expression of all the transcription factors associated with the TFBSs in these regions, apart from Nr4a2 downregulation (Fig. S4G).
To gain insights into the transcriptional regulatory ability of each subregion and TFBS, we built a panel of promoters consisting of either subregion deletions or TFBS mutation. We then performed a transcriptional activity screen in B16 cells and monitored mCherry and ZsGreen expression across LTHY. As control, the cells were cultured in parallel in normoxic conditions. As expected, the “empty” version of the promoter-reporter system did not respond to LTHY (Fig. 4C, D). Contrastingly, the “wild-type” putative promoter induced ZsGreen in a pattern that mimicked the kinetics of Wt1 during LTHY, demonstrating its role as a hypoxia-sensitive promoter (Fig. 4C, D). Conversely, when all the P1 TFBSs were mutated, we observed a significant and substantial reduction in ZsGreen levels, suggesting its role as the main driver of LTHY-induced Wt1 expression. Intriguingly, when the P2 TFBSs were mutated, expression levels of ZsGreen significantly increased, suggesting a role as a negative regulator of transcription (Fig. 4D). The distal region also appears to possess some transcriptional activity, as there was a small but significant increase in ZsGreen levels when it was the only constituent of the putative promoter.
Finally, we mutated each HRE within P1 to assess their individual role in regulating tWt1 expression during LTHY. Our data indicates that while both HREs contribute to the promoter activity, HRE #2 seems to possess greater transcriptional activity as a standalone element (Fig. 4E). Mutation of the RUNX1 and NFATC2 sites minimally altered ZsGreen expression in the context of HRE-deficient conditions indicating they were non-functional in this context. Together, our data establishes the genomic region within intron 5 of murine WT1 as a bona fide hypoxia-sensitive promoter through necessary and sufficient HIF1 binding sites, can initiate transcription of Wt1 at 0.5% O2, and increase transcriptional activity as cells adapt to more severe hypoxia.
Identification and characterization of truncated Wt1 transcriptsNext, we investigated the functionality of the novel truncated Wt1 (tWt1) transcripts as RNAseq coverage analyses revealed the presence of exonic spikes and read junctions suggesting a mature mRNA. These analyses also revealed a novel splicing event joining the 3’ end of intron 5 to the 5’ end of exon 7 leading to a novel RNA which excludes exon 6 (Fig. 5A). Canonical exon 6 to exon 7 splicing was also observed in some transcripts but constituted the minority of splicing events. Our analyses also identified the known KTS splicing event, which introduces a lysine-threonine-serine motif between zinc fingers 3 and 4 of WT1 between exons 9-10, at a near 1:1 frequency, in line with previous reports [14, 61]. The novel splicing site within intron 5 occurred 58nt upstream of exon 6 (Fig. S5A). Interestingly, when either splicing event occurs, it adds an intronic sequence to the beginning of the tWt1 mRNA transcripts upstream of exon 6 or exon 7, and introduces potential start codons (Fig. 5B, Fig. S5A). Based on the observed splicing events, there are four possible mRNA species, named for their first canonical exon (E6, E7), and the presence of the KTS motif (E6K, E7K) (Fig. 5C).
Fig. 5: Novel truncated Wt1 transcripts encode efficiently translated proteins that accumulate in the nucleus.
A Splicing events observed in LTHY data. Percentages are the average between replicates, coverage depths are overlaid. B Potential open reading frames (ORFs) derived from the tWt1 intron 5 sequence in E7 isoforms. Purple: Intron 5 derived sequence. Orange: Exon 7 derived sequence. Bold: Canonical WT1 ORF (third ORF). Bright-green/dark-green: In/out of frame start codons. Red: Stop codons. C Possible tWt1 isoforms. Purple: Intronic sequence. Orange: Exonic sequence. Blue: KTS motif. D GFP levels of DOX-induced expression of tWT1-GFP isoforms in B16 cells. E Microscopy images of tWT1-GFP fusion constructs. Nuclear staining was performed using Hoechst 33342 (Thermo FIsher: H1399) as per the manufacturers protocol. F Western Blot of HEK cells expressing DOX inducible GFP or E7K-tWT1-GFP. Top: anti-Calnexin. Bottom: anti-GFP. G Mass Spectrometry (MS) coverage of E7K-tWt1 purified from HEK cells. Refer to the legend for full annotation.
To determine whether any of these tWt1 transcripts could be translated to produce functional protein, we fused each of them to a C-terminal, ATG-deficient, GFP in doxycycline-inducible lentiviral vectors (Fig. S5B). This ensures fluorescence only occurs via an in-frame functional start codon within the tWt1 transcript (Fig. S5C). Cell lines stably expressing the various tWt1 transcripts were treated with doxycycline and analyzed by FACS to determine the level of tWt1-GFP expression, while subcellular localization was determined by confocal microscopy. (Fig. 5D, E). Following Dox induction, both the E7 and E7K variants produced a robust GFP signal and were localized to the nucleus, as expected based on WT1, with E7K displaying clear nucleolar accumulation, a known attribute of KTS + WT1 isoforms [
留言 (0)