
記住我


This study was approved by the Institutional Review Board and informed consent was required from every enrolled patient.
Study patientsFor MRI-based radiomics model construction, a total of 158 pathologically confirmed cHCC-CCA patients who underwent surgical resection in Zhongshan Hospital and Shanghai Geriatric Medical Center between January 2019 and December 2021 were retrospectively enrolled by following inclusion criteria: (1) pathologic diagnosis of cHCC-CCA based on the 2019 WHO classification; (2) preoperative contrast-enhanced MRI performed within 2 weeks; and (3) solitary lesion without intrahepatic metastasis or multiple origins. Forty patients were excluded according to the following criteria: (1) any preoperative treatment prior to MRI; (2) insufficient MR image quality; (3) incomplete pathological description data; and (4) presence of macrovascular invasion. Finally, 118 patients were included in our study and were randomly divided into the training set and a validation set in a ratio of 7:3 (Fig. 1a).
Fig. 1
Flowcharts of the patient recruitment process. a Training set and validation set. b Test set. cHCC-CCA, combined hepatocellular carcinoma-cholangiocarcinoma
For prospective biologic verification of the radiomics model, 25 pathologically confirmed cHCC-CCA patients who underwent surgical resection with RNA sequence data from March 2022 to December 2022 according to the above-mentioned inclusion criteria were enrolled (Fig. 1b), which were named as a test set. This data set was also included in an unpublished paper aiming to explore specific biological portraits of each component in cHCC-CCA.
Clinicopathological data evaluationRelevant clinical and pathological data of cHCC-CCA patients were retrieved from medical records retrospectively or prospectively, including age, gender, hepatitis virus infection, tumor size, tumor biomarkers (AFP, CEA, and CA 19-9), and MVI status (MVI + refers to a tumor nest of ≥ 50 suspended tumor cells found within the lumen of the endothelium-lined vessels which is visible only at microscopy). For the evaluation of MVI status, hepatectomy specimens from each patient were viewed microscopically by two pathologists independently.
MRI technique and conventional MR image analysisAll MR images were acquired via a 1.5-T MR scanner (uMR 560, United Imaging Healthcare). Gadobutrol (Gadavist; Bayer HealthCare) was intravenously administered at a rate of 2 mL/s for a total dose of 0.1 mmol/kg. Routine contrast-enhanced MR imaging protocol included T1-weighted in-phase and out-of-phase sequences, transverse T2-weighted fast spin-echo sequence, diffusion-weighted imaging (DWI) with b values of 0 s/mm2, 50 s/mm2, and 500 s/mm2, pre- and post-contrast three-dimensional T1-weighted imaging at arterial phase (20–30 s), portal venous phase (70–90 s), and delayed phase (160–180 s). All detailed parameters of each sequence were previously reported [10].
The MRI images were analyzed by two experienced radiologists, C.Y. and C.W.Z., with 15 years and 14 years of expertise in abdominal imaging analysis, respectively. In case of any discrepancies between the two radiologists, a consensus was achieved through thorough discussion. The evaluation focused on several contrast-enhanced MR features, including enhancement patterns (nonrim arterial phase hyperenhancement (APHE) and rim APHE), washout patterns (nonperipheral washout and peripheral washout), enhancing capsule, delayed central enhancement, and corona enhancement. Additionally, intratumoral hemorrhage, fat deposition, restriction diffusion status (present or absent, rim or nonrim), cholangiectasis, a nodule in nodule architecture, mosaic architecture, and hepatic capsule retraction were also assessed. Targetoid appearance was defined as the presence of any of the following features: rim APHE, peripheral washout, targetoid restriction, and delayed central enhancement. The detailed definitions of these MR features can be found in Table S1.
Radiomics analysisA radiologist (Y.Y.X., with 7 years of abdominal imaging analysis experience) performed tumor segmentation by ITK-SNAP software, these segmentation results were checked by a senior radiologist (C.Y., with 15 years of abdominal imaging analysis experience. Volumes of interests were manually delineated on six sequences of pre-T1WI, AP, PVP, DP, T2WI-FS, and DWI with b values of 500 s/mm2. In addition, MR images of randomly selected 30 lesions were delineated again after 1 month by Y.Y.X. to assess the intra-observer reproducibility, and these 30 MRI images were also delineated by another radiologist (C.W.Z., with 14 years of abdominal imaging analysis experience) independently to evaluate inter-observer reproducibility.
All MR imaging voxels were isotropically resampled to 1 × 1 × 1 mm3 to eliminate acquisition-related voxel heterogeneity. Radiomic features were extracted using the uAI Portal (version: 20230715), in which the PyRadiomics tool was embedded, and the Z-score method was used to acquire normalized values of the radiomic features.
Follow-up of recurrence-free survival (RFS) and overall survival (OS)The RFS time referred to the time interval from surgery to the date of recurrence, death or the last follow-up, while the OS time was defined as the time interval from the surgery to death, the date of the last follow-up or the study end date of July 31, 2023.
Statistical analysisIntra- and inter-observer reproducibility was evaluated by using intraclass correlation coefficient (ICC), and radiomic features with ICC ≥ 0.80 in both intra- and inter-observer settings were selected for further analysis. The Spearman correlation analysis, max-relevance and min-redundancy, and least absolute shrinkage and selection operator methods were successively performed to obtain optimal radiomic features. Uni- and multivariate logistic regression analysis were used to develop a clinical-imaging model in the training set. The diagnostic performance parameters of each predictive model, such as the area under the receiver operating characteristic curves (AUC), sensitivity, specificity, accuracy, precision, and F1-score, were calculated. Delong test and McNemar’s test were performed to compare AUCs, accuracy, sensitivity, and specificity, respectively, and the false discovery rate (FDR) was corrected using the Benjamini–Hochberg method. Hosmer–Lemeshow goodness-of-fit test was performed, and calibration curves were then generated. A decision curve was used to evaluate the clinical practicability.
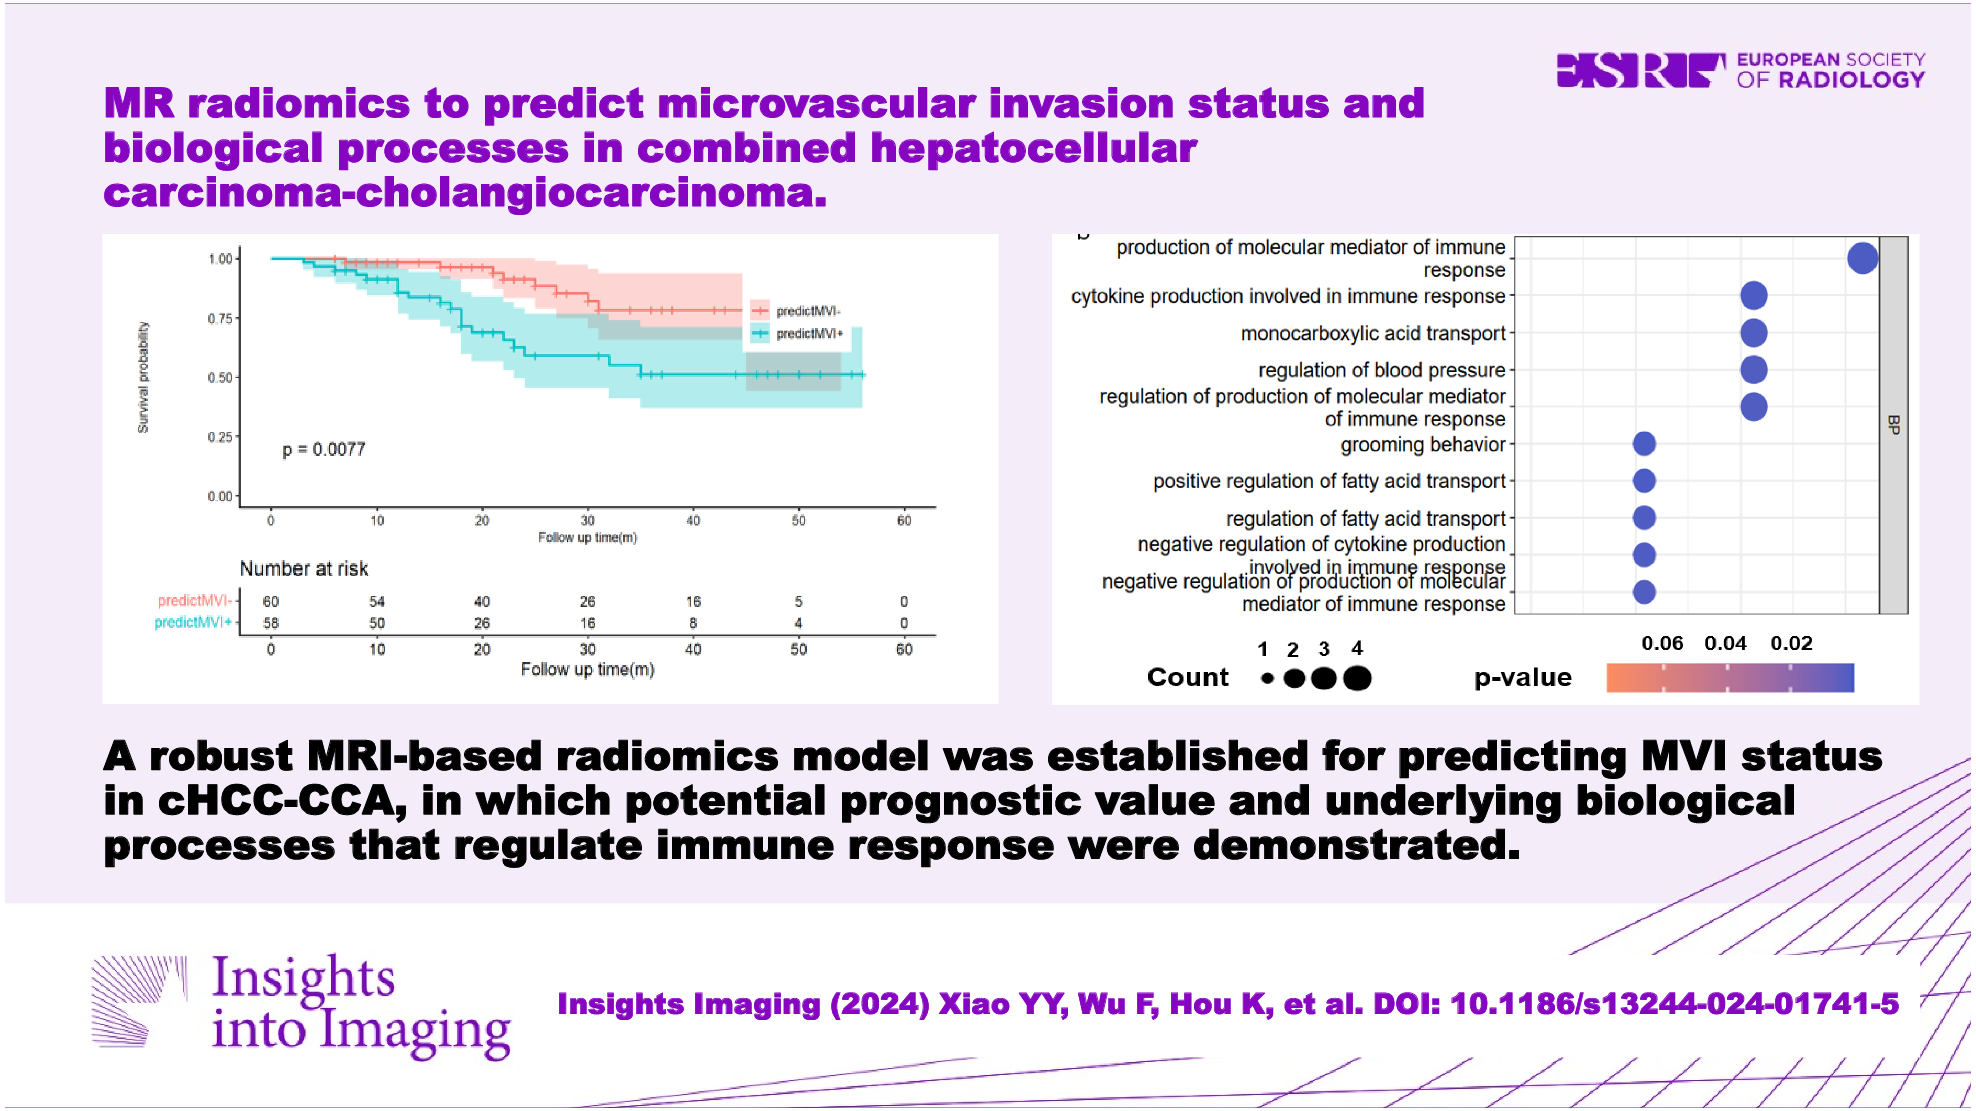
Patients in the prospective RNA sequencing group were divided into low- and high-score groups according to the lower quartile of radiomic score. We then used the DESeq2 package to identify differentially expressed genes (DEGs) with |log2 (fold change)| > 1 and FDR-adjusted p < 0.05 between the low- and high-score groups. Statistically significant DEGs were then used to identify distinct gene ontology (GO)-based biological processes. GO highlights the most DEGs and finds the systematic linkages between those genes and biological processes.
Continuous variables were compared using the student t-test, ANOVA, Mann–Whitney U-test or Kruskal–Wallis H-test, and categorical variables were compared using the χ2 test or Fisher’s exact test among different groups. Survival curves were generated and compared by the Kaplan–Meier method and log-rank test. Statistical analyses were performed using R software (version 4.1.1). p values less than 0.05 were indicative of a statistical difference.
留言 (0)