
記住我
A retrospective analysis was conducted on 114 patients with acromegaly (112 untreated patients and 2 postoperative patients with active acromegaly) who were hospitalized at Osaka University Hospital from April 2004 to January 2020, including patients from a previous study [1]. The diagnosis of acromegaly was determined based on clinical features, serum GH levels that remained unsuppressed to < 0.4 ng/ml in the 75-g OGTT, insulin-like growth factor-1 (IGF-I) levels that exceeded the upper limit of normal, and the identification of a pituitary tumor on magnetic resonance imaging (MRI). The study population consisted of 60 women and 54 men with a median age of 54 years [interquartile range (IQR), 42 to 60 years] and a body mass index of 24.2 kg/m2 (IQR 22.1 to 26.8). The human ethics committee of Osaka University approved the study (approval no. 16136), which was conducted in accordance with the Declaration of Helsinki.
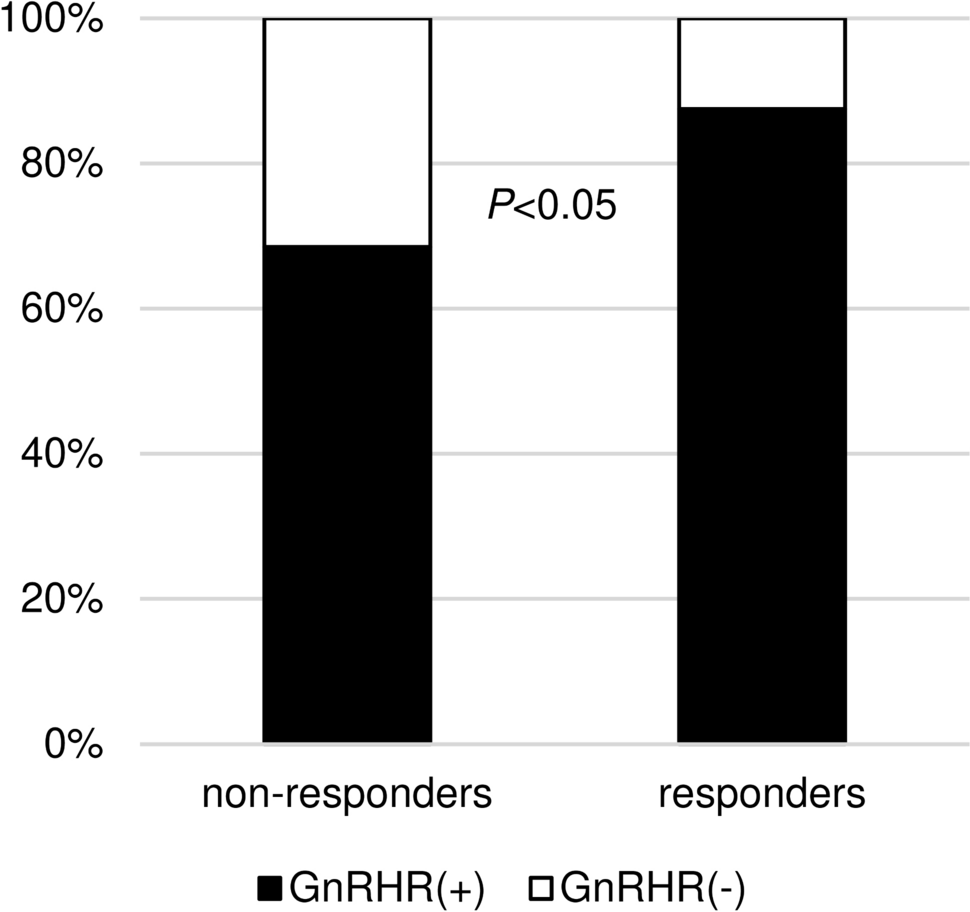
Endocrinological evaluationFasting basal serum GH and IGF-I, LH, and FSH levels were measured without acromegaly medical treatment including fg-SRL and pituitary surgery. GH was measured before and 30, 60, 90, and 120 min after 0.1 mg of LHRH loading. It was reported that LHRH had less impact on GH secretion in LHRH nonresponders [5]. An increased GH response to 0.1 mg of LHRH loading was defined as a 30% increase in the peak serum GH level from the basal GH level after LHRH loading because there was a significant difference of GnRHR expression in pituitary tumors between LHRH responders with ≥ 30% of GH increase and LHRH nonresponders (Fig. 1). A paradoxical GH response to the 75-g OGTT was defined as a 20% or 30% increase in the serum GH level from the basal GH level after OG loading [1, 3, 7]. Similarly, an increase GH response to 0.5 mg of TRH loading was defined as a 100% increase in the serum GH level [2]. The response to 2.5 mg of oral bromocriptine or 50 µg of subcutaneous octreotide was also evaluated and expressed as a percentage: (nadir GH level − basal GH level)/basal GH level. The serum GH levels were measured before and 1, 2, 4, 6, 8, 12, and 24 h after bromocriptine or octreotide administration. The OGTT and bromocriptine and octreotide tests were performed in 111, 111, and 112 patients, respectively. The serum GH level was measured using an immunoradiometric assay kit (GH kit Daiichi; Daiichi Radioisotope Laboratories, Tokyo, Japan) until April 2007, by a chemiluminescent enzyme immunoassay kit (Access hGH kit; Beckman Coulter, Tokyo, Japan) until April 2017, and by an Electro Chemiluminescence Immunoassay kit (ECLusys hGH; Roche Diagnostics, Tokyo, Japan) until the end of the study. The measured values were adjusted using a correlation formula estimated by a linear regression model. The GH levels measured by the first and second kits were converted to values consistent with the third kit using the following formula: y = 1.4x (y: value used for judgment, x: measured value by the first and second kits). The GH levels using the third kits were directly employed without necessitating any form of adjustment. The IGF-I level was measured using an immunoradiometric assay kit (Daiichi Radioisotope Laboratories) until October 2019 and an Electro Chemiluminescence Immunoassay kit (ECLusys IGF-1; Roche Diagnostics, Tokyo, Japan) until the end of the study. The standard deviation score of IGF-1 (IGF-1 SD score) was calculated using the standardized centile curves and reference intervals of IGF-1 levels in a healthy Japanese population [8]. Three of seven patients without pituitary surgery were treated by only fg-SRL. On the other hand, preoperative fg-SRL treatment for 31 patients were performed. Additionally, 54 (50%) and 27 (25%) of 107 patients with pituitary surgery for acromegaly at our hospital could achieve remission (both nadir GH after OGTT < 0.4 ng/ml and normal IGF-1) and control (both nadir GH after OGTT ≥ 0.4 ng/ml and normal IGF-1), respectively. Fg-SRL treatment after surgery were provided for 21 patients including 12 patients with fg-SRL before surgery. Therefore, we analyzed the preoperative fg-SRL data in 12 patients with both preoperative and postoperative fg-SRL treatment. Finally, we investigated the difference of response, modality, and duration of fg-SRL therapy between the LHRH responders and nonresponders, in 43 cases with fg-SRL (without pituitary surgery: 3 cases, preoperative: 31 cases, postoperative: 9 cases). The modalities were daily octreotide 100 μg, or octreotide long-acting release (LAR) 10–30 mg or lanreotide 60–120 mg, every 4 weeks (Table 1). The response to fg-SRL therapy was evaluated and expressed as a percentage as follows: (nadir IGF-1 level − basal IGF-1 level)/basal IGF-1 level. We investigated the fg-SRL efficacy in short term because the limited subjects in our cohort were not enough to evaluate that in long term. Therefore, nadir IGF-1 level was defined as the minimum level 1–3 months (median month: 3) after initiation of fg-SRL therapy. Additionally, we compared the difference of fg-SRL efficacy between LHRH responders and nonresponders in only OGTT paradoxical nonresponders for excluding the influence of overlap with OGTT paradoxical responders with ≥ 20% increased response to OGTT.
Fig. 1
Histopathological classification by GnRHR expression, in LHRH nonresponders and responders
Table 1 Treatment modality and duration in the evaluation of fg-SRL efficacy of LHRH nonresponders and respondersImmunohistochemical evaluationPathological evaluation was performed in 105 patients who underwent surgery at our hospital, and tumor tissues were obtained, including 31 patients investigated after preoperative fg-SRL treatment. Immunohistochemical studies were performed using the DAKO Autostainer Link 48 system (EnVision FLEX Mini kit, High pH, K8023; Dako A/S, Glostrup, Denmark). The sections were incubated with anti-SF-1 (Perseus Proteomics Cat# PP-N1655-0C, RRID:AB 2904221), anti-GnRHR (Abcam Cat# ab183079, RRID:AB 3083538), anti-LH (Agilent Cat# M3502, RRID:AB 2135325), anti-FSH (Agilent Cat# M3504, RRID:AB 2079146), anti-cytokeratin (BD Biosciences Cat# 349205, RRID:AB 2134314), anti-SSTR2A (Abcam Cat# ab134152, RRID:AB 2737601), and anti-SSTR5A (Abcam Cat# ab109495, RRID:AB_10859946). The transcription factor SF-1 was considered as positive when the cell nuclei of some cells were stained (Fig. 2). Positive for GnRHR, LH and FSH expression was defined as stained cell cytoplasm (Fig. 2). We evaluated the cytoplasmic distribution of cytokeratin and somatostatin receptor (SSTR) 2 expression as fg-SRL efficacy factors [9]. The cytoplasmic distribution of cytokeratin was classified into the densely granulated (DG) type, sparsely granulated (SG) type, and intermediate (IM) type, a mixture of both DG and SG, by immunostaining with CAM5.2 [10] (Fig. 2). SSTR2 and SSTR5 expression was assessed using the immunoreactive score (IRS), as previously published [11, 12]. Briefly, the IRS (0–12) is the product of the percent immunoreactivity score (0, 0% stained cells; 1, < 10%; 2, 10–50%; 3, 51–80%; 4, > 80%) and the staining intensity score (0, absent; 1, weak; 2, moderate; 3, strong). The median SSTR2 IRS in the entire cohort was 10.5 (IQR 4.5 to 12). The median SSTR5 IRS in the entire cohort was 8.5 (IQR 0.75 to 12).
Fig. 2
Representative immunohistochemistry in pituitary tumors of acromegaly. a Densely granulated type, b Sparsely granulated type, c Positive for SF-1, d Negative for SF-1, e Positive for GnRHR, f Negative for GnRHR, g LH and h FSH
Evaluation of pituitary tumors on magnetic resonance imaging (MRI)Radiological data were recorded on MRI scans obtained at diagnosis in 112 untreated patients. We measured the maximum diameter of the pituitary tumor. The T2-weighted MRI signal intensity of the tumor was assessed as an fg-SRL efficacy factor [13]. According to a previous study, we defined T2-weighted hypointensity in the pituitary tumor as a signal intensity lower than that of the white matter [13]. T2-weighted hyperintensity in the tumor was defined a signal intensity greater than that of the gray matter. T2-weighted isointensity in the tumor was defined as a signal intensity that was both greater than that of the white matter and lower than that of the gray matter. In 2 postoperative cases, because of MRI evaluation at the previous hospital, we could not confirm their pituitary tumor image at diagnosis. Therefore, these two cases were excluded from the analysis of radiological findings.
Statistical analysisData on the clinical features are presented as the median and IQR (first and third quartiles). Differences between groups were analyzed using the χ2 test and Wilcoxon test. Correlation analysis was evaluated by Pearson’s correlation coefficient. P = 0.05 was considered to denote statistical significance. JMP Pro software, version 17.1.0, for Windows (SAS Institute, Cary, NC) was used for all analyses.
留言 (0)