
記住我
Sixty-nine patients were included in the study, 44 females (64%) and 25 males (36%), with a median age of 54 years (IQR 45–64) at the time of first available MRI. In 19 patients, the first available MRI was performed at the time of diagnosis, while in 50 patients it referred to a follow-up investigation (median time from diagnosis to first analyzed MRI: 21.5 months [IQR 1.0-100.8]).
Median age-adjusted IGF-1 value was 1.1 xULN (IQR 0.8–1.9), and 31 patients (44.9%) were considered as having biochemical control.
Median GH level was 2.9 µg/L (IQR 1.1-9.0); as expected, GH values showed a strong and positive correlation with both absolute IGF-1 (rho: 0.722, p < 0.001) and IGF-1 xULN values (rho: 0.681, p < 0.001). Noteworthy, total testosterone levels (available in 20 male patients) were inversely correlated with both absolute IGF-1 and IGF-1 xULN values (rho: -0.794 and rho: -0.787, respectively; p < 0.001). Controlled patients had significantly higher total testosterone levels (median 330 ng/dl, IQR 251–456) compared to patients with active disease (169 ng/dl, IQR 101–255; p = 0.002).
Fifteen patients had hyperprolactinemia (21.7%), which was mild in most cases, thus requiring treatment with the dopamine-agonist cabergoline (CAB) only in five individuals.
Patients’ characteristics are summarized in Table 1 (see Online Resource 1 for more details).
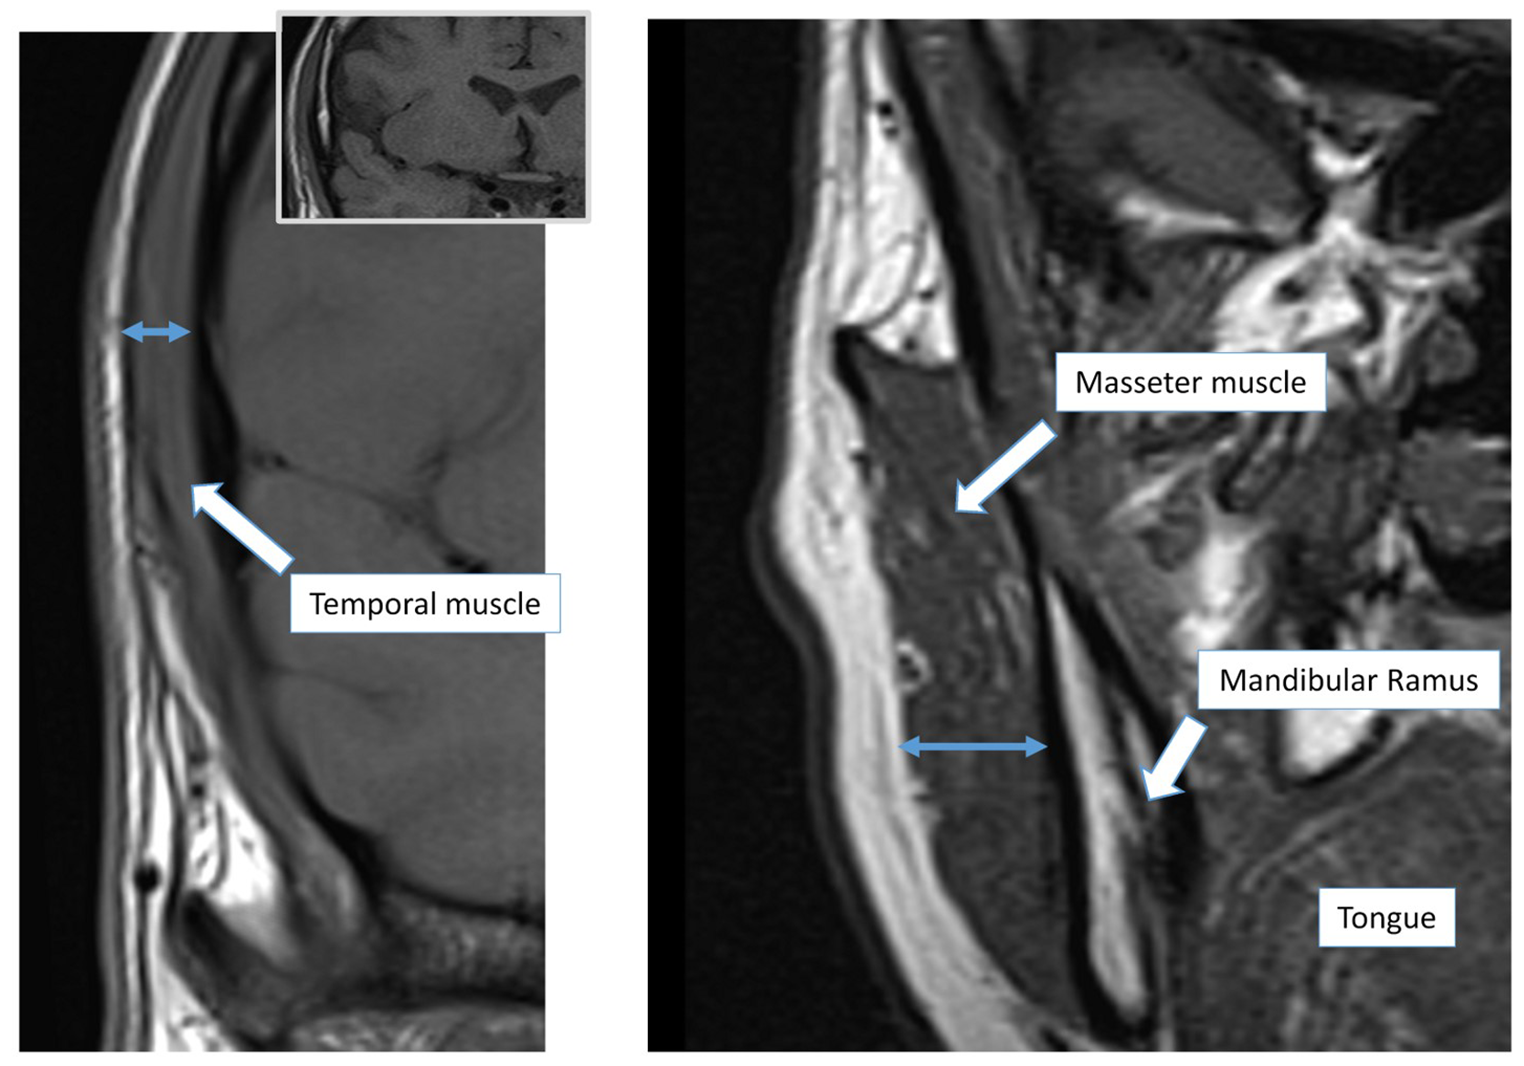
Temporal and masseter muscle thickness at first available MRIMedian temporal muscle thickness (TMT) was 6.1 mm (IQR 5–7), being significantly higher in males (6.9 mm, IQR 5.7–7.5) compared to females (6.0 mm, IQR 4.5–6.5; p = 0.001) (Fig. 2A). Median masseter muscle thickness (MMT) was 15.1 mm (IQR 12.9–17.7), with significantly higher values in males (17.6 mm, IQR 13.7–20.5) than in females (14.9 mm, IQR 12.5–16.5; p = 0.016) (Fig. 2B-C).
Fig. 2
Differences in TMT and MMT measurements according to sex and disease activity in patients with acromegaly (first available MRI). Sex-related differences are depicted in panels A and B. In panel C, two representative images of MMT evaluation in a female (left) and a male (right) patient, matched for age and IGF-1 xULN values, are reported. Differences based on patients’ disease status (controlled [IGF-1 ≤ 1 xULN] vs. active disease [IGF-1 > 1 xULN]) are depicted in panels D and E. In panel F, two representative images of MMT evaluation in two male patients, with different disease activity at the time of radiological examinations, are reported. Abbreviations. TMT, temporal muscle thickness; MMT, masseter muscle thickness; MRI, magnetic resonance imaging; yrs, years; ULN, upper limit of normality
Overall, TMT showed a significant positive correlation with MMT (rho: 0.497, p < 0.001; n = 60). This correlation was maintained when analyzing the subgroup of female patients (rho: 0.529, p < 0.001; n = 40), while statistical significance was lost in the smaller subgroup of male patients (rho: 0.278, p = 0.234; n = 20). At univariable regression analysis, TMT and MMT were positively associated (adjusted R2 0.245, B 0.935, β 0.508; p < 0.001).
Age of patients at the time of first available MRI did not correlate with either TMT (rho: 0.066, p = 0.595) or MMT (rho: -0.046, p = 0.720).
Although patients with cancers can present with reduced muscle mass, TMT and MMT were not significantly different in patients with a clinical history of cancer compared to those individuals with no cancer reported in clinical charts (p = 0.491 and p = 0.767; respectively).
Sleep apnea syndrome (SAS) is frequently encountered in acromegaly, and it was reported in seven patients of our cohort (10%). Taking into account this low number of individuals with SAS, median TMT (p = 0.420) and MMT (p = 0.068) values did not significantly differ between patients with and without SAS. However, MMT values were numerically higher in patients with SAS compared to those without (18.3 [14.8–20.6] mm vs. 15.0 [12.6–17.5] mm).
TMT and patients’ characteristics at first MRIAt first available MRI, TMT showed a significant positive correlation with IGF-1 xULN values (rho: 0.249, p = 0.047), although TMT values did not significantly differ between active disease and controlled patients (median 6.15 mm, IQR 4.95–7.4 vs. 6.0 mm, IQR 4.5–6.63; p = 0.088) (Fig. 2D). This finding was also confirmed setting the IGF-1 cut-off at 1.3 xULN, 2.0 xULN, and even when stratifying patients as of every ULN interval (e.g. 2-fold, 3-fold, etc.). No significant correlations were found between TMT and absolute IGF-1 (rho: 0.227, p = 0.070), GH (rho: 0.216, p = 0.124), or total testosterone levels (rho: -0.288, p = 0.247). The presence of hypogonadism did not have a significant impact on TMT (hypogonadal patients 6.0 [4.7-7.0] mm, vs. eugonadal patients 6.0 [4.9–6.7] mm; p = 0.855). No significant correlation was found between TMT and patients’ weight (rho: 0.228, p = 0.064), height (rho: 0.243, p = 0.058) or BMI (rho: 0.086, p = 0.509).
TMT was higher in patients who had a first MRI closer to the time of diagnosis (i.e. TMT vs. time from diagnosis to first MRI: rho − 0.315, p = 0.010).
The presence of hyperprolactinemia, treated hypocortisolism and hypothyroidism, or diabetes mellitus did not significantly affect TMT (all p values > 0.05). Glycated hemoglobin levels showed no statistically significant correlation with TMT (rho: -0.020, p = 0.875).
MMT and patients’ characteristics at first MRIPatients with active disease at the time of first available MRI had significantly higher MMT values compared to controlled subjects (median 16.2 [14.4–19.0] mm vs. 13.8 [12.4–17.4] mm; p = 0.044; Fig. 2E-F), and MMT showed a significant positive correlation with both absolute IGF-1 (rho: 0.393, p = 0.002) and IGF-1 xULN values (rho: 0.413, p = 0.001). Sex distribution among active disease and controlled patients was almost superimposable (Chi square test, p = 0.376). Of note, stratifying patients as of IGF-1 xULN > 2 and IGF-1 ≤ 2 xULN (i.e. clearly uncontrolled disease vs. controlled/mild disease), the difference in MMT values between the two groups was strongly significant (median 17.4 [15.1–19.8] mm vs. 14.7 [12.5–17.3] mm; p = 0.005).
MMT was higher in patients who had a first MRI closer to the time of diagnosis (i.e. MMT vs. time from diagnosis to first MRI: rho − 0.368, p = 0.004). Furthermore, MMT showed a significant positive correlation with GH values (rho: 0.432, p = 0.002). No statistically significant correlation was found between MMT and total testosterone levels (rho: -0.451, p = 0.053). The presence of hypogonadism did not significantly affect MMT (hypogonadal patients 15.2 [12.8–17.5] mm vs. eugonadal patients 16.5 [12.5–18.3] mm; p = 0.766). MMT showed a positive and significant correlation with both patients’ weight (rho: 0.307, p = 0.015) and height (rho: 0.346, p = 0.006), while no correlation was found with BMI (rho: 0.200, p = 0.139).
Hyperprolactinemia, treated hypocortisolism and hypothyroidism, as well as diabetes mellitus and glycated hemoglobin levels did not have a significant impact on MMT (all p values > 0.05).
Analysis of all available MRIsConsidering all the MRIs analyzed (n = 182), a proper measurement of TMT and MMT was possible in 180 and 158 images, respectively. TMT and MMT values were significantly correlated (rho: 0.526, p < 0.001, n = 156). This correlation was maintained when analyzing both the subgroup of female (rho: 0.516, p < 0.001, n = 102) and male patients (rho: 0.345, p = 0.011, n = 54) (Online Resource 2). At univariable regression analysis, TMT and MMT were positively associated (β 0.540; p < 0.001).
Median TMT and MMT values were higher in males compared to females (TMT: 6.5 [5.5–7.5] mm vs. 5.0 [4.5–6.6] mm, p < 0.001; MMT: 17.5 [14.5–20.5] mm vs. 14.0 [12.5–16.0] mm, p < 0.001). Age at the time of each MRI did not correlate with either TMT or MMT (rho: -0.008, p = 0.915 and rho: -0.079, p = 0.330; respectively).
TMT showed a significant positive correlation with absolute IGF-1 (rho: 0.182, p = 0.015) and IGF-1 xULN values (rho: 0.193, p = 0.010), while no significant correlation was found with GH levels (rho: 0.104, p = 0.226). No significant correlation was found between TMT and total testosterone values in males (rho: -0.061, p = 0.650), and the presence of hypogonadism did not have a significant impact on TMT (hypogonadal patients 5.8 [4.5–6.7] mm vs. eugonadal patients 5.5 [4.7–6.9] mm; p = 0.599).
As concerns MMT, we observed a significant positive correlation with absolute IGF-1 (rho: 0.273, p = 0.001), IGF-1 xULN values (rho: 0.269, p = 0.001), as well as GH levels (rho: 0.213, p = 0.019). No significant correlation was found between MMT and total testosterone values in males (rho: -0.190, p = 0.195), and the presence of hypogonadism did not have a significant impact on MMT (hypogonadal patients 14.8 [12.7–17.0] mm vs. eugonadal patients 15.0 [12.7–17.9] mm; p = 0.519).
Longitudinal evaluation of TMT and MMTIn patients with at least two MRI evaluations, median time from first to last available MRI was 49 months (IQR 19.0-70.7). Overall, TMT and MMT did not change significantly over time (p = 0.157 and p = 0.472; respectively). Detailed measures are reported in Online Resource 3.
However, when considering the subgroup of patients with at least two MRI evaluations and active disease (IGF-1 > 1 xULN) at the time of first MRI (MRI 1), we observed a statistically significant decrease of MMT values during the repeated MRIs (MMT baseline 16.9 [14.5–19.5] mm, MMT nadir 12.5 [11.5–14.8] mm; p = 0.044, Online Resource 3; Fig. 3A). Of note, we found a consensual significant reduction of IGF-1 xULN levels over time (baseline 2.3 [1.3–3.3] xULN, nadir 0.76 xULN; p < 0.001, Fig. 3A). As concerns TMT, a numerical decrease was observed over time (baseline value 6.5 [6.1-8.0] mm, nadir 4.5 [3.0-7.5] mm), but this difference was not statistically relevant; p = 0.111 (Online Resource 3, Fig. 4B).
Fig. 3
Longitudinal evaluation of MMT and TMT in the patient subgroup with at least two MRI evaluations and active disease (IGF-1 > 1 xULN) at the time of the first MRI (MRI 1) (panels A-B). A statistically significant decrease of MMT values was observed during the repeated MRIs, with a consensual significant reduction of IGF-1 xULN over time (panel A). Abbreviations. TMT, temporal muscle thickness; MMT, masseter muscle thickness; MRI, magnetic resonance imaging; ULN, upper limit of normality
Fig. 4
Semi-quantitative evaluation of temporal and masseter muscle fatty infiltration. Patients with a Goutallier grade 1 (remarkable muscle fatty infiltration) were significantly older compared to individuals with normal muscle quality (grade 0). Data depicted in panels A-B refer to the evaluation of all available MRIs. The prevalence of MRIs scored as grade 0 or grade 1 did not change significantly during repeated measurements over time for both temporal and masseter muscles (panels C-D). Abbreviations. TMT, temporal muscle thickness; MMT, masseter muscle thickness; MRI, magnetic resonance imaging
Determinants of TMT and MMT valuesPatients’ sex and IGF-1 xULN values emerged as the main determinants of TMT and MMT. Univariable regression analysis to predict TMT found a negative association with female sex (β -0.349, p < 0.001), while a positive association was observed with IGF-1 xULN values (β 0.282, p = 0.018) (Online Resource 4). The same finding was observed for MMT, with both female sex (β -0.451, p < 0.001) and IGF-1 xULN (β 0.376, p < 0.001) identified as significant independent predictors.
The predictive values of these two variables were confirmed at multivariable analysis, showing an adjusted R2 of 0.189 for TMT (p < 0.001), and 0.312 for MMT (p < 0.001, Online Resource 4).
Temporal and masseter muscle qualityThe evaluation of muscle fatty infiltration was performed using a modified Goutallier classification. Considering the first available MRI, 43/66 patients (65%) with a temporal muscle evaluation had grade 0 (normal muscle appearance), while 23 patients (35%) had grade 1 (remarkable fatty infiltration). As concerns masseter muscle, 36/61 patients (59%) had grade 0, while 25 (41%) had grade 1.
When considering all available MRIs, temporal muscle was scored as grade 0 in 115/175 MRIs (66%), while 60 images (34%) had grade 1. Similarly, 96/153 available MRIs (63%) for masseter muscle were scored as grade 0, and 57 images (37%) were scored as grade 1.
The measurement of muscle quality showed a high concordance between temporal and masseter muscles (Κ coefficient: 0.929; p < 0.001).
Patients’ age was significantly higher in the MRIs scored as grade 1 compared to those scored as grade 0. This finding was observed for both temporal (57 years [52-64.5] vs. 51 years [42-61.8], p = 0.005) and masseter muscles (56 years [50.8–64] vs. 51 years [41–58], p = 0.009) (Fig. 4A-B). All the other variables evaluated were not significantly different between MRIs classified as grade 0 and grade 1. At univariable logistic regression analysis, age (stratified into tertiles) was a significant determinant of fatty infiltration for both temporal (OR 1.665, 95% CI 1.112–2.493; p = 0.013) and masseter muscle (OR 1.793, 95% CI 1.158–2.777; p = 0.009).
Finally, performing the longitudinal evaluation of the different MRIs (from MRI 1 to MRI 7), the prevalence of images scored as grade 0 and grade 1 did not change significantly during repeated measurements over time, for both temporal and masseter muscle (Chi square test: p = 0.823 and p = 0.712, respectively; Fig. 4C-D).
留言 (0)