
記住我

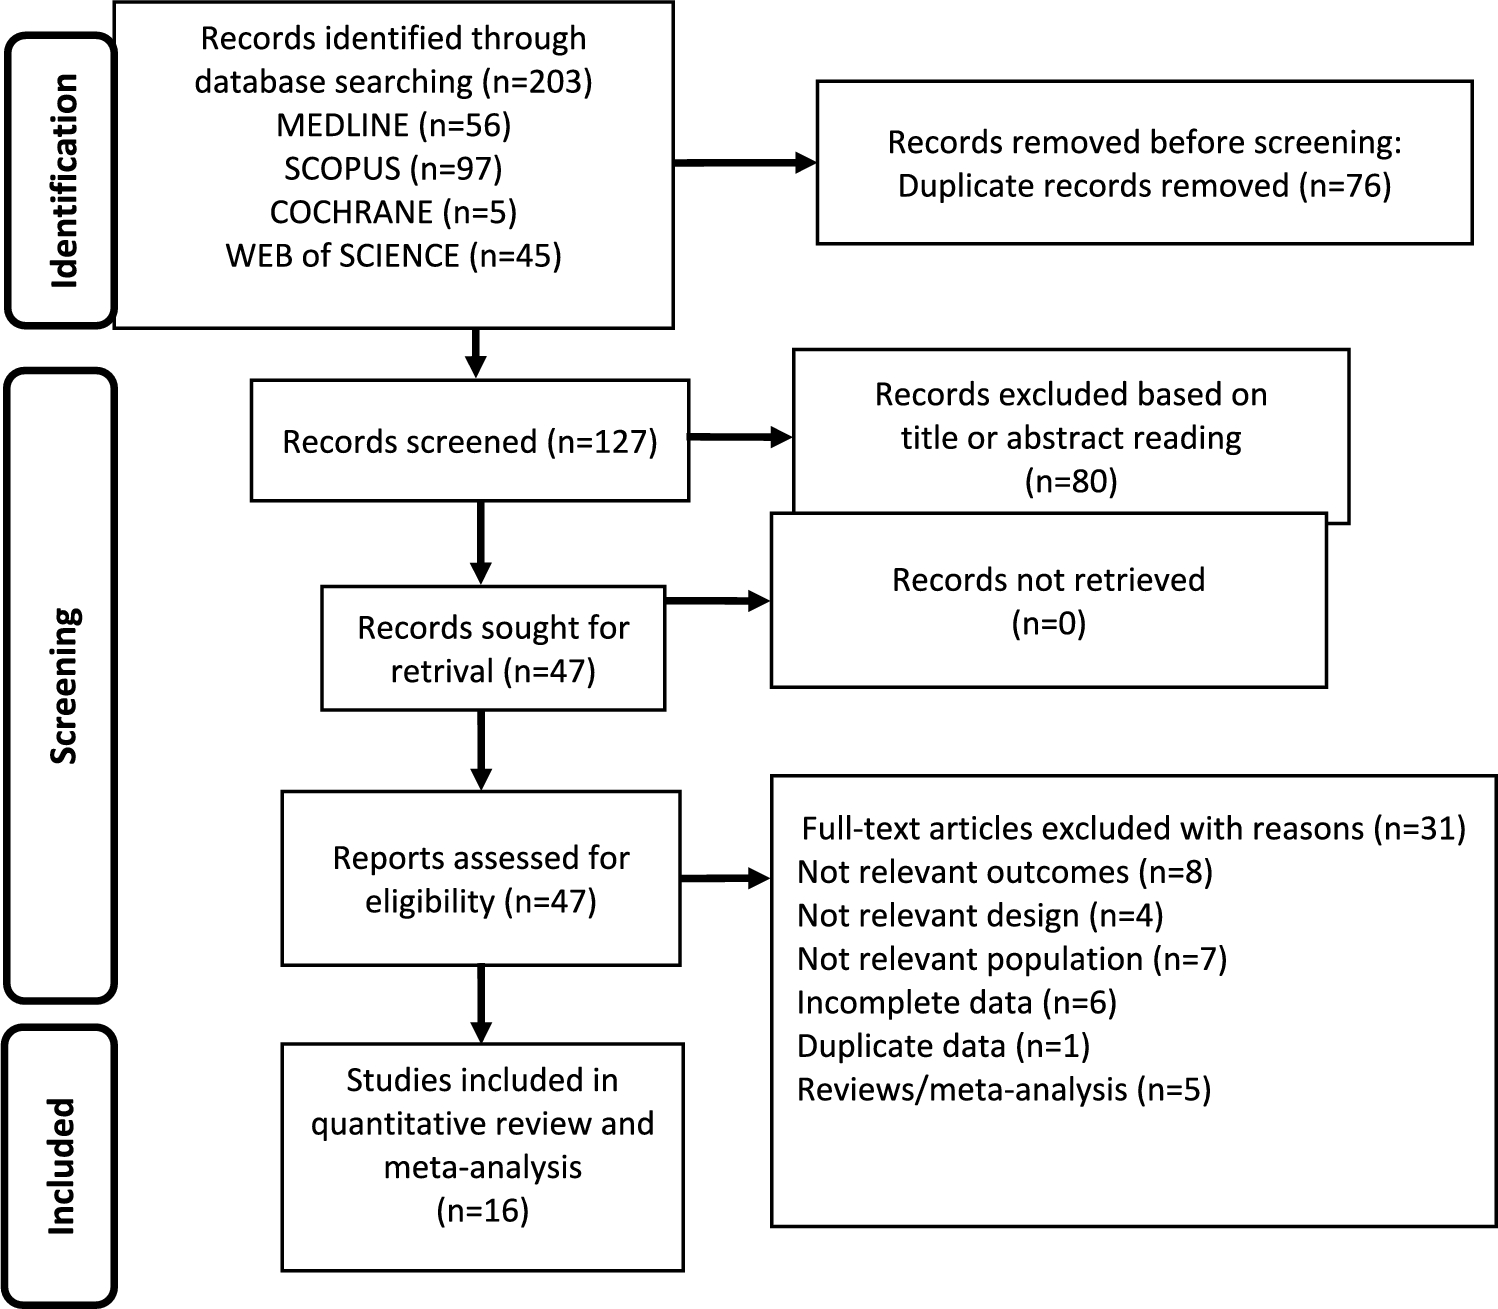

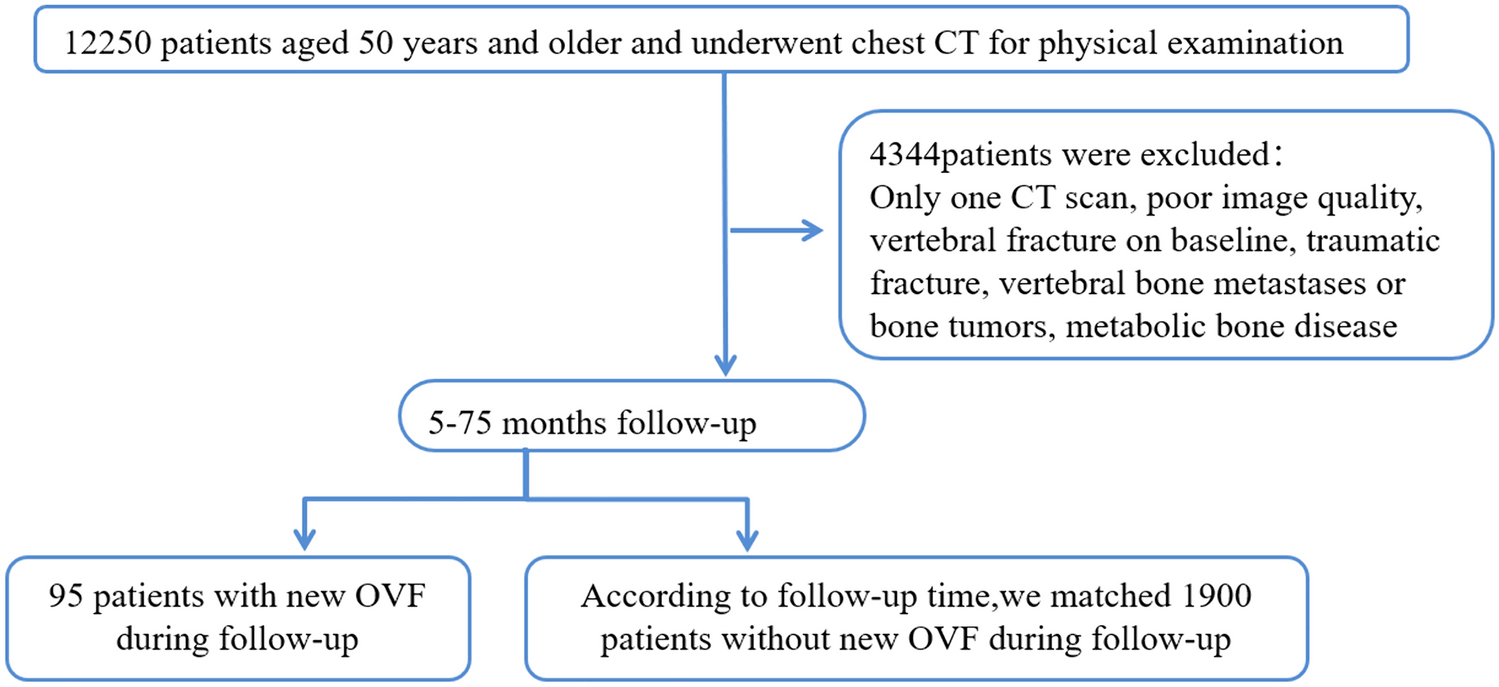
Searching from database yielded 203 studies and searching from other sources 11, for a total of 214. Removal of duplicates resulted in a total of 127 publications, of which 80 were judged to be irrelevant simply by reading the title and abstract. Thus, as shown in Fig. 1, 47 articles were identified, of which 16 met the inclusion criteria [1, 27,28,29,30,31,32,33,34,35,36,37,38,39,40,41]. Details of the studies included in the quantitative synthesis are summarized in Table 1.
Fig. 1
Flow diagram showing an overview of the study selection process
Table 1 Characteristics of the included studiesQuality assessmentThe quality assessment based on the EPHPP is given in Table 2. Overall, most studies (14 of 16) received a methodological quality rating of ‘‘moderate’’ [1, 27, 28, 30,31,32, 34,35,36,37,38,39,40,41] and 2 studies resulted ‘‘weak’’ [29, 33]. The items ‘‘confounders’’ and “data collection methods” received the highest rating among all the included studies; on the contrary, the item ‘‘blinding’’ was the most lacking, as in none of the studies the participants and the research staff who assessed outcomes were blind to the study conditions. Four studies received a ‘‘moderate’’ or ‘‘weak’’ methodological quality rating in the item ‘‘withdrawals and dropouts’’ because of the large difference in the number of participants between initial enrollment and the end of follow-up [1, 27, 29, 33].
Table 2 Quality assessment of the included studiesPrimary outcomes: prevalence of biochemical liver damageFourteen studies reported information on BLD in a total of 1698 AFAB subjects undergoing T-based GAHT: the overall prevalence (proportion) was 1% (95% CI 0.00–3.00), with minimal and non-significant heterogeneity (I2 = 14.1%; p = 0.82). In detail, 11 [28,29,30,31,32,33,34,35,36, 39, 40] of the 14 studies [28,29,30,31,32,33,34,35,36, 38,39,40,41], involving a total of 396 people, found no episodes of BLD, while in 3 studies [1, 38, 41], 6 out of 1044 [38], 5 out of 205 [1], and 1 out of 53 [41] subjects were reported (Fig. 2).
Fig. 2
Biochemical liver damage prevalence estimate. Diamond indicates the overall estimate (width of the diamond represents 95% CI). Boxes indicate the weight of individual studies in the pooled result. CI confidence interval
Secondary outcomesSix studies [1, 29, 32, 36,37,38,39] analyzed changes in ALT at 3–7 months of GAHT in a total of 1292 subjects (Fig. 3A): the difference between the aggregate means (MD) showed a statistically significant increase, in the absence of heterogeneity (MD = 1.19; 95% CI 0.31–2.08; p = 0.008; I2 = 0%, Pforheterogeneity = 0.75). At 12 months, fourteen studies [1, 27,28,29,30,31,32, 34,35,36,37,38, 40, 41] looked for changes in ALT and AST in a total of 2087 and 2139 persons, respectively (Fig. 3B and 3C): there was a statistically significant increase in both ALT (MD = 2.31; 95% CI 1.41–3.21; p < 0.00001; I2 = 29%, Pforheterogeneity = 0.12) and AST (MD = 2.13; 95% CI 1.61–2.66; p < 0.00001; I2 = 0%, Pforheterogeneity = 0.80), with no significant heterogeneity. At the same follow-up time (12 months), the meta-analysis of five [1, 27, 35, 38, 40] and three [27, 38, 40] studies, with a total of 1922 and 1541 subjects respectively, showed a statistically significant increase in levels of both GGT (MD = 1.99; 95% CI 0.67–3.31; p = 0.003; I2 = 68%, Pforheterogeneity = 0.01) and ALP (MD = 9.65; 95% CI 8.23–11.08; p < 0.00001; I2 = 0%, Pforheterogeneity = 0.81) (Fig. 3D and 3E). At 24 months, six studies [30, 32, 33, 35, 37, 39] analyzed the changes in ALT in a total of 156 persons (Fig. 3F): the difference between the aggregate averages was not statistically significant (MD = 1.71; 95% CI -0.02–3.44; p = 0.05; I2 = 0%, Pforheterogeneity = 0.44).
Fig. 3

Forest plots of the effects of testosterone (T) therapy on ALT at 3–7 months A, ALT at 12 months B, AST at 12 months C, GGT at 12 months D, ALP at 12 months E and ALT at 24 months F. Diamonds indicate the overall effect estimates (and diamond width the 95% CI); squares indicate the weight of individual studies in the aggregate estimate. CI, confidence interval; df, degrees of freedom; IV, inverse variance
Pubblication biasThe relatively symmetrical shape of the funnel plot (Fig. 4) in relation to ALT concentration at 12 months of GAHT suggested the absence of publication bias, confirmed by the not significant p-value of Egger’s test (p = 0.1214).
Fig. 4
Assessment of publication bias
留言 (0)