
記住我

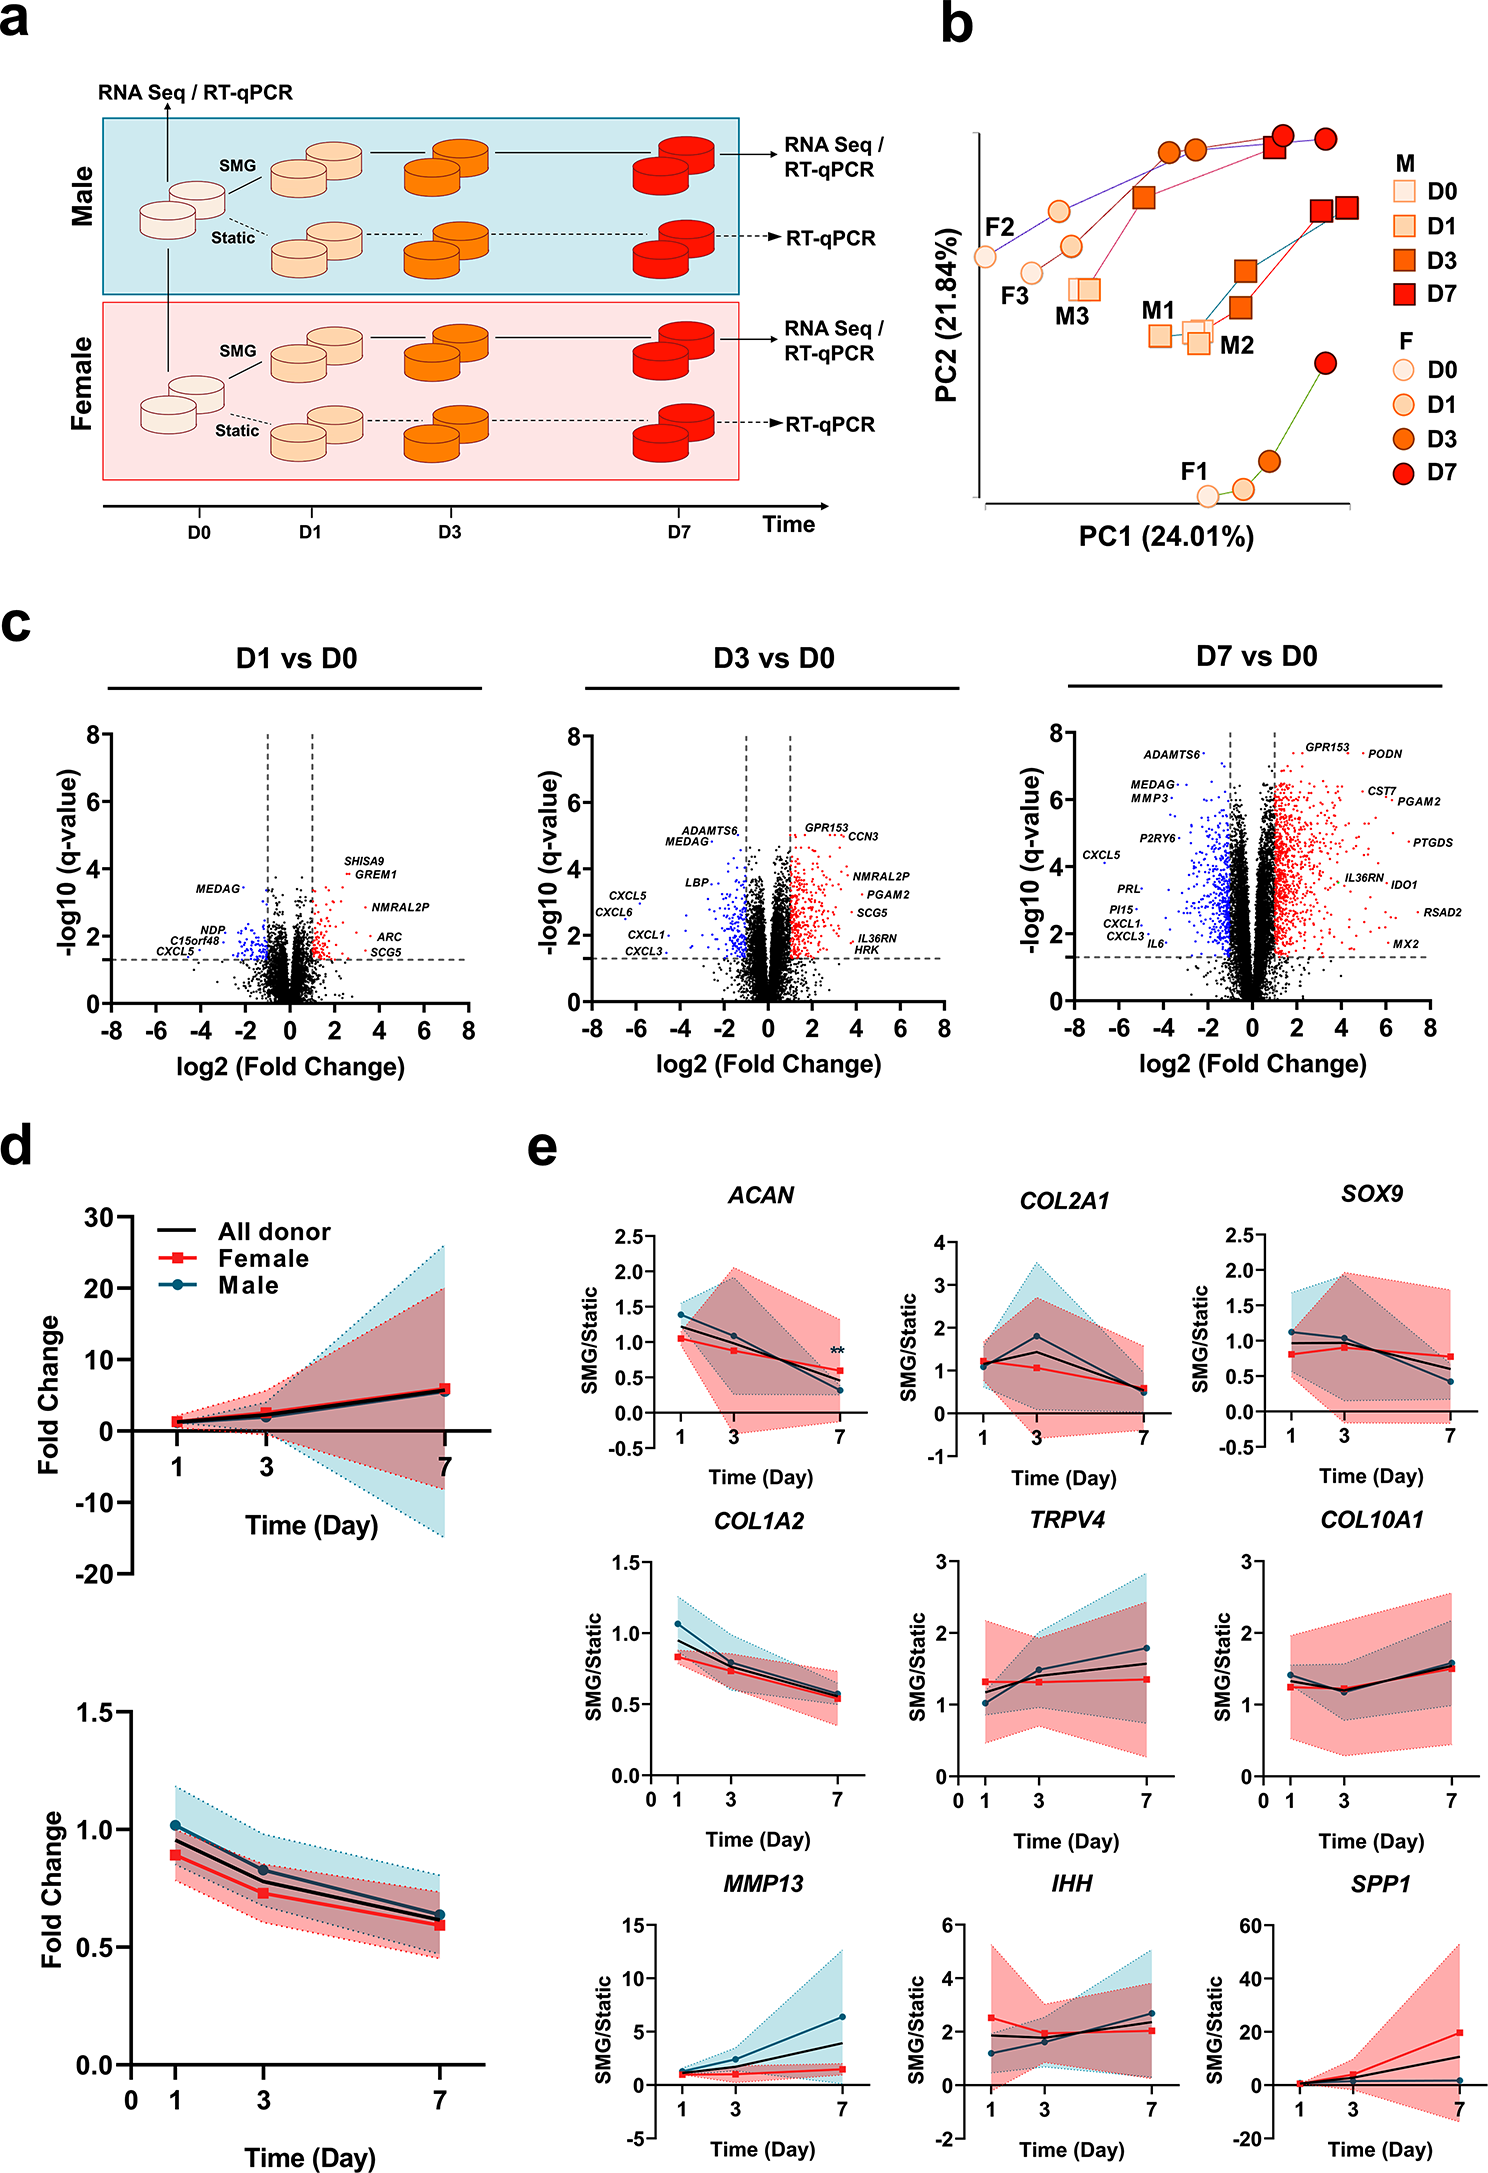


In this study, RNA sequencing and RT-qPCR were used to analyze gene expression changes over a short-term culture in SMG with 6 donors (3 males and 3 females) and 4 time points per donor (Fig. 1a). The RNA-sequencing preprocessing pipeline retained 13,537 genes for downstream analysis. The quality assessments of extracted RNA were conducted before sequencing and after each step of preprocessing (Supplementary Table 1). The authenticity of the RNA sequencing data was verified by comparing it to RT-qPCR data, showing a high correlation (R2 value of 0.9588) between the two transcriptomic techniques (Supplementary Fig. 1).
Analysis of transcriptomic trajectory of meniscus constructsIn order to evaluate the alteration of transcriptome profile over time, PCA was employed to examine the temporal changes in the transcriptome profiles across all donors during SMG culture. PC1 and PC2 captured a temporal trajectory, with PC1 (24.01%) accounting for slightly more variation than PC2 (21.84%) (Fig. 1b). SMG culture duration had little impact on gene expression until day 3, and by day 7, donors tended to converge towards a similar transcriptional pattern. Key contributors to the change in transcriptome trajectory were identified (Supplementary Table 2), including genes associated with inflammatory processes (IL21R, ILF2, and TNFRSF11B) and bone development (BMP6 and BMPR2). DEG analysis was performed to identify genes that showed significant statistical differences (|FC| ≥ 2 and q-value < 0.05) at each time point (Fig. 1c). Comparison of the volcano plots over time revealed that the impact of SMG became more evident as the number of DEGs, and the extent of regulation considerably increased. The expression of several genes involved in early inflammatory processes (CXCL families), the NF-κB signaling pathway (IL36RN), and the matrix remodeling process (ADAMTS6) were consistently and significantly regulated during the SMG culture period (Fig. 1c).
To further assess the impact of SMG culture duration on transcriptome profile alteration, the strength of correlation between the expression level changes of each gene and SMG culture time was determined. Among 13,537 genes, 5,064 genes showed a significant correlation with SMG culture duration (q-value ≤ 0.05), with 570 genes exhibiting a strong correlation (|partial correlation coefficient| ≥ 0.8). Of these strongly correlated genes, 386 were positively correlated with SMG culture time while 184 were negatively correlated (Fig. 1d) (Supplementary Table 3). The KEGG pathways (Supplementary Table 3) that were enriched by the group of genes that showed strong positive correlations include the glycosaminoglycan degradation pathway (HEXA and HGSNAT), the rheumatoid arthritis pathway (CTSK and ATP6V family), inflammation-related pathways (GSK3B, NCK2, HRH1, and ITPR1), Wnt signaling pathways (APCDD1L, FZD1, GPC4, GSK3B, and MMP7), hedgehog signaling pathway (EVC and GSK3B), and PPAR signaling pathways (ACSL1, FABP4, and PLIN2).
Fig. 1
RNA sequencing and RT-qPCR-based transcriptome across all donors. a Schematic for analyzing temporal trajectories of cell-seeded meniscus constructs, initiated from a static control. Samples were collected on day 0 under static control, as well as on day 1, 3, and 7 under SMG condition for RNA-seq analysis. For RT-qPCR analysis, samples were collected on day 0 under static control and on day 1, 3, and 7 for both SMG and static conditions. b. Principal component analysis (PCA) of temporal transcriptome trajectory for all donors (n = 6). The first two principal components (PC1 and PC2) were plotted, with male and female donors represented by different shapes (square for male and circle for female), and different time points represented by different colors. c. Volcano plot of the whole transcriptome on day 1, 3, and 7 compared to day 0 for all donors. Upregulated DEGs (fold change ≥ 2, q-value ≤ 0.05) were labelled with red color and downregulated DEGs (fold change ≤ -2, q-value ≤ 0.05) were labelled with blue color. d. Characterization of the temporal expression trajectory of genes significantly correlated with SMG culture time (absolute partial correlation coefficient ≥ 0.8, q-value ≤ 0.05). To assess the temporal correlation, the expression level of each gene in the SMG group was compared at each time point with the expression level of the same gene on day 1 in the static group (fold change). The fold change in expression level was then compared to the trend of culture time to determine the temporal correlation of each gene. Top: positively correlated genes. Bottom: negatively correlated genes. Shaded area: Standard Deviation (SD) e. Characterization of the temporal expression trajectory of selected chondrogenic/OA-related signature genes. Data for females, males, and all donors combined were presented as mean values along with their corresponding standard deviations. Shaded area: Standard Deviation (SD).** p ≤ 0.005 compared to day 1
Examination of early KOA onset mechanisms in the SMG modelChanges in chondrogenesis and OA-like phenotype were first confirmed using a panel of selected markers by RT-qPCR (Fig. 1e). Chondrogenic markers (ACAN, COL1A2, COL2A1, and SOX9) initially comparable between groups decreased over time in the SMG culture, while OA-related markers (IHH, MMP13, SPP1, and COL10A1) increased. TRPV4 was activated and upregulated in the SMG group, indicating mechanical stimulation responsiveness. Due to large donor variability, only the expression level of ACAN was statistically significant at day 7; however, the general trend across all donors aligned with this pattern. DEGs from RNA sequencing were then compared between time points (Fig. 2a), showing a substantial increase in the number of DEGs from day 1 to day 7. Some DEGs were consistently regulated throughout the culture period, suggesting that SMG consistently regulated a specific group of genes with an expanding effect over time.
Functional enrichment analysis was performed to explore the KEGG pathways and GO terms significantly enriched by all DEGs at each time point (Fig. 2b, Supplementary Fig. 2). The findings revealed a consistent overrepresentation of several GO terms, including “extracellular space and regions”, “response to stimulus”, and “signaling receptor binding”. At later time points, additional functional terms such as matrix remodeling and immune system pathways were identified. For KEGG pathway analysis, significant enrichment was observed in pathways such as “calcium signaling pathway,” “complement and coagulation cascades,” “PPAR signaling pathway,” and “rheumatoid arthritis,” which could potentially play a crucial role in the early onset of KOA (Fig. 2b).
Fig. 2
Functional enrichment of altered transcriptome induced by SMG across all donors. (a) Venn diagram of the comparison between all DEGs, upregulated DEGs, and downregulated DEGs in all donors (n = 6) across three time points. Each circle represents a distinct time point with the number of uniquely regulated genes indicated in the non-overlapping areas, while overlapping areas show the number of genes that are commonly regulated across multiple time points. (b) Top non-redundant Gene Ontology (GO) terms and KEGG pathways enriched by all DEGs on day 7
To elucidate the underlying molecular mechanism responsible for the OA-inducing effect of SMG, the hub protein networks were constructed for all DEGs at each time point (Supplementary Figs. 3–5). The networks comprised 27, 86, and 111 genes on days 1, 3, and 7, respectively (Supplementary Table 4), with CCL2, IL6, and CDK1 serving as the hub proteins. CCL2 and IL6 are known to participate in immunoregulatory and inflammatory processes, while CDK1 plays a critical role in cell cycle regulation. Notably, several proteases including the MMP family and ADAMTS5 were highly connected to the hub protein IL6 in the network (Supplementary Fig. 4). More than half of the top 25 KEGG pathways enriched by the panel of genes corresponding to the filtered protein network overlapped on day 1 and 3, including several pro-inflammatory signaling pathways and OA-related pathways, such as “IL-17 signaling pathway,” “TNF signaling pathway,” and “rheumatoid arthritis” (Supplementary Table 4).
Examination of sex-dependent responses to SMGAfter establishing SMG’s capability to generate an OA-like phenotype in cell-seeded meniscus construct models, the donors were stratified by sex. The models derived from male and female primary MFC were analyzed separately to investigate sex-specific responses to SMG and identify molecular mechanisms that may contribute to the disproportionate incidence and severity of OA in females.
DEGs were identified for male and female donors at each time point. SMG regulated 1,182 genes in female donors on day 7, while the number of DEGs increased gradually from 218 genes on day 1 to 1,216 genes on day 7 for male donors. Only a small proportion of DEGs were shared on day 3, while approximately half of the DEGs were the same on day 7 when comparing male and female donors at the same time points (Fig. 3a). This trend was also observed when the up and downregulated DEGs were separated (Supplementary Fig. 6). The results of the PCA analysis revealed a noticeable impact of SMG on the transcriptome profile over culture time for both male and female donors (Fig. 3b). Key genes associated with OA development were among the most significantly regulated DEGs in female donors on day 7, such as LOX (-5.13-fold), MMP3 (-17.37-fold), MMP11 (74.71-fold), and COL10A1 (29.53-fold) (Fig. 3c).
Fig. 3
RNA sequencing based transcriptome profiling and trajectory analysis for male and female donors. (a) Venn diagram of the comparison between all DEGs regulated in male (n = 3) and female (n = 3) donors across three time points. (b) Principal component analysis (PCA) of temporal transcriptome trajectory for male and female donors. The first two principal components (PC1 and PC2) were plotted. (c) Volcano plot of the whole transcriptome on day 1, 3, and 7 compared to day 0 for male and female donors. Upregulated DEGs (fold change ≥ 2, q-value ≤ 0.05) were labelled with red color and downregulated DEGs (old change ≤ -2, q-value ≤ 0.05) were labelled with blue color. (d) Pearson correlation heatmap of select markers and culture time for male and female donors. Heatmap was generated by calculating the pairwise Pearson correlation coefficient, with the color of each cell representing the corresponding coefficient value
Correlation analysis was conducted to investigate the relationship between well-established cartilage and OA-related markers within male and female donor groups. Correlation heatmaps were created using selected signature markers divided into mechano-transduction (EHD2, FOS, FOSB, JUN, JUNB, TRPV4, and YAP1), chondrogenesis (ACAN, COL1A2, COL2A, SOX9, and MGP), and OA development (CD36, COL10A1, IBSP, IHH, MMP13, PTCH1, RUNX2, SPP1, and VEGFA) subcategories (Fig. 3d). The expression levels of chondrogenic markers showed a negative correlation with SMG culture time in both male and female donors, while the correlation with OA markers was positive, especially for females. The correlation patterns of OA markers and chondrogenic markers differed for males and females, particularly with regards to ACAN and COL1A2, which exhibited opposing trends. These suggested the potential unique interaction mechanism between these markers within each sex group. Finally, among the chosen mechano-transduction markers, JUN and JUNB exhibited the most notable sex-specific differences in their correlation patterns with other markers.
Functional enrichment analysis showed that both male and female donors demonstrated comparable GO enrichment on day 3 and day 7, with general biological processes such as cell adhesion and migration, extracellular matrix components, and molecular function of signaling receptor binding being the primary terms. The KEGG pathway “mineral absorption” was enriched in both males and females on day 3 and day 7, along with several pathways related to the cell cycle and apoptosis. Inflammation and immune response were significant functional enrichments for male donors on both day 3 and day 7, but not for female donors (Fig. 4a, Supplementary Fig. 7).
Fig. 4
Functional enrichment of altered transcriptome induced by SMG for male and female donors. (a) Top non-redundant Gene Ontology (GO) terms and KEGG pathways enriched by all DEGs in male and female donors on day 7. (b) Hub protein networks for upregulated DEGs on day 7 in male and female donors. Hub protein was defined as the protein with the highest connectivity. A network was generated by including the hub protein and its direct connections with all other proteins. The size and density of color of each protein in the network reflected its level of connectivity, with larger and denser colors indicating higher connectivity. The hub protein in the net work was highlighted with a blue circle. The hub protein for male donors was identified as COL4A2, and for female donors was JUN
To investigate further the molecular mechanism underlying sex-dependent differences, hub gene networks were constructed for male and female donors separately, considering all DEGs combined, up-regulated DEGs, and down-regulated DEGs (Fig. 4b, Supplementary Fig. 8). Upon comparing males and females, it was found that the corresponding hub protein from up-regulated DEGs on both day 3 and day 7 in females were primarily associated with Wnt signaling (CTSK, IRAK1, JUN, PIK3R1, LEF1, MMP7, NFATC4, ROR2, and WNT11), VEGF signaling (KDR, PIK3R1, and SPHK1), and NF-κB signaling pathways (BIRC3, CXCL12, DDX58, GADD45A, IRAK1, RELB, TRAF1, and TRAF5). In contrast, the hub components of upregulation in males were ECM components and matrix remodeling enzymes (Supplementary Table 5).
留言 (0)