Patients’ sample collection
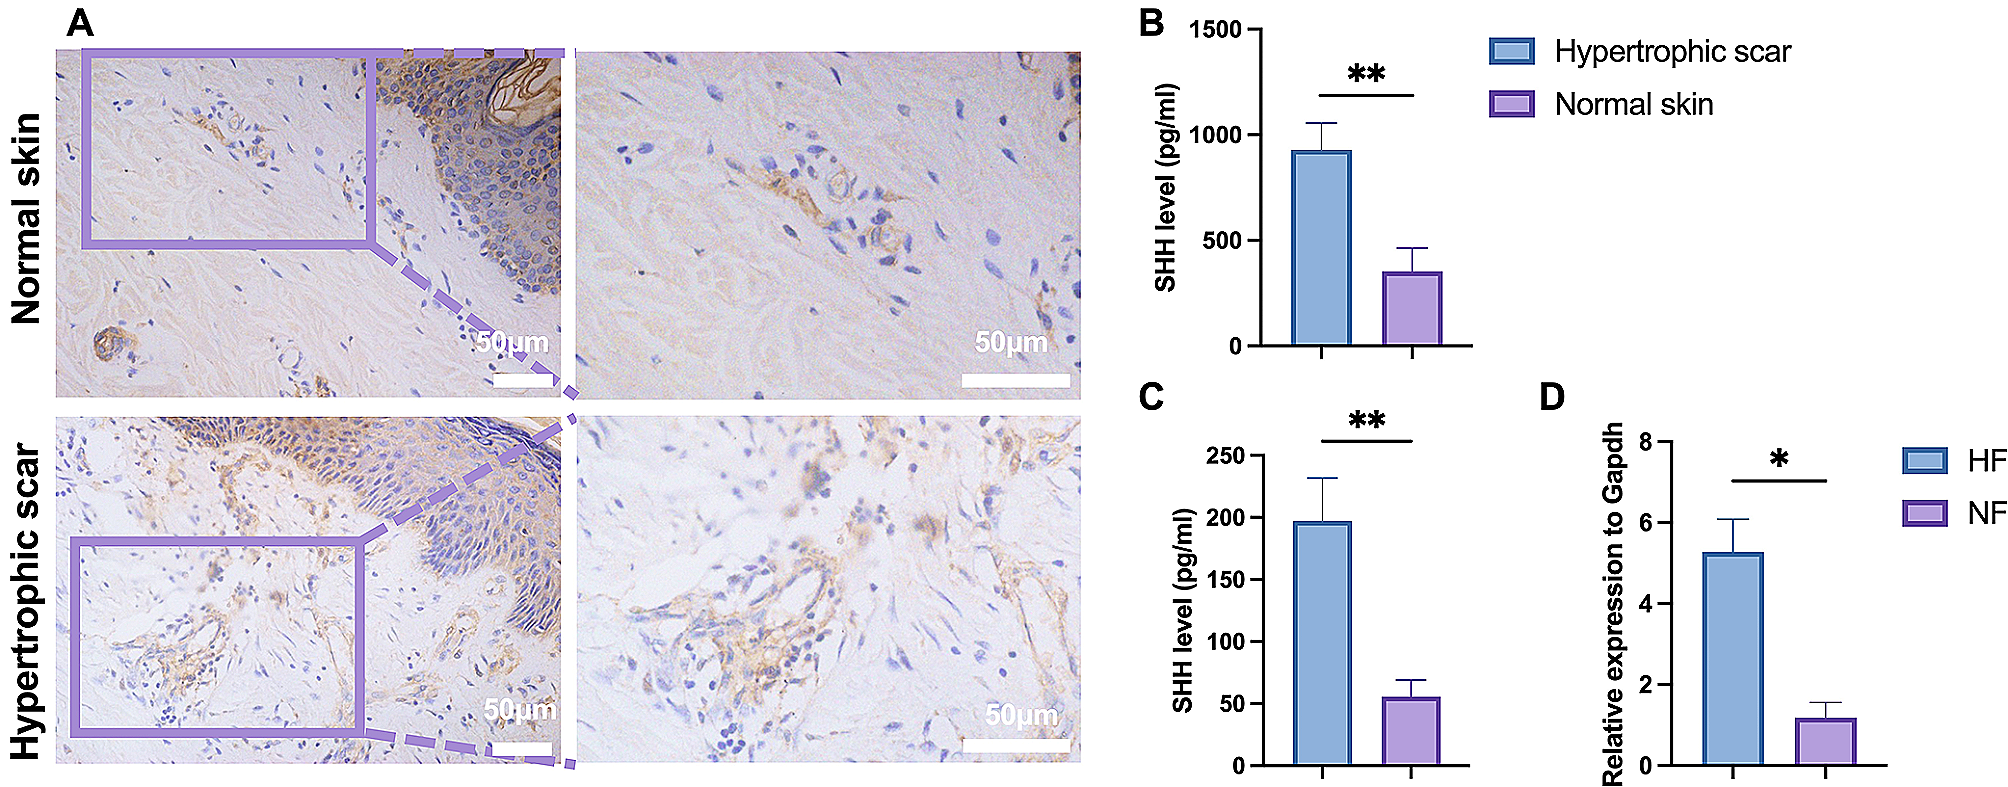
The hypertrophic scar and adjacent normal skin tissue used in this study were collected from 11 patients who underwent plastic surgery at the Department of Burn and Plastic Surgery, 980th Hospital, PLA Joint Logistics Support Force. Patients between the ages of 18 and 65 years with a diagnosis of hypertrophic scars were included. The diagnosis was made by a professional plastic surgeon on the basis of clinical presentation. Characteristics of hypertrophic scars include a clear history of skin injury such as trauma, burns, surgery or injury, a scar that grows above the surrounding skin without extending beyond the original wound edges, a typical red or purple appearance, a hard texture, and symptoms of itching or pain. Patients were excluded if they had been diagnosed with keloids or other systemic diseases, or if they had received scar treatment in the previous 6 months, including hormone injections, radiotherapy, surgery or any other method. Characteristics of keloids include scar tissue that extends beyond the boundaries of the original wound, invading the surrounding normal skin, commonly found on the ears, chest, shoulders or neck, and receding over time. Prior to surgery, all patients signed an informed consent form and all protocols were approved by the Ethics Committee of Bethune International Peace Hospital in accordance with the tenets of the Declaration of Helsinki.
Primary fibroblast culture from normal skin, hypertrophic scar and mice skin
Human hypertrophic scar, normal skin tissues and mice skin tissues were placed in 0.25% DISPASE enzyme (No.17105041, Gibco, USA) overnight at 4 °C to separate epidermis and dermis. The dermal portion of the skin was cut into tissue blocks less than 1 mm [3], and fibroblasts were isolated by culturing the tissue block explants. Fibroblasts were cultured in Dulbecco’s Modified Eagle Medium (DMEM) (No.C11885500BT, Gibco, USA) supplemented with 10% fetal bovine serum (FBS) (No.10099141 C, Gibco, USA) and 1% penicillin/streptomycin (No.15070063, Gibco, USA). The medium was changed every 2 days. Fibroblasts of the third and fifth sub-passages were used for the following experiments.
Isolation and induction of bone marrow derived macrophage
Femur and tibia of C57BL/6 mice were collected and bone marrow cells were isolated by cell strainer and centrifugation, and erythrocytes were lysed via hypotonic shock in sterile distilled water. Bone marrow cells were cultured in RPMI 1640 (No.22400089, Gibco, USA) supplemented with 10% FBS and 1% penicillin/streptomycin. M-CSF (30ng/ml, No.574814, Biolegend, USA) was added to the medium to induce macrophage differentiation. 100ng/ml rmSHH was added to the medium for SHH stimulation.
ELISA
The tissues and the culture supernatant of fibroblasts as described above were collected to assess the concentration of SHH using an ELISA test kit (NO.IPD11539H, IPODIX, China). Mouse COL1 ELISA Kit (No.D721060, Sangon Biotech, China) was used for COL1 determination of the wound area. EZElisa™ Human Collagen Type I ELISA Kit (NO.A-QEK01782-96wells, Biogradetech, USA) and EZElisa™ Human Collagen Type III (COL3) ELISA Kit (NO.A-QEK01779-96wells, Biogradetech, USA) were used to assess the COL1 and COL3 from the supernatant of fibroblasts. TNF-α ELISA Kit (No.EK282, MultiSciences, China) and TGF-β ELISA Kit (No.EK981, MultiSciences, China) were used to assess the TGF-β and TNF-α of macrophage. All procedures were performed according to the manufacturer’s instructions.
Immunohistochemistry
Tissue samples were fixed in 4% paraformaldehyde, dehydrated in graded ethanol, embedded in paraffin and sectioned for immunohistochemistry. Paraffin sections were incubated with antibodies against SHH (No.ab53281, Abcam, United Kingdom). Images of immunohistochemistry staining were captured with an Olympus microscope, and the positive cell or area was quantified using ImageJ software. Six random fields from every sample were evaluated.
Real-time quantitative PCR
RNA was extracted from cells using TRIzol Reagent (No.15596026CN, Invitrogen, USA) and its concentration was confirmed quantitatively. RNA was reversely transcribed into cDNA using the Prime Script™ RT Reagent Kit (No. RR037A, Takara, Japan) according to the manufacturer’s instructions. Real-time PCR reaction was performed in SYBR Premix Ex Taq II (No.RR820A, Takara, Japan) with the following PCR cycles: 40 cycles at 95°C for 5 s and at 60°C for 30 s. The primers used in our study were as follows: GAPDH, 5’- GGAGCGAGATCCCTCCAAAAT-3’ (forward) and 5’- GGCTGTTGTCATACTTCTCATGG-3’ (reverse); SHH, 5’- CTCGCTGCTGGTATGCTCG-3’ (forward) and 5’- ATCGCTCGGAGTTTCTGGAGA-3’ (reverse); GLI1, 5’- AGCGTGAGCCTGAATCTGTG-3’ (forward) and 5’- CAGCATGTACTGGGCTTTGAA-3’ (reverse).
Mice and cutaneous wound model
C57BL/6 mice were selected to establish a mouse cutaneous wound model. After anesthesia by intraperitoneal injection of 1% sodium pentobarbital (40 mg/kg), the dorsal hair was shaved and the skin was prepared according to standard sterile procedures. A 6 mm diameter full-thickness cutaneous wound was established on the back of the mice. For drug administration, 100 µl (1 mg/ml) rm-SHH (No.315 − 22, Peprotech, USA) or 100ul vismodegib (20 mg/kg, No.S1082, Selleck, USA) were subcutaneously injected around the wound site immediately after the surgery and every 24 h post-surgery until the endpoint of the observation. The mice were sacrificed at the 3rd day for the observation of inflammation cells, and 14th day for the evaluation of Masson staining, COL1A1 and CD31. The wounds area was measured with ImageJ software. The healing speed was evaluated by the ratio of unhealed wound to initial wound area.
Masson staining
Tissue samples from mouse cutaneous wound were made into paraffin sections and Masson staining was performed according to the manufacturer’s instructions provided in the Masson kit (No.D026-1-1, Nanjing Jiancheng, China) to detect the collagen deposition. The thickness of the dermis was measured with ImageJ software.
Immunofluorescence
After the cultured fibroblasts reached 70–80% confluence, the cells were fixed in 4% paraformaldehyde for 15 min. Paraffin sections of tissue samples were deparaffinized and rehydrated. Both the cell and tissue samples were then washed, permeabilized, and blocked. The following primary antibodies were used: anti-COL1A1 (No.27,026, CST, USA), anti-CD31 (No.GB12063-100, Seivice Bio, China), anti-Ly6G (No.GB11229-100, Seivice Bio, China), anti-F4/80 (No.GB113373-100, Seivice Bio, China), anti-CD206 (No.GB113497-100, Seivice Bio, China), anti-iNOS (No.GB123965-100, Seivice Bio, China). Images of the IF staining were captured with a fluorescence microscope (NIKON, Japan) for the analysis of the fluorescent intensity.
Mitochondria superoxide detection
To detect the level of superoxide in mitochondria, MitoSox™ (No.M36006, Invitrogen, USA) was used according to the manufacturer’s instruction. Briefly, macrophage was cultured in plates and stimulated with rmSHH. Then the MitoSox™ Green reagent was applied to cover cells for 30 min incubation at 37 °C and 5% CO2. Then the cells were washed gently for 3 times with phosphate buffered saline (PBS). Then the cells were observed and captured with a fluorescence microscope (NIKON, Japan) for the analysis of the fluorescent intensity.
Flow cytometry
The expression of cell surface markers and the proportion of macrophage phenotype were measured by flow cytometry. Cell and tissue samples were treated with anti-mouse CD16/CD32 (No.553,141, BD Pharmingen, USA) to block cell surface Fc receptors and then incubated with FITC-conjugated anti-F4/80 (No.157309, Biolegend, USA), PE-conjugated anti-CD86 (No.553,692, BD Pharmingen, USA), APC-conjugated anti-CD206 (No.141,707, Biolegend, USA), PerCP-Cy5.5-conjugated anti- CD11b (No.550,993, BD Pharmingen, USA) in the dark. The cells were then analyzed by flow cytometry using BD FACSAria (BD Biosciences, USA). M1 macrophages were defined as F4/80 and CD86. M2 macrophages were defined as F4/80 and CD206.
CCK8 assay
Fibroblasts from hypertrophic scar were seeded into 96-well plates at a density of 1 × 10⁴ cells per well. The control group was cultured with DMEM and the SHH-stimulated group was cultured with DMEM supplemented with SHH (200pg/mL, No.100 − 45, Peprotech, USA). Cell proliferation was examined using CCK-8 assay at the time points of 24, 48 and 72 h. 10 µL CCK-8 solution (No.C0037, Beyotime, China) was added to each well and cells were incubated at 37 °C for 2 h. The absorbance was detected at 450 nm using a microplate reader.
Apoptosis analysis: PI/Annexin5
Cell apoptosis was measured with the Annexin V Apoptosis Detection Kit (No.88-8102-72, eBioscience, USA) following the manufacturer’s instructions. 100 µL cell suspension was stained with 10 µL Annexin V-FITC and 5 µL propidium iodide (PI). FITC and PI signals were detected at 515 nm and 620 nm activated by the wave at 488 nm, and the proportion of PI/Annexin V-stained cells was quantified by flow cytometry.
Efferocytosis induction
Apoptotic neutrophils were incubated with PKH26 (No.PKH26PCL, Sigma, USA) for 30 min to label the cell membrane, followed by coculturing with bone marrow derived macrophage at a ratio of 5:1 for 30 min, and the plates were washed three times with PBS to remove unbound neutrophils. The macrophage phagocytizing apoptotic neutrophils was identified by immunofluorescence and flow cytometry.
Seahorse Cell Mito Stress Test and ATP production rate
Oxygen consumption rate (OCR) was measured using an Agilent Seahorse XFe24 Analyzer and Cell Mito Stress Test Kit (Agilent Technologies, Cheadle, United Kingdom) according to the manufacturer’s instructions. Cells were seeded into the XFe24 Cell Culture Microplates at 2 × 10⁴ cells/well and incubated for 1 h, then consecutively treated with 1µM oligomycin, 1 µM carbonyl cyanide-p-trifluoromethoxyphenylhydrazone (FCCP), and 1 µM Rotenone/Antimycin A (AA), while OCR is monitored in real-time. Data analysis was conducted using Wave Software (Agilent Technologies, Cheadle, United Kingdom).
Mitochondrial complex I and complex II activity
Cells were harvested to extract mitochondrial proteins and the activity of mitochondrial complex I and complex II were measured by Complex I Enzyme Activity Microplate Assay Kit (ab109721, Abcam, United Kingdom) and Complex II Enzyme Activity Microplate Assay Kit (ab109908, Abcam, United Kingdom), respectively. Briefly, mitochondrial proteins were added to the 96-well plate, which had been pre-coated with a specific capture antibody, and the complex activity was determined by tracking the oxidation and reduction of the complex-specific substrate. Absorbance was measured using a spectrophotometer at 450 nm (complex I) and 600 nm (complex II), respectively.
Statistics analysis
Data were analyzed with SPSS 26.0. For comparing data from two groups, student’s t test was used. For comparing data from multiple groups, One-way ANOVA was used. P < 0.05 was considered statistically significant.


留言 (0)