Materials
Lecithin (Soya L-a-Phosphatidylcholine, SPC), Silibinin, acetaminophen (APAP), and Bortezomib were obtained from Meilun Biotechnology (Dalian, China) and used as received. Cholestrol was purchased from Sinopharm Chemical Reagent Co., Ltd. (Shanghai, China). 1,1’-dioctadecyl-3,3,3’,3’–tetramethylind-odicarbocyanine, 4-chlorobenzenesulfonate salt (DiD) was purchased from Fanbo Biochemical Co., Ltd. (Beijing, China). Dimethyl sulfoxide (DMSO) was purchased from Sigma-Aldrich (St. Louis, USA). Fetal bovine serum (FBS), Dulbecco’s modified Eagle’s medium (DMEM), phosphate buffer saline (PBS, pH 7.4), and trypsin were purchased from Yuanpei Biological Technology Co., Ltd (Shanghai, China). Mouse monoclonal antibodies were purchased from BioLegend (London, UK).
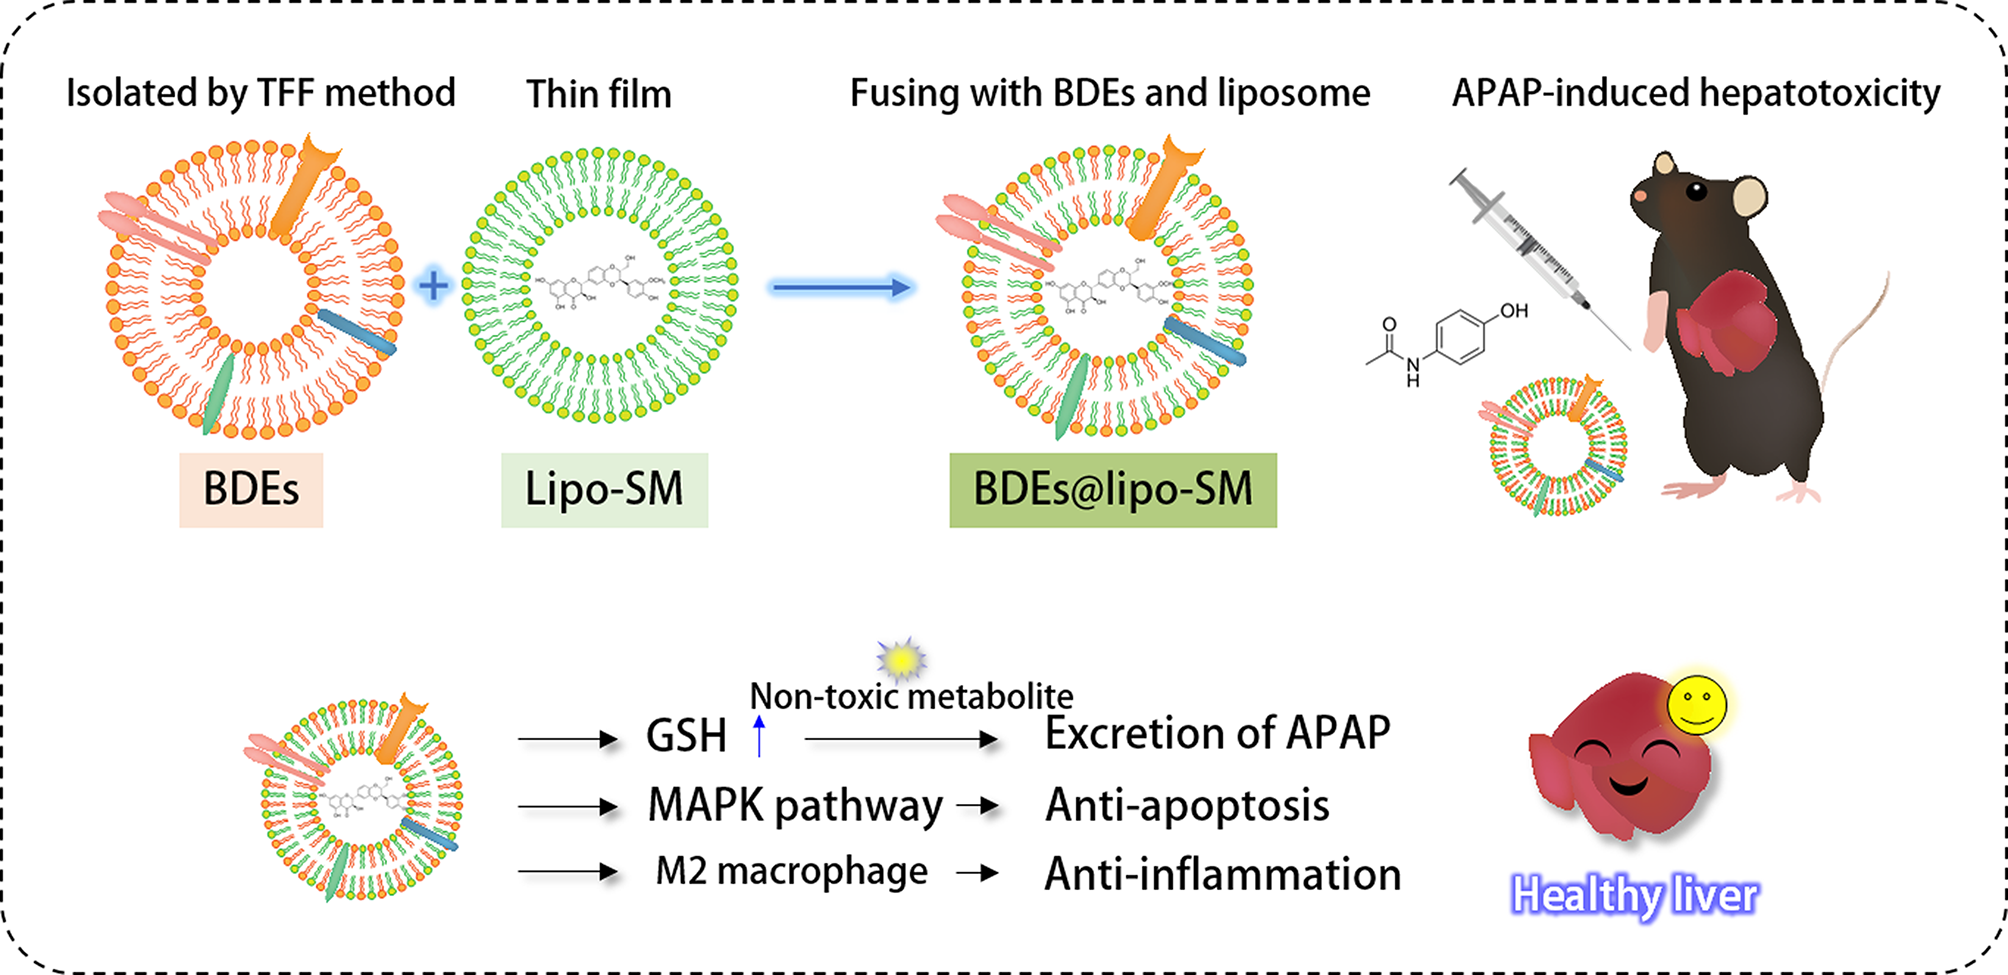
Isolation of BDEs
100 g of Platycodon grandiflorum, harvested from Chifeng, Inner Mongolia, was purchased from a local market. For isolation of exosome-like nanoparticles, Platycodon grandiflorum was washed with a running water. Then, Platycodon grandiflorum was thoroughly ground in 300 mL 1X PBS with a blender for 5 min. The juice was squeezed on a sieve to remove rough debris and centrifuged at 2000 g for 20 min and the supernatant was further centrifuged at 10,000 g for 60 min. After centrifugation, the supernatant was collected and filtered using a 0.22 μm microporous filter membrane (Collins, USA). To isolate the BDEs, we used a tangential flow filtration method (TFF) using a Minimate EVO Tangential flow ultrafiltration system (Pall Biotech, Dreieich, Germany) to achieve high yield of the exosome-like nanoparticles without sucrose [16]. 200 mL of the multivesicular exosomal fluid was transferred into a feed tank and separated through the tangential filter, which is an Omega™ 500 kDa TFF Membrane (Pall Biotech, Dreieich, Germany), at the 20 mL/min of the feed flow rate and 2 bar of the transmembrane pressure. Particles larger than 100 nm concentrated were retained in the main vessel and particles smaller than 100 nm were in the filtrate vessel. While passing through the tangential filter, the final exosome-like nanoparticles were successfully diafiltered and concentrated about 6 times to reach a final volume of 30 mL of BDEs.
Preparation of liposome loaded SM
The liposome loaded SM (lipo-SM) was prepared by thin-film hydration method. 25.5 mg SPC and 1.5 mg Cholesterol were dissolved in organic solvent (Chloroform : Methanol, 9:1, v/v). The solution was mixed with 1 mg SM dissolved in DMSO. Then, the organic solvent was removed using a rotary vacuum evaporation (ZX-98 rotary evaporator, LOOYE, China) for 10 min in a water bath at 48 ℃ to form a SM-containing lipid membrane. 500 µL of 1X PBS was added to the SM-containing lipid membrane and the lipid solution was stirred to get a preliminary nanoliposomal solution. The nanoliposomal solution was vortexed and sonicated using an ultrasonic cell pulverizer (20% amplitude, 2 s pulse on/off) for 2 min to turn the multilamellar lipid vesicles into smaller vesicles and the final nanoliposome was obtained by filtering through 0.22 μm filters.
Fabrication of BDEs@lipo-SM
To promote hybrid BDEs with liposome loaded SM, the BDEs@lipo-SM was synthesized by simple thin film hydration followed by a membrane extrusion method. The fresh BDEs were added in the dry lipid layer to hydrate (1:1, v/v) in the final volume of 500 µL. Then, the mixture was then vortexed and sonicated at 20% amplitude for 2 s pulse on/off for 2 min. The formed multilamellar BDEs@lipo-SM was extruded through 800, 400, 200 and 100 nm size polycarbonate membranes, respectively, to achieve nano-sized unilamellar BDEs@lipo-SM. The final BDEs@lipo-SM was obtained by filtering through 0.22 μm filters [19, 20].
Nanoparticle tracking analysis
Nanoparticle tracking analysis (NTA) was performed by NTA (NanoSight LM10, Malvern Instrument, UK). Size distribution and concentration of BDEs in liquid suspension were measured. BDEs were diluted to a final dilution of 1 : 10,000. 1 mL of BDEs was injected in the chamber with disposable sterile syringes (BD Discardit II, New Jersey, USA) until the solution came out at the end of the nozzle in a way. The sample was detected for 60 s duration using NanoSight automatic analysis settings at room temperature (RT). The average and SD values were analysed using the NTA 3.0 software (Malvern Instruments).
Protein-based exosomes quantification of BDEs
To quantify BDEs, the protein concentration was measured by Bradford protein assay (Yeasen, China). The fresh BDEs were diluted for 10 times with 1X PBS and 5 mL of the diluted BDEs was used for measurement of the protein concentration. Bradford assay was performed as described in the previous report [21, 22].
DLS measurement
The BDEs and fabricated BDEs@lipo-SM were diluted 100 times using diethylpyrocarbonate (DEPC) and 1 mL BDEs and fabricated BDEs@lipo-SM were transferred into a cuvette (12 mm square polystyrene cuvette, DTS0012, Malvern, UK) and a disposable cuvette (disposable capillary cell, DTS1070, Malvern, UK) for the size and zeta potential measurement, respectively. The cuvette was placed into the dynamic light scattering (DLS) device to start measuring and the size and surface charge were measured using a Zetasizer Nano ZS (Malvern Instrument, UK). The measurement was conducted at 25 ℃, and all experiments were run in triplicate.
Encapsulation efficiency analysis by HPLC
The encapsulation efficiency of SM was determined by high-performance liquid chromatography (HPLC) (Agilent, USA). Drug loading capacity was calculated as SM encapsulated/liposome material×100%. To remove free SM in liposomes, the Lipo-SM was centrifuged at 64,000 g for 60 min at 4℃ with 10 mL 1X PBS. Then, the supernatant was removed and pellet was dissolved in 500 µL of an organic solvent consisting 10% Triton X and methanol (1:9, v/v). The sample was prepared by filtering through 0.22 μm filters for HPLC analysis. When performing HPLC analysis, SM was eluted through the column of Agilent ZORBAX SB-Aq 5 μm, 4.6 Х 250 mm (CA, USA) at a flow rate of 1 ml/min and separated using a mobile-phase gradient. (Mobile phase A; phosphate buffer (pH 5.0; 10 mM), mobile phase B; acetonitrile (ACN)) The analysis time was set for 22 min and the gradient was subsequently changed in mobile phase B to 29% at 0 min, 41% at 10 min, 29% at 20 min, and ended at 22 min. SM was analyzed using an Agilent 1260 Infinity II instrument (CA, USA). The drug encapsulation efficiency was calculated according to the following formula: The drug encapsulation efficiency = (total drug / free drug)/the initial added total drug × 100%.
Cell culture
Huh7 liver cells and RAW 264.7 were purchased from Meilun Biotechnology (Dalian, China). All cells were cultured in DMEM with High glucose containing 10% FBS, 100 U/mL penicillin at 37 °C in a humidified atmosphere with 5% CO2. For subculturing, the culture media was removed and washed with PBS, followed by adding 0.25% Trypsin-EDTA. The cells were collected and centrifuged for 5 min at 1500 g. Cells were seeded on a 12 well plate at the density of 1 × 10⁵ for Huh7 and RAW 264.7 cell lines, respectively.
Membrane fusion assay
To validate the fusion of membranes, a Fo¨rster resonance energy transfer (FRET) pair lipophilic dyes Coumarin 6 (C6, Ex/Em 460/510 nm) and Rhodamine B (RhB, Ex/Em 565/590 nm) were used. SPC and cholesterol in the mixture of chloroform and methanol (9:1, v: v) were incorporated with 8 µL 1 mg/mL of C6. The liposomal mixture was then evaporated to form a lipid film. The membranes of BDEs were labeled with 16 µL 1 mg/mL of Rhodamine B (RhB) by simple incubation for 10 min and subsequently washed twice to remove free dyes through UFC5100 Amicon Ultra-0.5 Centrifugal Filter Unit, 100 kDa (USA, Merck). C6 with lipid membranes (donor, acceptor) and RhB-labeled membrane of BDEs (acceptor) were applied at the ratio of 1:0, 1:0.25, 1:0.5, 1:0.75, 1:1, and 1:1.25, respectively followed by hydrating and extruding through 800, 400, 200, 100 nm polycarbonate filters to induce the membrane fusion. The fluorescence emission spectrum of each sample was obtained from 450 to 700 nm at an excitation wavelength of 430 nm on a Cary Eclipse fluorescence spectrophotometer (Agilent, USA).
Preparation of DiD-labeled BDEs@lipo-SM
4 µL of 1 mg/mL of DiD-lipophilic dye, 250 µL of 1 mg/mL of BDEs and 50 µL of 1X PBS were mixed and incubated for 30 min at RT. Consistently, the mixture was centrifuged using UFC5100 Amicon Ultra-0.5 Centrifugal Filter Unit, 100 kDa to remove free DiD-lipophilic dye. Fluorescence intensity of DiD-labeled BDEs was measured at 2–3 × 10¹⁰ using In Vivo Imaging System Spectrum (IVIS). When preparing DiD-labeled BDEs@lipo-SM, 4 µL of 1 mg/mL of DiD-lipophilic dye was additionally added during preparation of liposome loaded SM. Then, after evaporation of the organic solvent, the dry lipid film is rehydrated with 500 µL of 1X PBS and finally the DiD-labeled lipid solution was achieved. Consequently, DiD-labeled BDEs@lipo-SM was prepared by a membrane extrusion method as mentioned above.
In vitro drug release kinetics of SM from BDEs, liposomes, and BDEs@lipo
In vitro drug release study was performed to determine the percentage of SM released from BDEs, liposomes, and BDEs-lipo. The in vitro drug release study was carried out using dialysis membrane (MW 12,000–14,000 Da), that allows the diffusion of free SM. The samples were were placed in the dialysis membrane bags and the dialysis membrane bags were put in glass vials with 100 mL of 1X PBS. The samples were gently rocked at 50 rpm and 37 ℃ during the process. Cumulative drug-release kinetics of SM from BDEs, liposomes, and BDEs-lipo were measured at the different time points for 24 h. At predetermined time points of 0, 1, 2, 4, 8, 12, 16, 20, and 24 h, the samples were collected and cumulative SM release was analyzed using a UV spectrophotometer at λmax 286 nm. The samples were replaced in the glass vials with the same volume of fresh buffer. The percentage of SM released was determined as follows:
$$Release \left(\%\right) = \left\ \times 100$$
Analysis of cellular uptake of BDEs@lipo-SM by flow cytometry
To determine cellular uptake of BDEs@lipo-SM, Huh7 and RAW 264.7 cells were seeded on a 12 well plate at the density of 1 × 10⁵. The cells were incubated for 24 h and subsequently 20 µL of DiD-labeled BDEs@lipo-SM was conducted in the cells. The cells were incubated at 37℃ for 1, 3, and 6 h. Then, the cells were collected for detection of the internalized fluorescence of BDEs@lipo-SM by flow cytometry.
Immunostaining and flow cytometry
To analyze the M2 macrophage proliferation by the macrophage markers in RAW 264.7 cells, flow cytometry was performed. RAW 264.7 cell line was seeded in a 12 well plate at 1 × 10⁵ cells/well. After incubation for 24 h, BDEs and BDEs@lipo-SM were added in the cells and the plate was incubated for 48 h. Non-modified BDEs or BDEs@lipo-SM were considered as a control. Then, the media was removed and cells were collected after washing with 1X PBS. The cells were blocked with 3% BSA on ice for 30 min and centrifuged at 1500 g for 5 min at 4 ℃. Then, the supernatant was removed and the cells were resuspended with 1X PBS and incubated with an eFluore 450-labeled anti-CD45 mAb, PE-labeled anti-CD86 mAb, and APC-labeled anti-CD206 mAb (dilution, 1:100) for 30 min at RT avoiding light. Subsequently, the cells were washed 3 times with 1X PBS and detected on The Cytomics™ FC 500 Flow Cytometry (Beckman Coulter, Brea, CA, USA). The result was organized by FlowJo software (BD biosciences, USA).
Flow cytometry assay using annexin V/PI staining
To evaluate cell apoptosis of BDEs@lipo-SM, apoptosis was detected using an FITC-Annexin V apoptosis detection kit (BD Pharmingen, USA). RAW 264.7 cells were seeded at the density of 1 × 10⁵ cell/well in a 12-well plate and incubated for 24 h before treatment. After 48 h of treatment of BDEs@lipo-SM at concentrations of from 0 to 200 µg/ml, both treated and untreated cells were trypsinized and collected. Then, the cells were suspended in 1X binding buffer and incubated with 2.5 µL of fluorescein isothiocyanate (FITC)-conjugated Annexin V and 5 µl of phycoerythrin (PE)-conjugated PI for 15 min in the dark at RT followed by flow cytometry.
RT-PCR
Total RNA was isolated from Huh7 and RAW 264.7 cells treated with a serial dilution of BDEs@lipo-SM ranging from 1 µg/mL to 50 µg/mL for 48 h. cDNA was prepared from the total RNA and consistently RT-PCR was performed using Hifair III One Step RTqPCR SYBR Green Kit (Yeasen, China) according to the manufacturer’s instructions. Primer sets are described in Table 1. To determine apoptosis of immune cells, apoptosis and inflammatory-related genes were examined including BAX, IL-6, IL-1b, TNF-α and the reference gene, GAPDH. To evaluate the gene expression of the targets, the solution containing DNA polymerase, primer pair and cDNA was pre-heated for 5 min at 95˚C to activate and denature non-specific DNA binding. Immediately, the reaction was performed by 40 cycles of 95˚C for 20 s, 55˚C for 30 s and 68˚C for 20 s using QuantStudio 3. Relative gene expression was calculated as the ΔΔCT method and normalized to the expression of GAPDH as a standard for gene expression quantification. All qRT-PCRs were performed in triplicate, and the data are presented as means ± standard errors of the means (S.E.M).
Western blot analysis
The cells were washed with 1X PBS on ice. Then, the ice-cold RIPA buffer including protease and phosphatase inhibitor was added in the cells and the cells were scraped off and the cell suspension was transferred into a 1.5mL microcentrifuge tube. The tube was centrifuged at 14,000 g at 4 °C for 10 min. The supernatant was transferred to a fresh tube. Cell lysates were analyzed for total protein concentration using the BCA protein assay kit (Beyotime, Shanghai, China). 25 µg of total protein were loaded on 10% acrylamide gel. Relative enzyme levels were quantified using antibodies; mouse mAb p-ERK 1/2; ERK 1/2; p-JNK; JNK; p-p38; p38.
Measurement of AST/ALT level
To evaluate the liver damage, after treatment of BDEs@lipo-SM, the blood was collected and placed at room temperature for 2 h to separate the serum sample. The blood was then centrifuged at 1000 g for 15 min and the supernatant was taken followed by stored at -80 ℃. Serum aspartate aminotransferase (AST) and alanine aminotransferase (ALT) levels were assessed in blood plasma by Wuhan Servicebio Technology Co., Ltd. (Wuhan, China) using Chemray 240 automatic biochemical analyzer (Rayto, Shenzhen, China).
Animal studies and ethical approval of animal experiment
18–20 g of male C57BL/6J mice at the age of 6–7 weeks were purchased from Sino-British SIPPR/BK Lab. Animal Co., Ltd. (Shanghai, China) and housed under pathogen-free conditions. The animal experiments were conducted at School of Pharmacy in Fudan University in accordance with the Guiding Principles for the Care and Use of Experimental Animals (Shanghai, China). To induce hepatotoxicity, the mice were injected intraperitoneally with 500 mg/kg of APAP and right after treated with 200 µL of 1 mg/mL of BDEs, 150 mg/kg NAC, and 200 µL of 1 mg/mL of BDEs@lipo-SM (based on the BDEs concentration) once. Before being treated, mice were fasted for 24 h. After 24 h of administration, the mice were anesthetized and humanly sacrificed by cervical dislocation and the liver was collected for subsequent analysis.
Statistical analysis
Statistical significance was determined using the t-test, and a p-value < 0.05 was considered statistically significant, and non-significant result was recorded as N.S. The t-test was conducted through GraphPad Prism 7.0 software (CA, USA).


留言 (0)