Animals
The C57BL/6N male mice, obtained from Vital River Company, were acclimated to the environment for one week prior to the study. The DR5 Knockout mice were generously provided by Professor Yinming Liang (Xinxiang Medical University), and bred in the animal facility of Joint National Laboratory for Antibody Drug Engineering. Mice were housed in a specific pathogen-free (SPF) environment, with up to five animals per cage, following a 12-h light/dark cycle, maintaining relative humidity between 55–70%, temperature conditions at 22–25 °C, and provided ad libitum access to food and water.
For the mice cardiac I/R injury model, anesthesia was induced using 2% isoflurane while ensuring proper disinfection with iodine solution and alcohol. A thoracic incision between the ribs allowed for exposure of the heart. Ligation of the left anterior descending coronary artery (LAD) was accomplished utilizing a 6–0 suture for a period lasting 40 min, after which reperfusion commenced upon release of this ligation. Subsequently, muscle and skin were sutured using a 4–0 suture for closure.
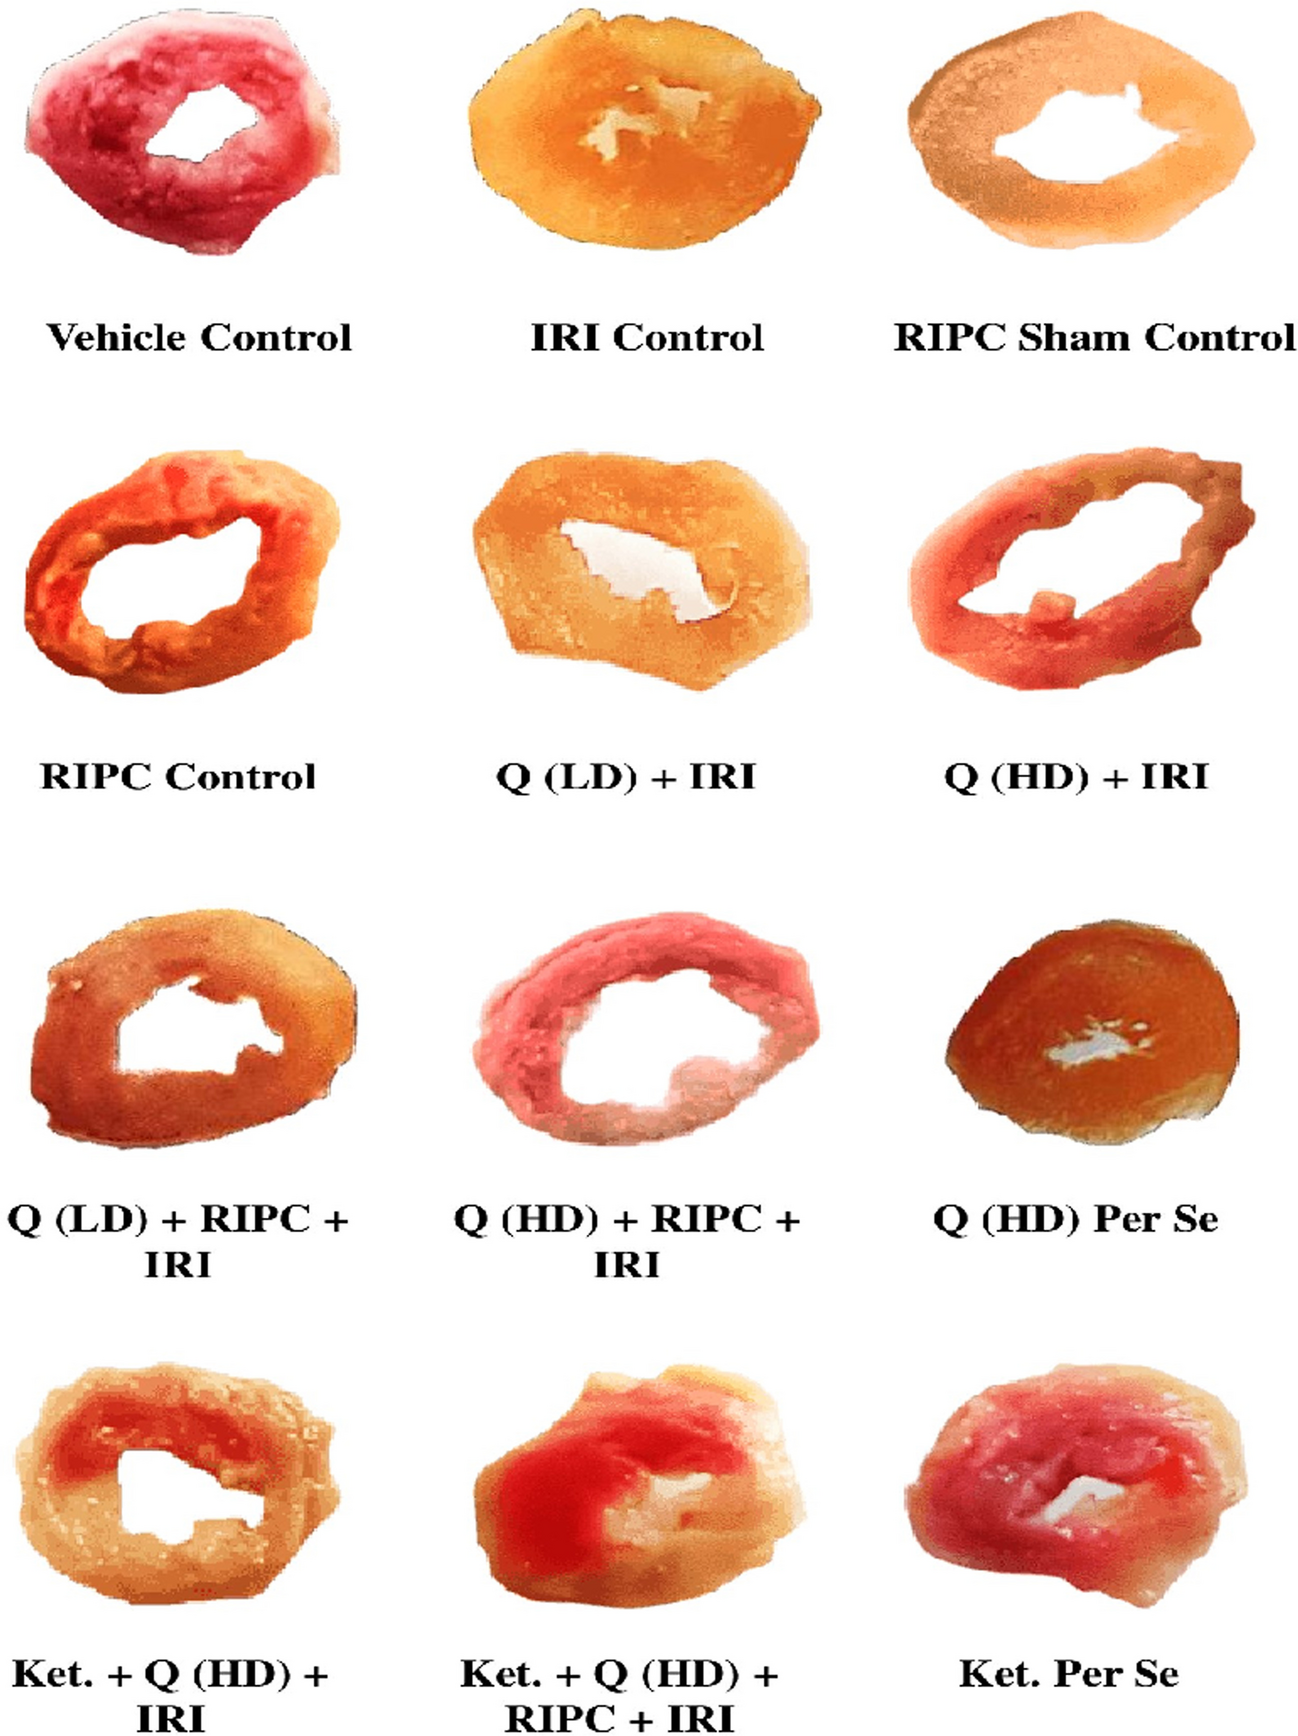
For Evan’s blue and TTC double staining, mice were killed 24 h after I/R injury. The blood vessels at the ligation site were ligated using a 4–0 suture and followed by Evans blue injection through the aorta. The hearts were excised and cryopreserved at -80 °C. The hearts under the ligation site were cut into five slices for TTC staining, and quantification of the infarct (white), risk (red), and non-infarct (blue) areas were analyzed using ImageJ software.
Preparation of Mouse DR5-Fc Fusion Protein
The extracellular segment of mouse DR5 and the Fc region of mouse IgG1 were constructed into the pcDNA3.1 vector and subsequently transfected into 293F cells. The mDR5-Fc protein was purified from 293F culture supernatant using protein A affinity chromatography, followed by buffer exchange into PBS. Subsequently, the purified protein was filtered through a 0.22 μm membrane and quantified using the BCA assay kit. Purity assessment was performed via SDS-PAGE Coomassie Brilliant Blue staining.
Neutrophil Depletion
To deplete neutrophils in mice, an anti-Ly6G antibody (Biolegend, 127,649) or isotype antibody (Biolegend, 400,565) was administered i.v. 0.2 mg per mouse, and the depletion efficiency was assessed using flow cytometry.
Isolation and Culture of Primary Cells
For isolation of neutrophils from mouse bone marrow, mice were euthanized by cervical dislocation. The bone marrow was flushed into 1640 medium and filtered through a 40 μm sieve. Subsequently, cells were centrifuged at room temperature for 5 min at 500 g and resuspended in 2 mL of supplemented 1640 medium containing 10% FBS. The cell suspension was then transferred to a new 15 mL centrifuge tube containing Percoll solutions with concentrations of 78% and 65%. Centrifugation was performed at a speed of 2500 rpm for 30 min. The cell layer located at the interface between the layers of Percoll solutions was carefully collected into another clean 15 mL centrifuge tube, followed by washing with PBS. Finally, purified neutrophils were obtained and cultured short-term in a complete growth medium containing 10% FBS supplemented with 1640 medium.
The isolation of cardiomyocytes was performed according to a previously described protocol [14]. Briefly, neonatal rat ventricular myocytes (NRVMs) were isolated from 2 d old Wistar rats by mincing the hearts and digesting in a C-tube containing enzymatic solution (Worthington Biochemical) using gentleMACS™ (Miltenyi Biotec). Cardiomyocytes were then collected through percoll centrifugation and cultured in a medium supplemented with 20% FBS (Gibco).
Co-Culture of Neutrophil Derived NETs and NRVM
Mouse bone marrow-derived neutrophils were stimulated with mTRAIL alone or in combination with mDR5-Fc, washed twice with culture medium, resuspended in 1640 medium supplemented with 10% FBS, and subsequently co-cultured with NRVM cells. After a duration of 24 h, the supernatant of the NRVM cell culture was collected to quantify LDH levels, while NRVM apoptosis was assessed using a TUNEL assay.
Immunohistochemical
The left and right atria appendages were incised, and the left ventricle and right ventricle were flushed with 15–20 mL of heparinized PBS thoroughly to remove any residual blood. Subsequently, the hearts were fixed in a solution containing 4% paraformaldehyde.
After embedding, sectioning, dewaxing, and hydration of the tissue, endogenous peroxidase activity was blocked using hydrogen peroxide. The tissue slices were incubated 1 h with 5% BSA at room temperature and then overnight for primary antibody binding at 4 °C. Secondary antibodies were then incubated at room temperature for 1 h. Finally, the slices were analyzed using a microscope scanning system after chromogenic staining, hematoxylin counterstaining of nuclei, and sealing with a neutral resin.
Immunofluorescence
The tissue sections underwent deparaffinization, hydration, and antigen retrieval and were subsequently incubated in 1% Triton X-100 PBS. Following blocking with 5% BSA, the slices were then incubated overnight at 4 °C with the primary antibody. Subsequently, the secondary antibody was applied, and cellular nuclei were stained with DAPI. Finally, fluorescence microscopy was employed to capture images of the slides.
For TUNEL staining, the heart tissue sections were subjected to a TUNEL staining kit according to the manufacturer’s protocol and subsequently examined using fluorescence microscopy.
Western Blot
The mouse heart was lysed using RIPA lysis buffer supplemented with protease inhibitors and PMSF, followed by tissue homogenization. Subsequently, the lysate was incubated on ice for 30 min. After centrifugation, the supernatant was collected and subjected to BCA protein quantification. SDS-PAGE analysis was conducted, and the proteins were transferred onto a PVDF membrane. The membrane was then incubated with 5% skim milk and primary antibody overnight at 4 °C. The membrane was incubated with a secondary antibody and substrate for detection.
qPCR
RNA was extracted from mouse cardiac tissue using the TRIZOL method, followed by reverse transcription into cDNA. qPCR was performed and subsequent detection was carried out using QuantStudio 3. The primer sequences used for qPCR were as follows.
Tnfa AGGCGGTGCCTATGTCTCA, GGGAGGCCATTTGGGAACTTCT; Il1b TGCCACCTTTTGACAGTGATG, TGATGTGCTGCTGCGAGATT; Mpo AGTTGTGCTGAGCTGTATGGA, CGGCTGCTTGAAGTAAAACAGG; Cxcl15 TGGGTGAAGGCTACTGTTGG, AGCTTCATTGCCGGTGGAAA; Icam1 CCGCTACCATCACCGTGTATT, GGTGAGGTCCTTGCCTACTT; Itgam AAAGAACAACACACGCAGGC, CAGAACTGGTCGGAGGTTCC; Pad4 GGCTCATTCCCCTCACCATC, TTGTCAGAAACCCTGCACAC; Gapdh GGTGAAGGTCGGTGTGAACG, CTCGCTCCTGGAAGATGGTG.
Detection of Peripheral Blood and Plasma Samples
The quantification of plasma lactate dehydrogenase (LDH) and creatine kinase (CK) levels was conducted using biochemical instrumentation (IDEXX). For dsDNA detection, ELISA was performed according to the manufacturer’s protocol (Solarbio, P9740).
Flow Cytometry
After perfusion with PBS, the mouse heart was dissected to remove adherent tissues and the aorta [17]. The mouse heart was then weighed, minced, and digested in a digestion solution containing type II collagenase (Worthington Biochemical), neutral protease (Roche), and DNase I (D4513, Sigma-Aldrich). Subsequently, the digestion was neutralized with 2%FBS, and the digested cells were passed through a 70 μm sieve and lysed red blood cells. Anti-mouse CD16/32 antibody (eBioscience, 14–0161-85) was used for blocking at 4 °C followed by incubation with antibodies (CD45, eBioscience, 47–0451-82; CD11b, eBioscience, 63–0112-82; Ly6G, eBioscience, 46–9668-82) at 4 °C in the dark for 30 min. Finally, flow cytometry analysis was performed using Bio-Rad ZE5.
Quantification and Statistical Analysis
The data analysis in this study was performed using GraphPad Prism9. The results were presented as means ± SEM and subjected to statistical analysis using the unpaired t test or one-way ANOVA followed by Tukey’s post hoc test (*P < 0.05, **P < 0.01, ***P < 0.001, ****P < 0.001).

留言 (0)