
記住我


Participants were recruited to assess the impact of calcifediol supplementation on the efficacy of ChAdOx1 nCoV-19 vaccine. None of the subjects had COVID-19 disease prior to vaccination (Supplementary Table 1). The subjects were divided into 2 groups, the calcifediol arm and the placebo arm. After consideration of the criteria for inclusion and exclusion, a total of 24 adult subjects were selected and the transcriptomic analysis was performed at 3 time points; baseline, 3rd month, and 6th month as shown in the flow diagram (Fig. 1). Plasma levels of 25(OH)D, calcitriol, iPTH, and serum calcium at all time points were recorded (Table 1). Based on the questionnaire records and history obtained during each visit, all the subjects had similar duration of sun exposure/day. It may also be noted that anti-S antibody titers did not show any significant difference between the two groups, either at 3rd or 6th month (Supplementary Fig. 2).
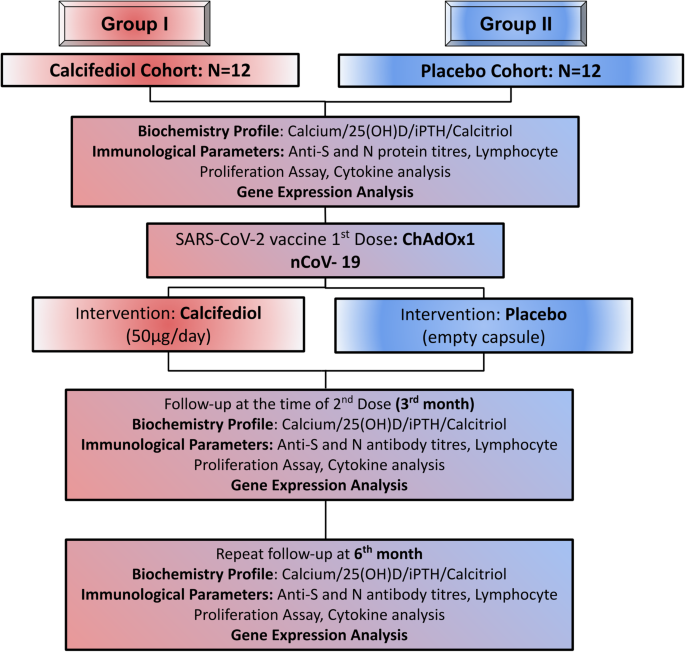
Fig. 1: Study design.
Flow diagram showing the number of subjects recruited in the calcifediol cohort (treated group) and the placebo cohort (placebo group) receiving intervention for 6 months, starting from the day of administration of the 1st dose of ChAdOx1 nCoV-19 (COVISHIELD) vaccine. Various biochemical and immunological parameters were investigated at baseline, 3rd month, and 6th month. For gene expression analysis, peripheral blood mononuclear cells (PBMCs) were isolated and analyzed at baseline, 3rd month, and 6th month.
Table 1 Clinical and Biochemical characteristics of the study subjects at all time pointsAt first, we assessed the impact of calcifediol supplementation on plasma 25(OH)D levels. Baseline plasma 25(OH)D levels were similar in both the treated (mean ± SD, ng/ml) (11.39 ± 6.9) and the placebo cohort (13.91 ± 5.98) (p = 0.72). In the treated group, the plasma 25(OH)D levels (mean ± SD, ng/ml) increased at the 1st (73.20 ± 46.96) (p = 0.0006) (Supplementary Table 2), 3rd month (134.9 ± 42.8) (p < 0.0001) and then plateaued at the 6th month (85.01 ± 34.49) (p < 0.0001) post calcifediol supplementation, indicative of the effectiveness of calcifediol in boosting Vitamin D levels. In the placebo arm, the plasma 25(OH)D levels remained lower throughout the study period (Fig. 2a).
Fig. 2: Impact of Calcifediol Supplementation on Calcemic Profile.
Total plasma 25(OH)D, plasma iPTH, serum calcium and plasma calcitriol levels at baseline, 3rd month, and 6th month in both treated (N = 12) and placebo groups (N = 12). Here, “pΔ” represents p value of the significant delta changes between placebo and calcifediol supplemented groups. Δ t-baseline, represents change in values of 3rd and 6th month with respect to baseline. Two-way ANOVA was performed to determine the significance. The data is represented as Mean ± SD.
Elevated plasma iPTH levels are indicative of calcium deficiency, triggering processes to increase blood calcium, often at the expense of bone mineralization. Calcifediol supplementation may contribute in maintaining adequate calcium levels, potentially reducing the need for heightened iPTH secretion. At baseline, the plasma iPTH levels (mean ± SD, ng/ml) in the treated group (53 ± 19.97) were similar to the placebo cohort (60.34 ± 28.67) (p = 0.85). Post calcifediol supplementation, the iPTH levels in the calcifediol cohort dipped (38.1 ± 13.3 ng/ml) with a slight increase in the placebo cohort (65.65 ± 37.08 ng/ml) at 3rd month. At 6th month, there was no significant change in the plasma iPTH levels in both the groups (Fig. 2b).
Similarly, in the treated group, calcifediol supplementation did not alter the serum calcium levels (mg/dl) (9.55 ± 0.5) at 3rd month and (9.61 ± 0.3) level at 6th month (Fig. 2c). Nevertheless, this finding does not undermine the importance of vitamin D in maintaining optimal calcium levels for overall health, bone density, and proper immune function.
Calcitriol concentrations and vitamin D signalingCalcitriol is the active hormonal form of vitamin D, and plays a pivotal role in regulating calcium and phosphorus levels, bone mineralization, and immune responses. Individuals supplemented with calcifediol demonstrated elevated 25(OH)D levels and exhibited a significant increase in mean (±SD) calcitriol levels (pmol/l) at 3rd month (165.04 ± 53.24, Δ p = 0.03) and at 6th month (155.6 ± 50.6, Δ p = 0.02) (Table 1, Fig. 2d) when the delta increase in calcitriol levels was compared with baseline levels. Further, there was a positive correlation between 25(OH)D and calcitriol levels (r = 0.286, R2 = 0.082) (p = 0.0149) (Supplementary Fig. 3). This relationship underscores the importance of calcifediol as a precursor to calcitriol, emphasizing the superiority of calcifediol over native vitamin D and the clinical relevance of maintaining optimal vitamin D status.
Outcome of calcifediol supplementation on the gene expression profile of PBMCsAt first, the proportion of lymphocytes and monocytes in the PBMCs were similar in the treated and placebo cohorts at baseline and subsequent time points.
The raw count data of the subjects was normalized with variance stabilizing transformation (VST) method of DESeq2 (Fig. 3a) and all standard statistical analysis were performed19,20,21. The combined Principal Component Analysis (PCA) plot of both the cohorts showed natural heterogeneity (Supplementary Fig. 4) because of various confounding variables like age, BMI and gender (Supplementary Figs. 5, 6, 7). Since the placebo subjects did not receive any intervention, the PCA plot of the placebo group (Supplementary Fig. 8) did not show any clustering but randomly arranged at different time points, whereas the PCA plot of calcifediol intervention cohort (Fig. 3b) showed different clusters at each time-point as an outcome of intervention, indicating a time-dependent effect of the calcifediol supplementation. Therefore, the changes in gene expression at different time points were mainly compared within the treated group while the placebo group served as a reference cohort.
Fig. 3: Differentially expressed genes (DEGs) identification.
a Normalization of raw counts by DESeq 2 using Variance Stabilizing Transformation (VST). b Principal Component Analysis (PCA) of calcifediol supplemented (treated) cohorts, where blue bubbles represent baseline, red bubbles represent 3rd month and green bubbles represent 6th month. c Comparisons of the numbers of differentially expressed genes [differentially expressed (DE) features] at various time points. d Venn Diagrams depicting common and unique Upregulated and (e) downregulated differentially expressed genes in the calcifediol supplemented subjects at the 3rd and 6th month.
A subgroup analysis of gene expression from treated baseline to treated 3rd and treated 6th month revealed a total number of 1725 genes and 10353 genes respectively being expressed differentially at log2 fold change of 1 with a significance level of p < 0.05 (Fig. 3c). Upon comparing the differentially expressed genes (DEGs) of this subgroup, we found that 649 genes (Fig. 3d) were consistently upregulated and 270 genes (Fig. 3e) were consistently downregulated at both 3rd and 6th month during calcifediol supplementation. Since the comparison of the treated group at 6th month versus baseline demonstrated the maximum number of DEGs and majority of those DEGs also appeared in the 3rd month, this comparison was chosen primarily for downstream analysis.
Differentially expressed genes (DEG) analysisDEG analysis of the calcifediol supplemented (treated) group at 6th month in comparison to baseline of the same group revealed that at the 6th month of calcifediol supplementation, a total of 10,353 genes were differentially regulated of which 6389 genes were upregulated and 3964 genes were downregulated. Whereas 1064 genes were found to be upregulated and 661 genes were downregulated at 3rd month as compared to baseline. As depicted in the respective volcano plots the significant differentially expressed genes with fold change more than 1 and having adjusted p value < 0.05 are marked in bright red whereas the non-significant genes with fold change less than 1 and having adjusted p value > 0.05 are marked in light blue (Figs. 4a, b) and the top 50 DEGs whose expression had most variance in these two sub-analyses were depicted in heatmaps (Fig. 4c, d) respectively. Genes involved in multiple biological processes appeared to be involved and the key genes of this comparison included PTGS2, EREG, RSG1, AREG, NR4A3, EGR3, GSTM1, CYP27B1 and CYP24A1. As a proof of concept, we also checked the expression of genes related to VDR signaling (VDREs) and found that the expression of these 114 genes increased at 3rd month and plateaued at 6th month of the calcifediol supplementation (Supplementary Fig. 9, Supplementary Table 3). As important mediators of vitamin D action, the expression of VDR, 25-hydroxyvitamin D 1-alpha-hydroxylase (CYP27B1) and vitamin D3 24-hydroxylase (CYP24A1) was assessed in the calcifediol supplemented subjects. At first, we observed, that the expression of VDR increased at both time points from baseline expression levels (Log2 fold change at 3rd month: 0.74, 6th month: 0.67). The expression of CYP27B1 was high at 3rd month which plateaued at 6th month (Log2 fold change at 3rd month: 0.9, 6th month: 0.244). Further, in the calcifediol supplemented subjects, there was a mild increase in the expression of CYP24A1 at the 3rd month followed by a higher increase at 6th month (Log2 fold change: 3rd month: 0.06, 6th month: 1.12 from baseline). As already stated, that plasma levels of calcitriol plateaued by 6th month, which coincides with increase in CYP24A1 expression during that period (Supplementary Fig. 10). In view of the higher vitamin-D and calcitriol levels attained in the supplemented subjects, the expression of vitamin D binding protein (DBP), was also assessed. There was an increase in DBP expression at 3rd month, which reverted to baseline levels at 6th month (Log2 fold change; 3rd month: 2.217, 6th month: 0).
Fig. 4: Differentially Expressed Genes (DEG) analysis.
Volcano plots of differentially expressed genes (DEGs) between, a Treated 6th month vs Treated baseline, b Treated 3rd month vs Treated baseline. The log2 fold change was plotted against the P value (−10 log base 10). Significant DEGs genes with Log2 fold change > 1.0 and having adjusted p value < 0.05 are shown in red whereas the non-significant genes with Log2 fold change < 1.0 and having adjusted p value < 0.05 are shown in blue. Heatmaps of DEGs showing, c The top upregulated and downregulated genes of Treated 6th month vs Treated baseline and, d The top upregulated and downregulated genes of Treated 3rd month vs Treated baseline. The green color represents higher expression of genes and the red color denotes lower expression of genes and average expression is represented by white color.
It may also be noted that, some of the genes related to differences in sex also appeared in the comparison in a few subjects (Fig. 4), although they did not influence the subsequent pathway analysis.
Upregulation of innate and adaptive immune signaling pathways upon calcifediol supplementationThe role of vitamin D in enhancing innate immunity is well known. When we compared the treated 6th month subjects versus their baseline data, the KEGG Gene set enrichment analysis (GSEA) revealed genes involved in the NOD like receptor, as well as JAK/STAT and TGF β signaling pathways, were upregulated at 6th month (Fig. 5), indicating higher induction of VDR signaling in DCs and macrophages potentially inducing antimicrobial or antiviral proteins like β-defensins and cathelicidins. While defensins protects the host cells by disrupting microbial membranes including SARS-CoV-2, cathelicidins attract various immune cells via chemotaxis and also enhance phagocytosis by macrophages, increasing vascular permeability and ultimately activation of B and proliferation of T cells12, thus strengthening innate immune responses that appear to be augmented by calcifediol supplementation.
Fig. 5: Gene Set Enrichment Analysis (GSEA).
GSEA analysis of the KEGG pathway enrichment for the samples of Treated 6th month vs baseline revealed the genes involved in (a) NOD like receptor, (b) JAK/STAT and (c) TGF BETA signaling pathways that were upregulated and genes involved in (d) Systemic Lupus Erythematosus (SLE) that were downregulated in the same comparison. The ranked gene list is shown in the middle, red indicates upregulation, blue indicates downregulation and the black vertical line indicates the gene set.
In case of adaptive anti-viral responses, firstly, we observed a mild increase in the expression of IFN-γ at 3rd and 6th month post calcifediol supplementation in the treatment group (Log2 fold change; 3rd month: 0.149, 6th month: 0.44), which coincided with increase in its receptor, IFNGR1 (Log2 fold change at 3rd month: 0.456, 6th month: 1.108). Key genes associated with T cell activation and proliferation including, CD25, CD69, CD71 and CD38 were found to be upregulated (p < 0.01 at 6th month). Genes associated with various anti-viral biological processes, including T cell receptor signaling pathway, anti-viral cellular responses and memory T cell responses were also upregulated (Table 2).
Table 2 List of main biological processes and the genes involved that were found differentially upregulated upon calcifediol supplementationDownregulation of coronavirus disease and inflammatory pathwaysUpon comparing the treated 6th month with the treated baseline, the downregulated DEGs function was explored using KEGG pathway enrichment analysis. The enrichment analysis indicated that Coronavirus disease, Neutrophil extracellular trap formation (NET), Systemic lupus erythematosus (SLE), and Necroptosis were among the topmost down-regulated pathways. Notably, the Coronavirus disease pathway was one of the most consistently down-regulated pathways, not just in the comparison between the treated 6th month vs treated baseline (Supplementary Fig. 11) but also in other comparisons, mainly, treated 6th month vs treated 3rd month (Supplementary Fig. 12).
Next, the protein-protein interaction (PPI) network of the genes related to Coronavirus disease showed significant enrichment (p < 1.0e-16). Neutrophil extracellular trap formation (NET) and Systemic lupus erythematosus (SLE) also showed significant enrichment in PPI analysis (p < 1.0e-16) in the STRING database (Fig. 6). The upregulated pathways shown by KEGG pathway analysis in the treated 6th month vs treated baseline included JAK-STAT signaling, TGF beta signaling, NF-kappa B signaling pathway and cell cycle (Supplementary Fig. 13) some of which were also seen in comparison of treated 6th month versus 3rd month (Supplementary Fig. 14).
Fig. 6: Protein-Protein Interaction (PPI) Networks.
STRING analysis showing Protein-Protein Network of genes related to (a) Coronavirus Disease, (b) Neutrophil extracellular traps (NETs), and (c) Systemic lupus erythematosus (SLE) that are downregulated and showing significant Protein-protein interaction (PPI) enrichment (P < 1.0e-16). Network nodes represent proteins and each node represents all the proteins produced by a single, protein-coding gene locus. Edges represent protein-protein associations. These associations are meant to be specific and meaningful, i.e., proteins jointly contribute to a shared function; with or without physical binding with each other.
Gene ontology analysis on the role of calcifediol supplementation in biological processesThe Gene ontology analysis revealed the role of calcifediol in upregulating about 376 biological processes (Supplementary Table 4) in comparison between treated 6th month versus treated baseline samples. Some of the relevant pathways included genes involved in the activation and regulation of innate immune responses, memory T cell responses, positive regulation of T cell chemotaxis signaling, T cell receptor signaling pathway, B cell receptor signaling, Notch signaling pathway, cytokine mediated signaling pathway, defense and cellular response to virus, and calcium ion transmembrane transport, many of which are important in generating antiviral responses. Of note, many genes that are related to generation and maintenance of memory T cells responses were found to be upregulated, indicating the positive impact of calcifediol supplementation in improving efficacy of COVISHIELD vaccine. The genes corresponding to these pathways are shown in Table 2. Calcifediol also downregulated nearly 157 biological processes (Supplementary Table 5). Some of these processes included mRNA splicing, via spliceosome, rRNA processing, and transcription by RNA polymerase II.
Genes related to memory T cells are upregulated among the differential expressed genesIn the gene ontology analysis, many genes related to the memory T cell function were found to be upregulated. Since the main objective of the intervention (calcifediol) was to improve the efficacy of the COVISHIELD vaccine, therefore, we further tried to validate the expression of key genes required for the maintenance of memory T cell responses in representative samples. The expression of EOMES, ID3, IL7R, and BCL6 was confirmed by RT-PCR using TaqMan probes (Supplementary Table 6) and the results were similar with RNA transcriptome analysis. We observed that the expression of all 4 genes, particularly, ID3, IL7R, and BCL6 increased in 3rd month (p < 0.05) post calcifediol supplementation (Fig. 7). However, in the 6th month, the expression levels of these genes returned to near baseline levels. Taken together, the results from RT-PCR indicate improvement in memory T cell responses post-calcifediol supplementation in the subjects.
Fig. 7: Activation of genes associated with memory T cell responses.
Bar graphs show relative fold changes among placebo and treated subjects (N = 6) at baseline, 3rd month, and 6th month as validated by RT-PCR. Two-tailed student’s t-test were performed to determine the significance. The data is represented as Mean ± SD.
留言 (0)