
記住我
All cell lines were incubated at 37 °C with 5% CO2 and maintained in sterile conditions. Stock cells were cultured in Dulbecco’s modified Eagle’s medium (DMEM) containing 4500 mg/L glucose, L-glutamine, sodium pyruvate, and sodium bicarbonate supplemented with 10% FCS (Sigma-Aldrich) and 1% penicillin/streptomycin (10,000 U/ml penicillin and 10 mg/ml streptomycin, Sigma-Aldrich). For all experiments involving inducible TRE-dependent shRNAs, cells were cultivated in complete DMEM supplemented with 1 µg/mL doxycycline (DOX) that was changed every 48 h. For time course experiments involving DOX inducible constructs, cells were cultured in DOX-containing medium for 36 h prior to time course start for up to 12 days.
Primary cell culturePrimary murine liver tumor cell lines were isolated from sterile resected and digested liver tumors as previously described [17]. In brief, liver tumors were resected with sterile instruments and washed in sterile PBS prior to digestion. Then tumor tissue was minced and resuspended in a mix of 4 mg/mL collagenase and dispase (w/v in sterile, serum-free Dulbecco’s Modified Eagle’s medium (DMEM, Sigma)) at 37 °C for 30 min with gentle shaking. The dissociated tumor cells were then washed with complete DMEM (supplemented with 10% (v/v) fetal bovine serum and 1% penicillin/streptomycin) and plated on collagen-coated plates (PurCol, Cell Systems; 0.05 mg/mL). Primary cultures were passaged until visibly free from other contaminating cell types.
Molecular cloningLentiviral overexpression construct for Mfrn1 was generated using NEBuilder® HiFi DNA Assembly of a PCR product generated from (pENTR223-SLC25A37) obtained from DKFZ core facility and (pDEST6.2/V5-DEST).
Guide cloning and shRNA cloning were performed as previously described [17]. Briefly, individual single guide RNAs (sgRNA) for CRISPR/Cas9 effectors were designed using the web tool CHOPCHOP [18] and subcloned into the respective vectors.
For effective RNAi-mediated interference of target genes, potent shRNAs were predicted using the SplashRNA algorithm described by Pelossof et al. [19] and ligated into the respective backbones. PCR amplified and digested oligomers were ligated into the MlPe construct to ensure constitutive hairpin expression.
To test sgRNA and shRNA potency, target cells were transduced with a low MOI (< 0.7) to allow single integration and selected with Puromycin. Knockdown efficiency was analyzed by immunoblotting and qRT-PCR, comparing cells expressing targeted shRNA to Renilla luciferase-expressing cells. The two most potent shRNAs were cloned into DOX-inducible constructs (LT3-GEPIR) and used for further downstream analyses. To validate correct and effective site-specific cleavage of DNA strands by the CRISPR/Cas9 sgRNAs the T7 endonuclease1 mismatch detection assay was performed as previously described [17].
Virus production and transductionVirus production, transduction, and selection were performed as previously described [17].
gDNA isolationIsolation of genomic DNA was performed using the Puregene® Core Kit A (Qiagen) according to the manufacturer’s protocol.
ImmunoblottingImmunoblotting was performed as previously described [17].
The following antibodies were used:
Target
Species
Manufacturer
cat.#
Dilution
Primary antibodies used for immunoblotting
ACTIN
HRP-conjugated
Sigma-Aldrich
A3854
1:20,000
ACO2
Rabbit
Cell Signaling Technologies
cs6922
1:1000
ALAS1
Rabbit
Proteintech
16,200–1-AP
1:1000
Cleaved Caspase 3
Rabbit
Cell Signaling Technologies
cs9661
1:1000
Cleaved PARP
Rabbit
Cell Signaling Technologies
cs5625
1:1000
DMT1
Rabbit
Proteintech
26,312–1-AP
1:500
FECH
Mouse
Proteintech
14,466–1-AP
1:1000
FTH1
Rabbit
Cell Signaling Technologies
cs3998
1:1000
FXN
Rabbit
Abcam
ab175402
1:1000
GFP
Rabbit
Cell Signaling Technologies
cs2555
1:1000
IRP1
Rabbit
Cell Signaling Technologies
cs20272
1:1000
IRP2
Rabbit
Cell Signaling Technologies
cs37135
1:1000
ISCU
Rabbit
Proteintech
14,812–1-AP
1:1000
MFRN1
Rabbit
Proteintech
26,469–1-AP
1:1000
MFRN2
Rabbit
Abcam
ab277516
Discontinued!
1:500
OXPHOS
Mouse
Abcam
ab110411
1:500
TRANSFERRIN
Rabbit
Proteintech
10,084–2-AP
1:1000
VDAC
Rabbit
Cell Signaling Technologies
cs4661
1:1000
VINCULIN
Mouse
Sigma-Aldrich
V9131
1:4000
γH2AX
Mouse
Merck Millipore
05–636
1:200
Secondary antibodies used for immunoblotting
Goat polyclonal anti-mouse secondary antibody
HRP-conjugated
Jackson Immuno Research, 115–035-008
1:5000
Goat polyclonal anti-rabbit secondary antibody
HRP-conjugated
Jackson Immuno Research, 115–035-003
1:5000
Immunofluorescence (IF)Intracellular staining of yH2AX foci was analyzed by indirect IF and fluorescence microscopy. SNU387 cells were seeded in a density of 1 × 10⁵–5 × 10⁵ cells in 6-well plates on coverslips. For fixation, the culture medium was aspirated and cells were washed twice in 1 × PBS before adding 4% PFA in 1 × PBS for 5–8 min depending on the cell line. After fixation, cells were washed twice in 1 × PBS and permeabilized in 0.5% Triton X-100 in 1 × PBS for no longer than 5 min. Permeabilization was followed by a two-time wash in 1 × PBS and subsequent blocking in either 5% BSA or 5% goat serum in 1 × PBS supplemented with 0.3 M of Glycine and 0.1% Triton X-100 for 20 min. In the meantime, primary antibodies of different host species were diluted as indicated below in the blocking buffer. After blocking, cells were taken out of the culture dish and transferred to parafilm with cells facing up before adding 50 µl of respective primary antibody dilution to the coverslips. The cells were incubated for 1 h at RT followed by a four-time wash in 1 × PBS. The respective secondary antibodies conjugated with Alexa Fluor 594 were diluted 1:450 in 1 × PBS and mixed with a 1:20,000 dilution (1 µg/mL) of a 20-mM stock solution of Hoechst. The coverslips were incubated with 50 µl of secondary antibody mixture for 45 min at RT in the dark. The cells were then washed five times in 1 × PBS and mounted on a microscope slide cell facing down with 15 µl Mowiol® (Calbiochem). To let the Mowiol® harden, the microscope slides were kept at RT for 30 h until analysis. For long time storage, coverslips were sealed with nail polish and kept at 4 °C. Fluorescence was analyzed using the AXIO Observer.Z1 Fluorescence Phase Contrast Microscope (Zeiss, Germany) and processed with the ImageJ software.
Target
Species
Manufacturer
cat.#
Dilution
Antibodies used for indirect immunofluorescence
γH2AX
mouse
Merck Millipore
05–636
1:200
Hoechst
Sigma-Aldrich
33,342
1:20,000
Alexa Fluor® 594-conjugated a-mouse
goat
Invitrogen
A-11032
1:450
Quantitative reverse transcription PCR (qRT-PCR)qRT-PCR was performed as previously described [17]. Following primers were used: Mfrn1_F: TTGAATCCAGATCCCAAAGC;
Mfrn1_R: GTTTCCTTGGTGGCTGAAAA;
Mfrn2_f: TCGTCAAGCAGAGGATGCAGAT; and.
Mfrn2_R: GTTAAAGTGCTCTTGCAGGAAC.
Colony formation assayCFA was performed as previously described [17]. The initial cell number for seeding of each cell line in different experiments is provided in respective figure legends.
Competition assayCompetition assays were performed as previously described17. Briefly, human and murine SpCas9 competent cell lines expressing either a non-targeting sgRNA (sgCTR) or a sgRNA targeting MFRN1 were mixed with lentiviral constructs expressing either a non-targeting sgRNA or a sgRNA targeting MFRN2 together with GFP in a ratio of 30:70. For knockdown-dependent competition assays, the Cas9-dependent single-KO cells of MFRN1 or sgCTR cells were mixed in the same ratio with cells expressing either a shRNA targeting Renilla luciferase (shRen) or MFRN2 together with GFP in a DOX-dependent manner. The stimulation time with 1 µg/mL DOX began 36 h prior to the assay start and the DOX-containing medium was changed every 2 days. The cells were seeded in a final concentration of 2 × 10⁵ cells in 6-well plates with 3 technical and 3 biological replicates. The acquisition and analysis were performed using the guava easyCyte™ HT system.
Mitochondrial-cytosolic fractionationAbcam’s Mitochondrial/ Cytosolic Fractionation Kit (ab65320) and the Mitochondria Isolation Kit (Thermo Scientific, cat.:89,874) were used according to the manufacture’s protocol. In total 6 × 10⁷ cells were processed for each individual sample using pellet pestles (Sigma-Aldrich, cat.: Z359971) for dounce homogenization in 1.5 mL reaction tubes and proceeding with downstream analysis.
Apoptosis assay using Caspase-Glo® 3/7To analyze Caspase cleavage after a genetic alteration of cultured cells, Caspase-Glo® 3/7 Assay (Promega, G8091) was used according to the manufacturer’s protocol. Briefly, after defined timepoints during DOX treatment triplicates of 1.5 × 10⁴ SNU387 or 2 × 10⁴ PLC cells were seeded in 100 µl into opaque 96-well microplates (OptiPlate™, PerkinElmer). At the day of the measurement, 100 µl of Caspase-Glo® 3/7 luminescence substrate was added to each well incubated for 1 h at RT and analyzed using the EnSpire® Multimode Plate Reader (PerkinElmer).
Cell cycle analysisTo analyze changes in the cell cycle distribution after loss of MFRN1 and MFRN2, cellular DNA content was measured near 500 nm emission using a flow cytometer and 4′,6-diamidino-2-phenylindole (DAPI) as a DNA-intercalating agent. At a specific timepoint, after DOX treatment cells were harvested by collecting the culture medium together with the trypsinized cells, washed using 1 × PBS, and transferred into 1.5-ml reaction tubes. Cells were resuspended in 100 µl ice-cold PBS and 900 µl ice-cold 80% EtOH added in a dropwise fashion while vortexing to allow fixation. Cells were stored at − 20 °C for at least 24 h before further processing. At the day of measurement, EtOH fixed cells were centrifuged down, rehydrated in 1 ml PBS for 15 min, and cell number adjusted to 5 × 10⁵ cells. For DNA staining, cells were resuspended in 300 µl PBS-containing 1 µg/ml DAPI and 0.1% (v/v) TritonX-100. After 30 min incubation at RT in the dark, the cell suspension was filtered through a cell strainer cap (Falcon, cat:352,235) and analyzed at the BD LSR Fortessa flow cytometer (BD, Germany) using the BD FACS Diva software v8.0.1. Analysis and image generation were performed with FlowJo v10.
SA-ß-gal Senescence assayCytochemical detection of ß-galactosidase (ß-gal) activity in SNU387 and PLC cells was accomplished by using the chromogenic substrate X-gal and measuring its conversion to a blue indigo dye upon ß-gal cleavage at sub-physiological pH-conditions (pH = 6) [20]. For ß-gal detection, cells were seeded in the appropriate density in complete DMEM in triplicates and 6-well plates 1 day prior to treatment. After treatment, cells were incubated for at least 10 days before staining and subsequent fixation. After incubation, cells were washed twice in 1 × PBS to remove all residual medium. Then the fixation solution containing 2% (v/v) formaldehyde and 0.2% (v/v) glutaraldehyde was added and incubated for no longer than 5 min to avoid destruction of ß-gal activity. The fixed cells were washed twice with 1 × PBS and once in dH2O followed by incubation in staining solution (for 12–16 h without CO2 at 37 °C. After incubation, the staining solution was aspirated and cells were washed twice in 1 × PBS followed by a one-time wash in MeOH. Stained and fixed cells were allowed to air dry and subsequently analyzed by bright-field microscopy using the AXIO Observer.Z1 Fluorescence Phase Contrast Microscope (Zeiss, Germany).
Aconitase assayAconitase activity was measured spectrophotometrically using the Aconitase assay kit (Abcam, ab109712). Utilizing the increase in absorbance at 240 nm associated with the formation of the cis-aconitate, the aconitase activity was inferred.
Inducible hairpin harboring cells were grown in a DOX-containing medium for 6 days in triplicates. On the day of the assay, 1 × 10⁶ cells were harvested, washed with ice-cold PBS, and resuspended in 100 µl aconitase preservation solution supplemented with detergent for lysis. After 30 min incubation on ice, cells were centrifuged at 4 °C and 20,000 g for 10 min. To allow input of equal amounts of protein, protein concentration was determined as described in Sect. 3.1.3.2. Fifty microliters of the individual equilibrated lysates were transferred into the wells of the assay plate, and 200 µl of assay buffer was added and measured on a plate reader (SPECTROStar Nano microplate reader, BMG Labtech) using a kinetic program.
Calcein assayTo determine changes in intracellular iron levels, cells were incubated with Calcein-AM (Thermo Scientific, C1429) a cell membrane permeable esterase substrate, and turnoff fluorescent probe of iron ions. For that, cells were cultured in a DOX-containing medium for 6 days. One day prior to measurement, cells were split and either treated with 100 µM CPX (Sigma-Aldrich) and 100 µM DFO (Sigma-Aldrich) or left untreated. On the day of the measurement, cells were harvested and resuspended in completed DMEM-containing 1.5 µM of Calcein-AM and incubated for 45 min at 37 °C. The cell suspension was filtered through a cell strainer cap (Falcon, cat: 352,235) and analyzed at the BD LSR Fortessa flow cytometer (BD, Germany) using the BD FACS Diva software v8.0.1. Analysis and image generation were performed with FlowJo v10. To determine the difference in the labile iron pool MFI of CPX/DFO treated samples was subtracted from the non-treated samples.
Measurement of mitochondrial respirationMeasurement of the effect of MFRN1-MFRN2 loss on mitochondrial respiration was accomplished using the Seahorse XF96 Cell Mito Stress Test and the Seahorse extracellular flux analyzer (Agilent Technologies) [21]. Briefly, 1 day prior to assay measurement and time course completion doxycycline-treated cells were seeded in a volume of 100 µl per well into the Sea horse XF96 Cluture Microplate to allow cells to reach 80–90% confluency. Simultaneously, the sensory cartridge of the Extracellular Flux assay kit was hydrated using 200-µl Seahorse XF Calibrant per well and incubated at 37 °C in non-CO2 conditions for 12–18 h. On the day of the measurement, 100 mL of Sea horse assay medium was prepared by adding 1 mL of 1 g/L glucose, 1 mL 100 mM pyruvate solution, and 1 mL 200 mM glutamine solution followed by a 3-time wash of the culture microplate with 180 µl assay medium. To de-gas the cultured cells, the culture microplate was incubated in non-CO2 conditions 1 h prior to measurement. During the last 20 min before measurement, XF Cell Stress Compounds were prepared and loaded in the hydrated cartridge. For that, 20 µl of 2 µM Oligomycin was loaded into port A, 22 µL of 1 µM FCCP was loaded into port B and 25 µl of 0.5 µM Rotenenone/antimycin A was loaded into port C. Using the Seahorse XFe96 extracellular flux analyzer (Agilent Technologies, USA) and pre-installed Mito Stress Test template, the oxygen consumption rate (OCR) as well as the extracellular acidification rate (ECAR) was measured. The assay data was analyzed using the Seahorse Wave software.
Mass spectrometry-based protein analysisTo analyze changes in the proteome after experimental manipulation of cultured cells, whole-cell lysates were submitted to mass spectrometry-based protein analysis. Protein extraction was performed by directly adding a complete RIPA-lysis buffer solution to the cells, collecting the primary lysates, and proceeding to determine the protein concertation. Sample digestion, measurement, and statistical analysis were performed by the proteomics core facility (Mass Spectrometry based Protein Analysis Unit) of the DKFZ Heidelberg. Briefly, sample preparation for MS-based proteome analysis was performed using In-gel digestion. In the first step, the protein samples were run into an SDS-PAGE-gel for 0.5 cm. After Coomassie staining, the total unfractionated sample was cut out and used for subsequent Trypsin digestion according to a modified protocol described by Shevchenko et al. on a DigestPro MSi robotic system (INTAVIS Bioanalytical Instruments AG) [22]. Peptides were re-suspended in a loading buffer containing 2.5% 1,1,1,3,3,3-Hexafluoro-2-propanol, 0.1% TFA in water. LC–MS/MS analysis was carried out on an Ultimate 3000 UPLC system (Thermo Fisher Scientific) directly connected to an Orbitrap Exploris 480 mass spectrometer. Peptides were online desalted on a trapping cartridge (Acclaim PepMap300 C18, 5 µm, 300 Å wide pore; Thermo Fisher Scientific) for 3 min using 30 µl/min flow of 0.05% TFA in water. The analytical multistep gradient was carried out on a nanoEase MZ Peptide analytical column (300 Å, 1.7 µm, 75 µm × 200 mm, Waters) using solvent A (0.1% formic acid in water) and solvent B (0.1% formic acid, 80% acetonitrile in water). For 134 min, the concentration of B was linearly ramped from 2 to 38%; followed by a quick ramp to 95%; then after 2 min, the concentration of B was lowered to 2%; and a 10-min equilibration step was appended. The eluting peptides were analyzed in the mass spectrometer using the data-depend acquisition (DDA) mode. A full scan at 60 k resolution (380–1400 m/z, 300% AGC target, 45 ms maxIT) was followed by up to 1 s of MS/MS scans. Peptide features were isolated with a window of 1.4 m/z, fragmented using 26% Normalized Collision Energy (NCE). Fragment spectra were recorded at 15 k resolution (100% AGC target, 22 ms maxIT). Unassigned and singly charged eluting features were excluded from fragmentation and dynamic exclusion was set to 35 s.
Data analysis was performed as described by Ganing et al [23]. Briefly, using an organism-specific database extracted from Uniprot.org and data was analyzed by MaxQuant (version 1.6.14.0,). The identification FDR cutoffs were set at 0.01 on peptide and protein levels, respectively. The ‘Match between runs’ option was enabled to transfer peptide identifications across RAW files based on accurate retention time and m/z. Quantification was done using a label-free quantification (LFQ) approach based on the MaxLFQ algorithm [24]. A minimum of 2 quantified peptides per protein was required for protein quantification.
The statistical analysis was performed with the R-package “limma” [25]. The LFQ values were normalized via quantile normalization. Adapted from the Perseus recommendations, protein groups with non-zero intensity values in 70% of the samples of at least one of the conditions were used and applied for the imputation of randomly drawn values from a downshifted (1.8 standard deviation) and narrowed (0.3 standard deviation) intensity distribution of the individual sample [26]. The p-values were adjusted with the Benjamini–Hochberg method for multiple testing [27].
The LFQ values were used for further downstream processing and differential expression analysis. Proteins were considered as differentially expressed with a log2FC ≥ 0.6 (upregulated) or ≤ − 0.6 (downregulated) and an adjusted p-value < 0.05. Based on these data the pathway and functional annotation analysis was performed using Ingenuity pathway analysis (IPA, Qiagen) and the Database for Annotation, Visualization and Integrated Discovery (DAVID, v6.8, https://david.ncifcrf.gov/home.jsp), respectively. Data is available from the authors upon request and is publicly available via https://www.ebi.ac.uk/pride/archive/projects/PXD044780/ [28].
Copy number profilinggDNA was extracted as described and next-generation sequencing was performed at the DKFZ core facility using two lanes of a NovaSeq SP with 150 PE. Sequenced reads were aligned to the human reference genome using bwa [29] and alignments were sorted and indexed using samtools [30]. Copy-number profiles were generated using Delly’s cnv subcommand [31] with fragment-based GC correction at all short-read mappable positions in the GRCh37 genome. Because of the low coverage, the read depth window size was set to 50 kbp and the baseline ploidy to two. The read-depth signal was segmented using the DNAcopy Bioconductor package [32] using the “sdundo” method with the undo.SD parameter set to three.
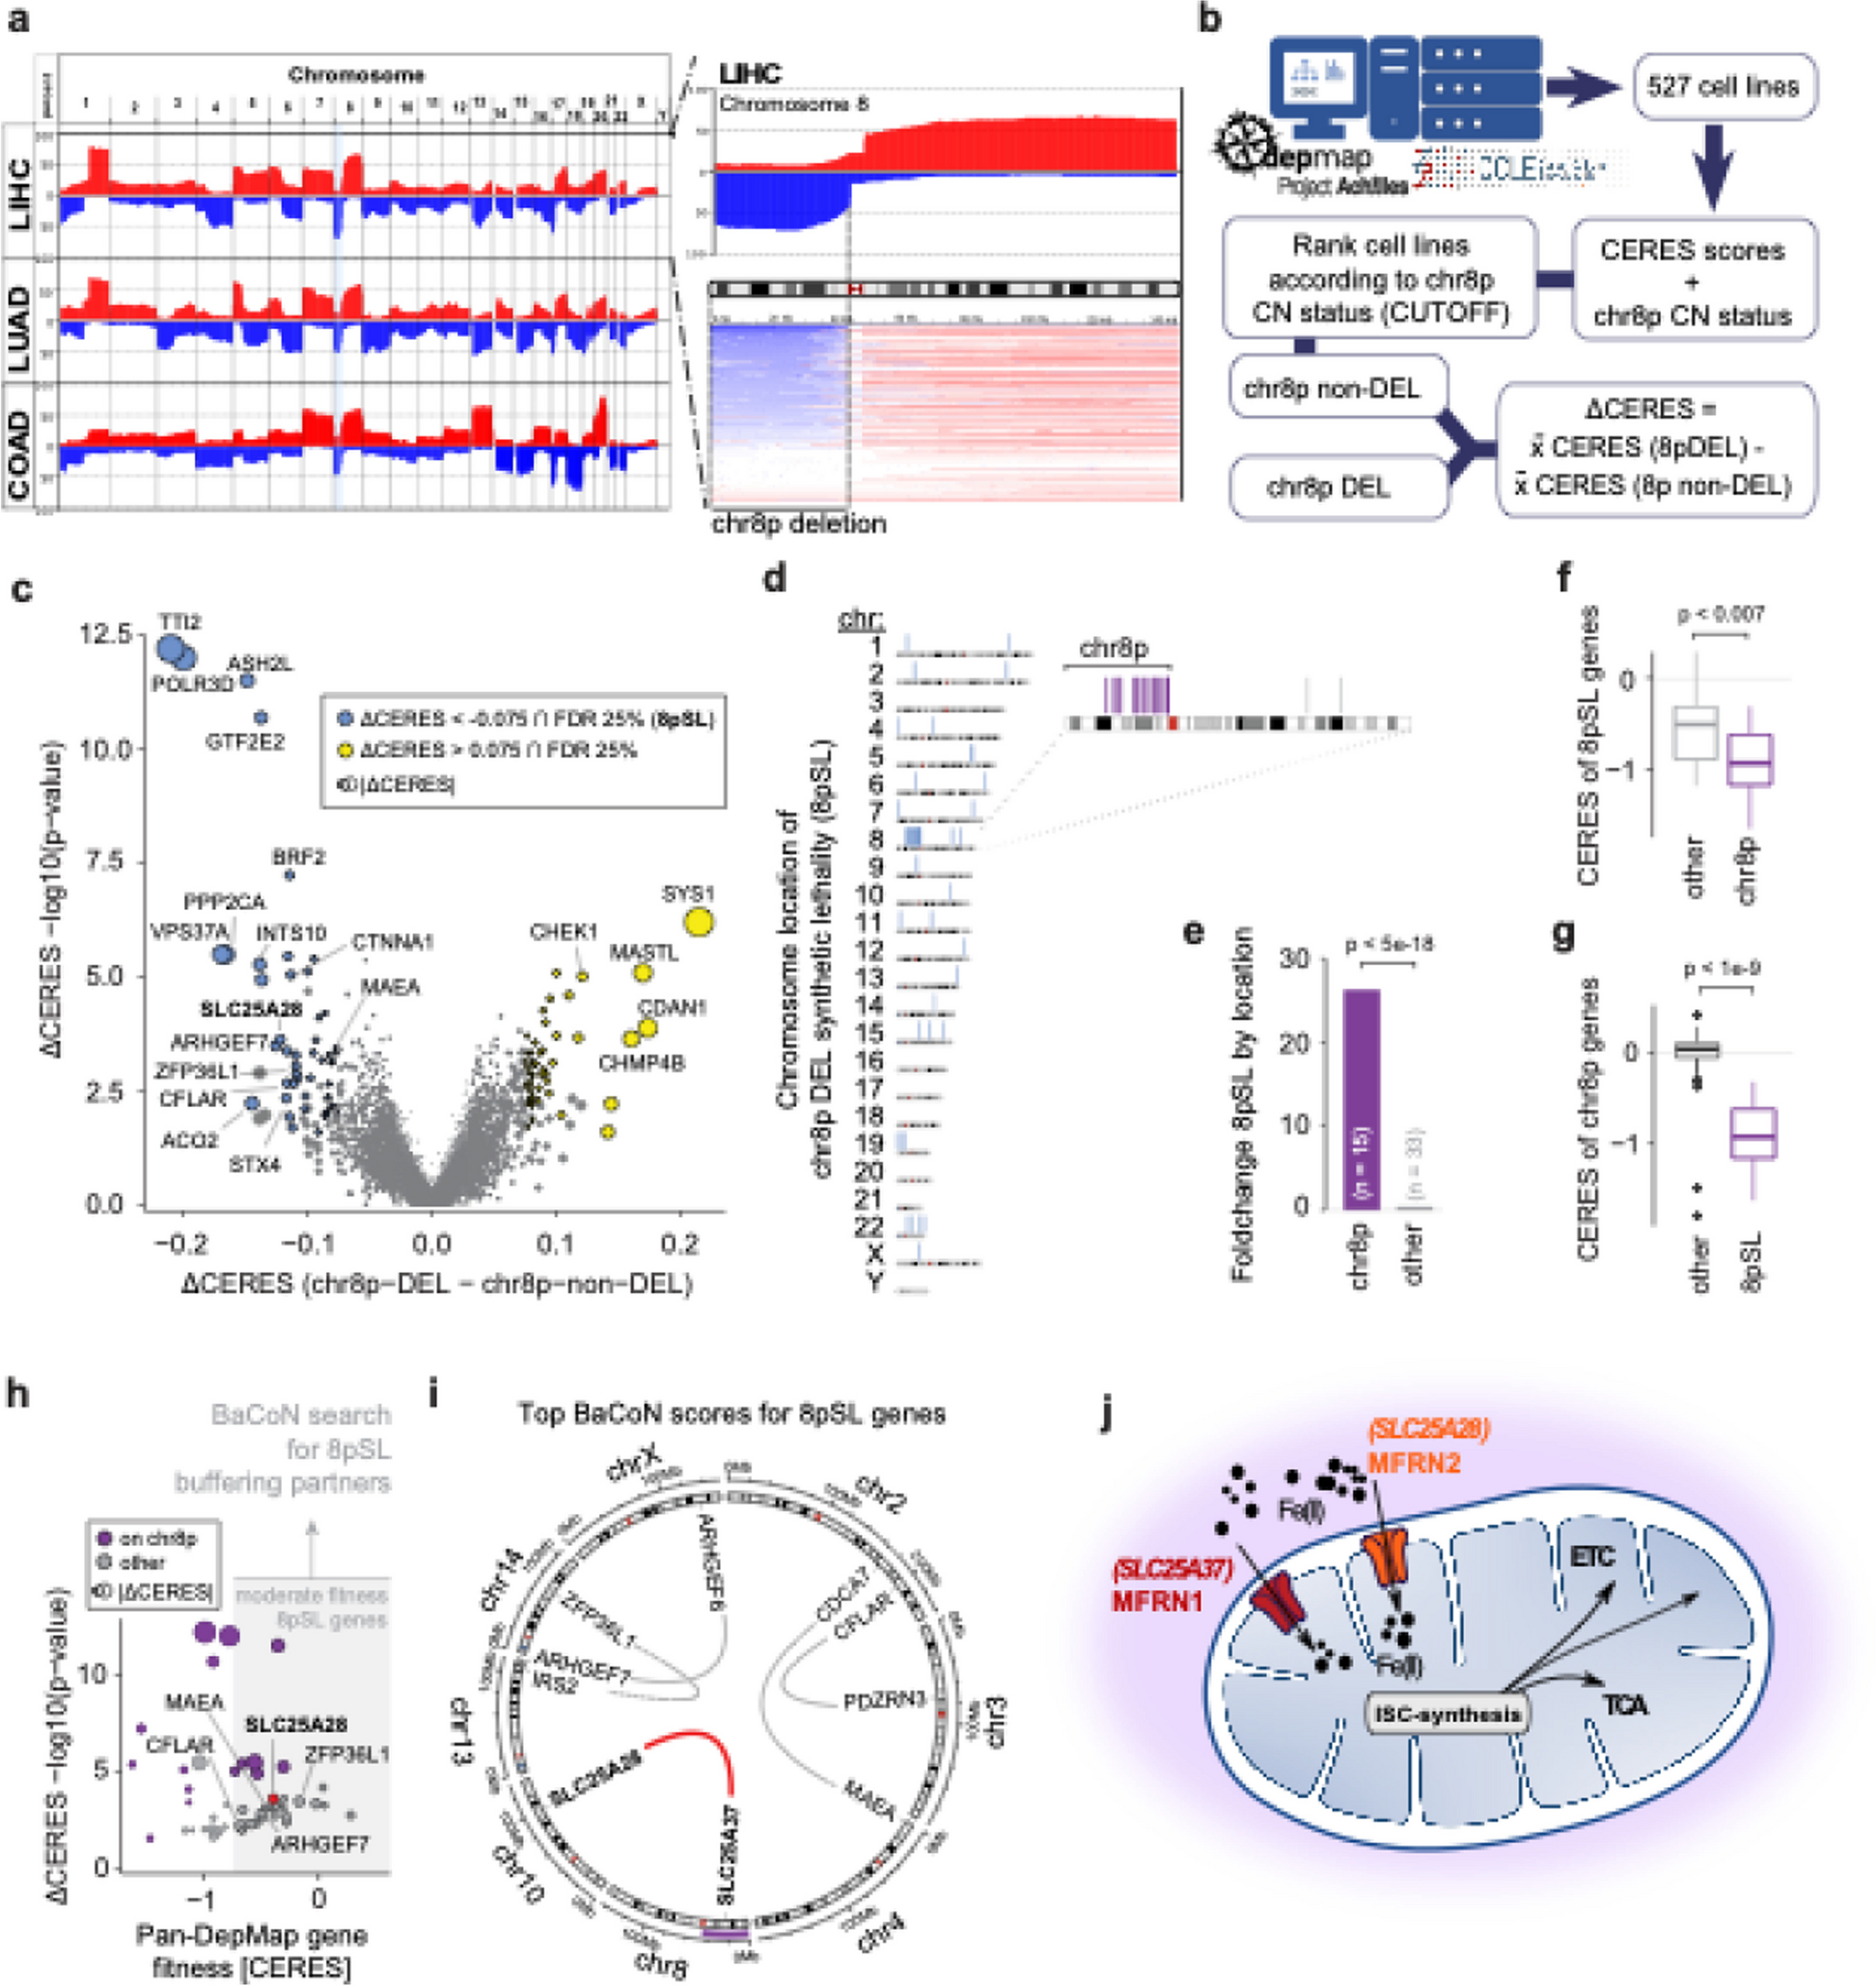
Genetic dependency data analysis and prediction of chr8p synthetic lethalityGenetic dependencies on p-arm of chromosome 8 (chr8p) copy number (CN) were defined as genes with a more severe fitness defect in cell lines that have low chr8p CN as compared with cell lines with high/normal chr8p CN. Those genetic dependencies were hypothesized to represent genes more essential in genes with low chr8p CN and therefore suggest synthetic lethal treatment opportunities for cancers with a loss-of-chr8p. To quantify the fitness defects, genome-wide CRISPR-Cas9 knockout screening data from the Cancer Dependency Map (DepMap) was utilized. Version 20Q2 data comprised fitness effects represented as CERES scores for about 18,119 protein-encoding genes across 769 distinct cell lines (Achilles_gene_effect.csv). Next, CCLE copy number data (CCLE_gene_cn, DepMap 19Q1) were surveyed for the copy number status of chromosome 8p and combined with the respective gene effect data. For a total number of 527 cell lines, chr8p CN was determined for the entire length of the chromosomal arm and adjusted for CN value and deletion size. A copy number value of − 2.5 was determined, below which the chromosomal arm was scored as deleted resulting in chr8p loss/deletion (DEL; n = 89) and chr8p high (nonDEL; n = 438) classified cell lines. To focus on those of the 18,119 genes that are most likely to be actionable, we downloaded the CCLE expression dataset, which covers 764 of the 769 cell lines screened in the 20Q2 DepMap release (CCLE_expression_v2.csv, https://depmap.org/portal/download/all/?releasename=DepMap+Public+20Q2&filename=CCLE_expression_v2.csv), and only considered genes for the subsequent analysis if their mRNA expression levels had a mean log2 (TPM + 1) larger 1 in the chr8p DEL or the chr8p nonDEL set of cell lines. For each gene, differential CERES (dCERES) scores were computed by subtracting the mean CERES score for that gene in chr8p nonDEL from the mean CERES score for that gene in chr8p DEL. A negative dCERES score therefore indicated that a gene was more essential in chr8p DEL cell lines. The dCERES score presented the differential fitness effect size. To estimate the confidence of the differential effect, p-values were computed for each gene using a Wilcoxon Rank Sum test between the DEL and nonDEL cell line CERES scores, using the wilcox.test R function. To reduce false positive hits, Independent Hypothesis Weighting (IHW) was used to adjust p-values, using mean CERES scores of chr8p nonDEL cell lines as covariates (also see Additional file 1: Fig. S1a–d). The ihw function from the IHW R package (version 1.26.0) was used to compute the adjusted p-values, using an FDR control level of 0.1 [33]. We selected a lenient set of significant effects at an adjusted p-value of 0.25 and then prioritized 48 genes with moderately high differential effects (dCERES < − 0.075) describing a higher essentiality in chr8p DEL cell lines. While we discovered strict effects such as SLC25A28 at an adjusted p-value of 0.1, we expanded the hit list for functional characterization of also moderate effects.
To systematically test if the predicted 48 gene dependencies of chr8p were linked to chr8p AND were potential treatment opportunities, we systematically predicted gene–gene buffering using our BaCoN pipeline. In brief, this was done under the assumption that if two genes buffer each other, gene 1 becomes more essential if the expression of gene 2 is downregulated. Therefore, we leveraged the gene fitness effect DepMap data (20Q2) and compared it to the Cancer Cell Line Encyclopedia (CCLE) mRNA expression data of all matched 20Q2 DepMap cell lines. To avoid spurious gene–gene relations, genes were only considered in a potential buffering pair if the potentially buffered gene had sufficient variation in their gene fitness effect (n = 3168) and the potentially buffering genes had sufficiently high gene expression (n = 3853). Potentially buffering genes had a gene expression standard deviation across all cell lines larger than 1, as well as an expression level > 3 in at least 100 cell lines. Potentially buffered genes had a minimal expression of mean log2 (TPM + 1) > 2 and either an absolute mean CERES > 0.3 or a CERES score standard deviation > 0.2 across all cell lines. For each gene, a Pearson’s correlation coefficient (PCC) of the expression and CERES scores was computed, using the cor function in R. The resulting matrix contains correlation coefficients between each the gene expression of the 3853 potentially buffering genes of the expression set and the CERES scores of each of the 3168 potentially buffering genes of the CERES set. In total, correlations for 12,206,304 gene pairs were computed. To increase the specificity of gene–gene relations, BaCoN weights the PCC of each pair based on the number of higher PCCs of the contributing genes with other genes, divided by the number total number of possible connections of this gene pair. This unsupervised correction of correlation coefficients accounts for biases in cancer cell line CRISPR screening data such as tissue of origin and associated sources of false positive predictions caused by co-expression patterns of buffering genes (Additional file 1: Fig. S1e). The resulting gene pairs were sorted by their weighted PCCs and filtered for pairs including one of the 48 previously defined chr8p genetic dependencies. As pan-DepMap essential genes are not of interest, gene pairs involving a gene with a mean CERES < − 0.75 across all cell lines were removed.
ImmunohistochemistryIHC was performed as previously described [17]. Briefly, deparaffinization was achieved by incubating slides in xylene, followed by rehydration using a descending alcohol series and a washing step using water. To enable antigen retrieval, slides were boiled in a pressure cooker for 10 min using a sodium citrate buffer (10 mM Trisodium citrate dihydrate, 0.5%(v/v) TWEEN® 20, pH 6.0), followed by 5 min cool down by washing slides under running water. To block endogenous HRP, the slides were subsequently incubated in 3% hydrogen peroxide for 10 min followed by 1 min washing under running water and twice with PBS for 2 min respectively. The tissue sections were blocked with 5% BSA in PBS with 0.05% Triton X-100 for 1 h at RT and incubated with the primary antibody diluted in blocking buffer overnight at 4 °C (chicken polyclonal anti-GFP, abcam, ab13970, 1:500). Then, slides were washed three times with PBS/Triton X-100 (0.05%) for 5 min and incubated with ImmPRESS® HRP Horse Anti-Rabbit IgG Polymer Detection Kit, Peroxidase (Vectorlabs) for 30 min at RT, followed by three washing steps with PBS/Triton X-100 (0.05%). To allow GFP signal detection, slides were stained with ImmPACT DAB Peroxidase (HRP) Substrate (Vectorlabs) according to the manufacturer’s instructions, and the staining reaction was observed until a sufficiently high staining intensity was achieved. For higher contrasting, a counterstaining was performed by incubating slides in hematoxylin for 1–2 min. After subsequent washing under tap water to sufficiently remove the counterstaining solution, the slides were dehydrated using an ascending alcohol series ending with Xylol and mounted using Surgipath Micromount Mounting Medium (Leica). Histological slides were scanned using the Hamamatsu NanoZoomer Digital Pathology (NDP) system and analyzed using QuPath (Quantitative Pathology & Bioimage Analysis).
Tissue microarray (TMA) analysisSamples of primary human tissue were analyzed using TMAs, comprising liver cancer-specific and non-cancerous tissue punches. The liver-specific TMA comprised a total number of 677 tissue punches from human biopsies distributed on 7 slides with 40 histological normal and 178 cirrhotic liver samples as well as 459 HCCs. The histological grading was performed by an experienced pathologist. The individual histochemical MFRN1 staining was quantified using a score ranging from 0 to 4 (MFRN1-Score), with 0 corresponding to no staining and 4 corresponding to very intense staining. The individual MFRN1-Score was assessed quantitively (number of stained cells) and qualitatively (staining intensity and localization). The TMA of healthy human tissue contained 89 tissue punches of 31 different tissue samples and was analyzed similarly. Institutional Ethical Review Board approval was obtained at local Ethical Committees of the Medical Universities of Heidelberg (S205-06), in compliance with the Helsinki Declaration. Written informed consent was obtained from all individuals.
Xenograft subcutaneous injection of immunodeficient miceSubcutaneous injection of human and murine tumor cell lines was performed in NSG or Foxn1 nu/nu mice (Janvier) depending on the cell line of origin. A number of 1 × 10⁶ experimentally manipulated cells resuspended in 100 µl PBS harboring DOX inducible shRNA constructs were injected subcutaneously under the right and left flank of isoflurane sedated mice. The tumor volume was assessed by measuring xenograft length (L) and width (W) with skinfold caliper and approximating the three-dimensional volume as (V) = L*(W2)/2. After reaching a tumor volume of 100 mm3, the mice were given DOX-containing food (Envigo Teklad), and tumor size was periodically measured. Once xenografted tumors reached a diameter of 1.5 cm or ulcerations were observed, animals were euthanized by cervical dislocation. The tumors were resected and photographed using a stereomicroscope (Leica, MZ10F, MC170), tissue samples were flash frozen, and the remaining sample was fixed in 4% paraformaldehyde to be processed for IHC. All animal experiments were conducted in compliance with the regional regulations and with the approval of the regional board in Karlsruhe, Germany (G-81/20).
StatisticsIf not indicated otherwise, statistical analyses were performed using GraphPad Prism 8. If not indicated differently, graphs depict the mean value and standard deviation (SD) of three independent replicates. The significance levels are depicted as p < 0.0001 = **** (extremely significant); p < 0.001 = *** (extremely significant); p < 0.01 = ** (very significant); p < 0.05 = * (significant); p ≥ 0.05 = ns (non-significant).
留言 (0)