
記住我
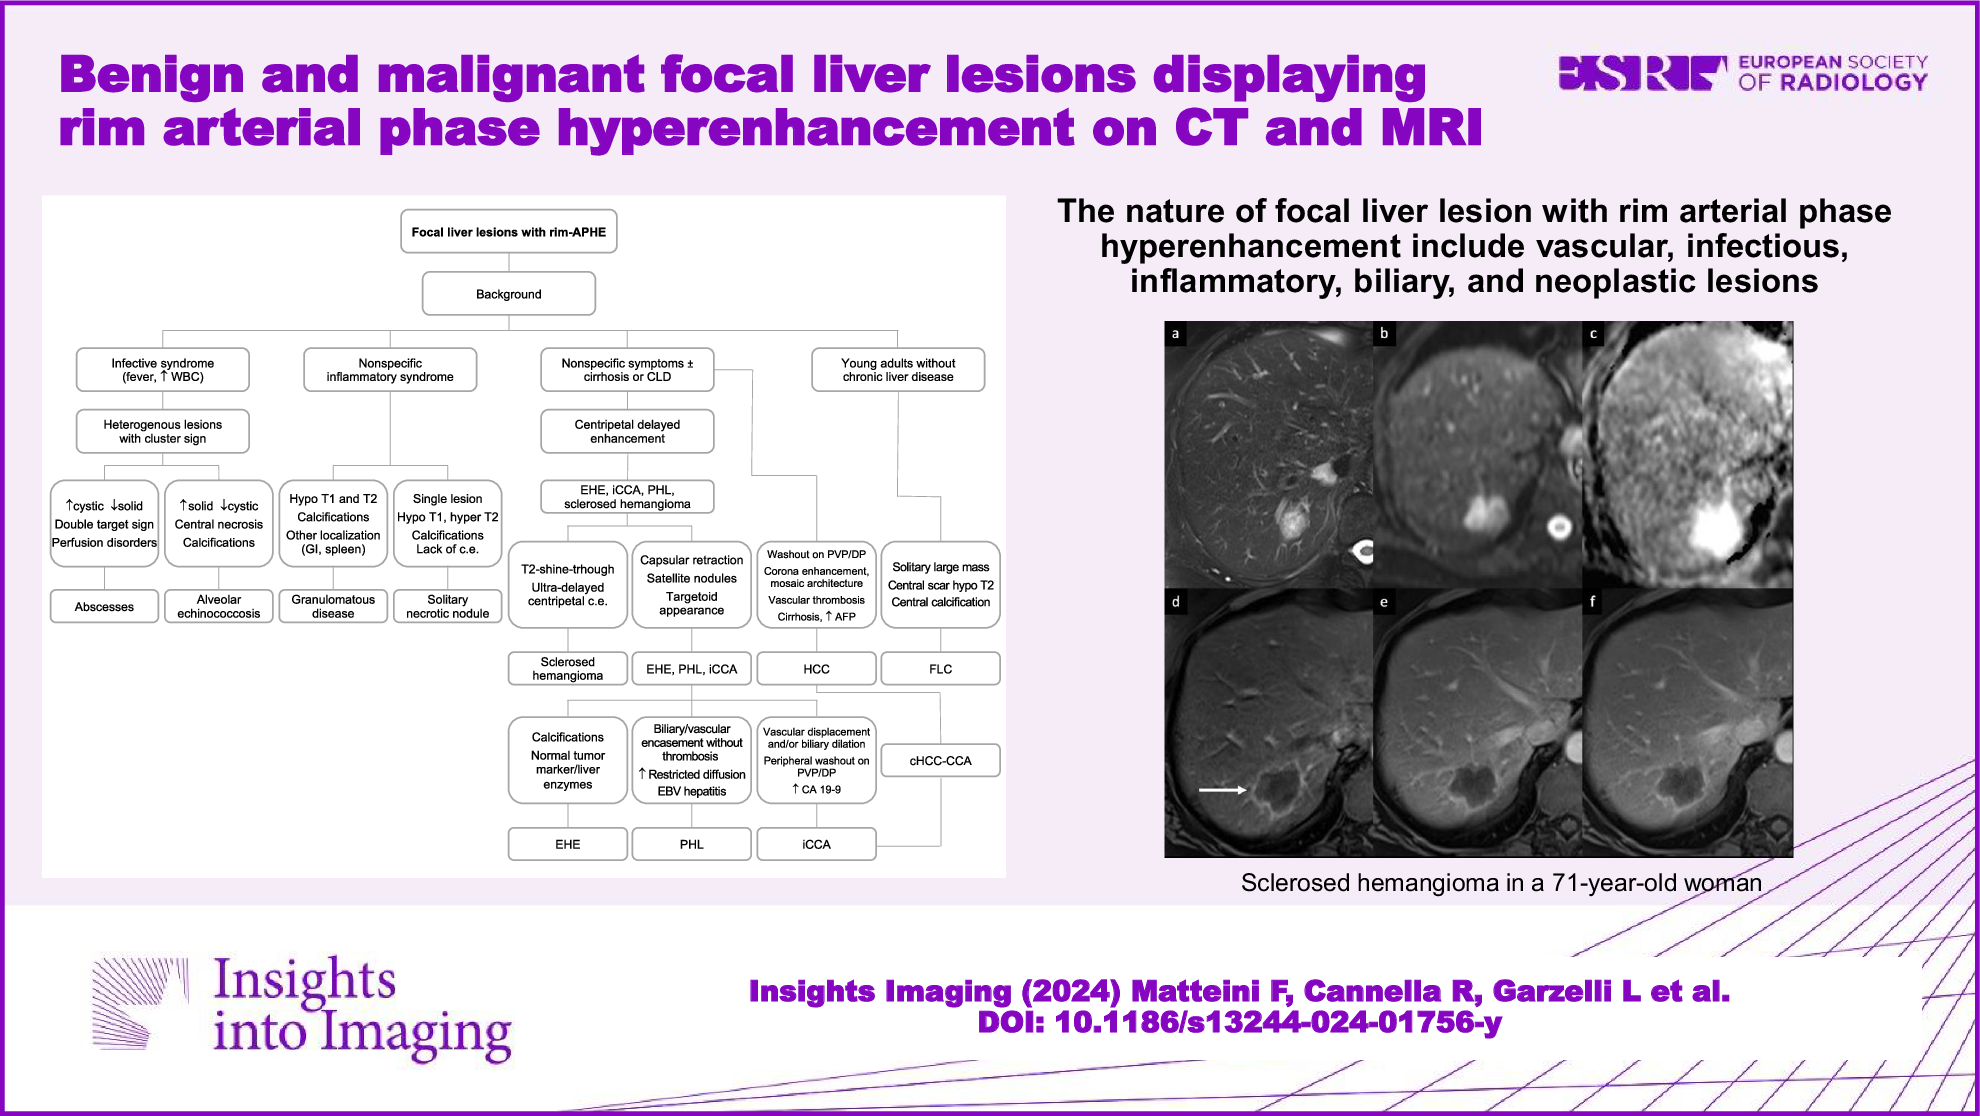
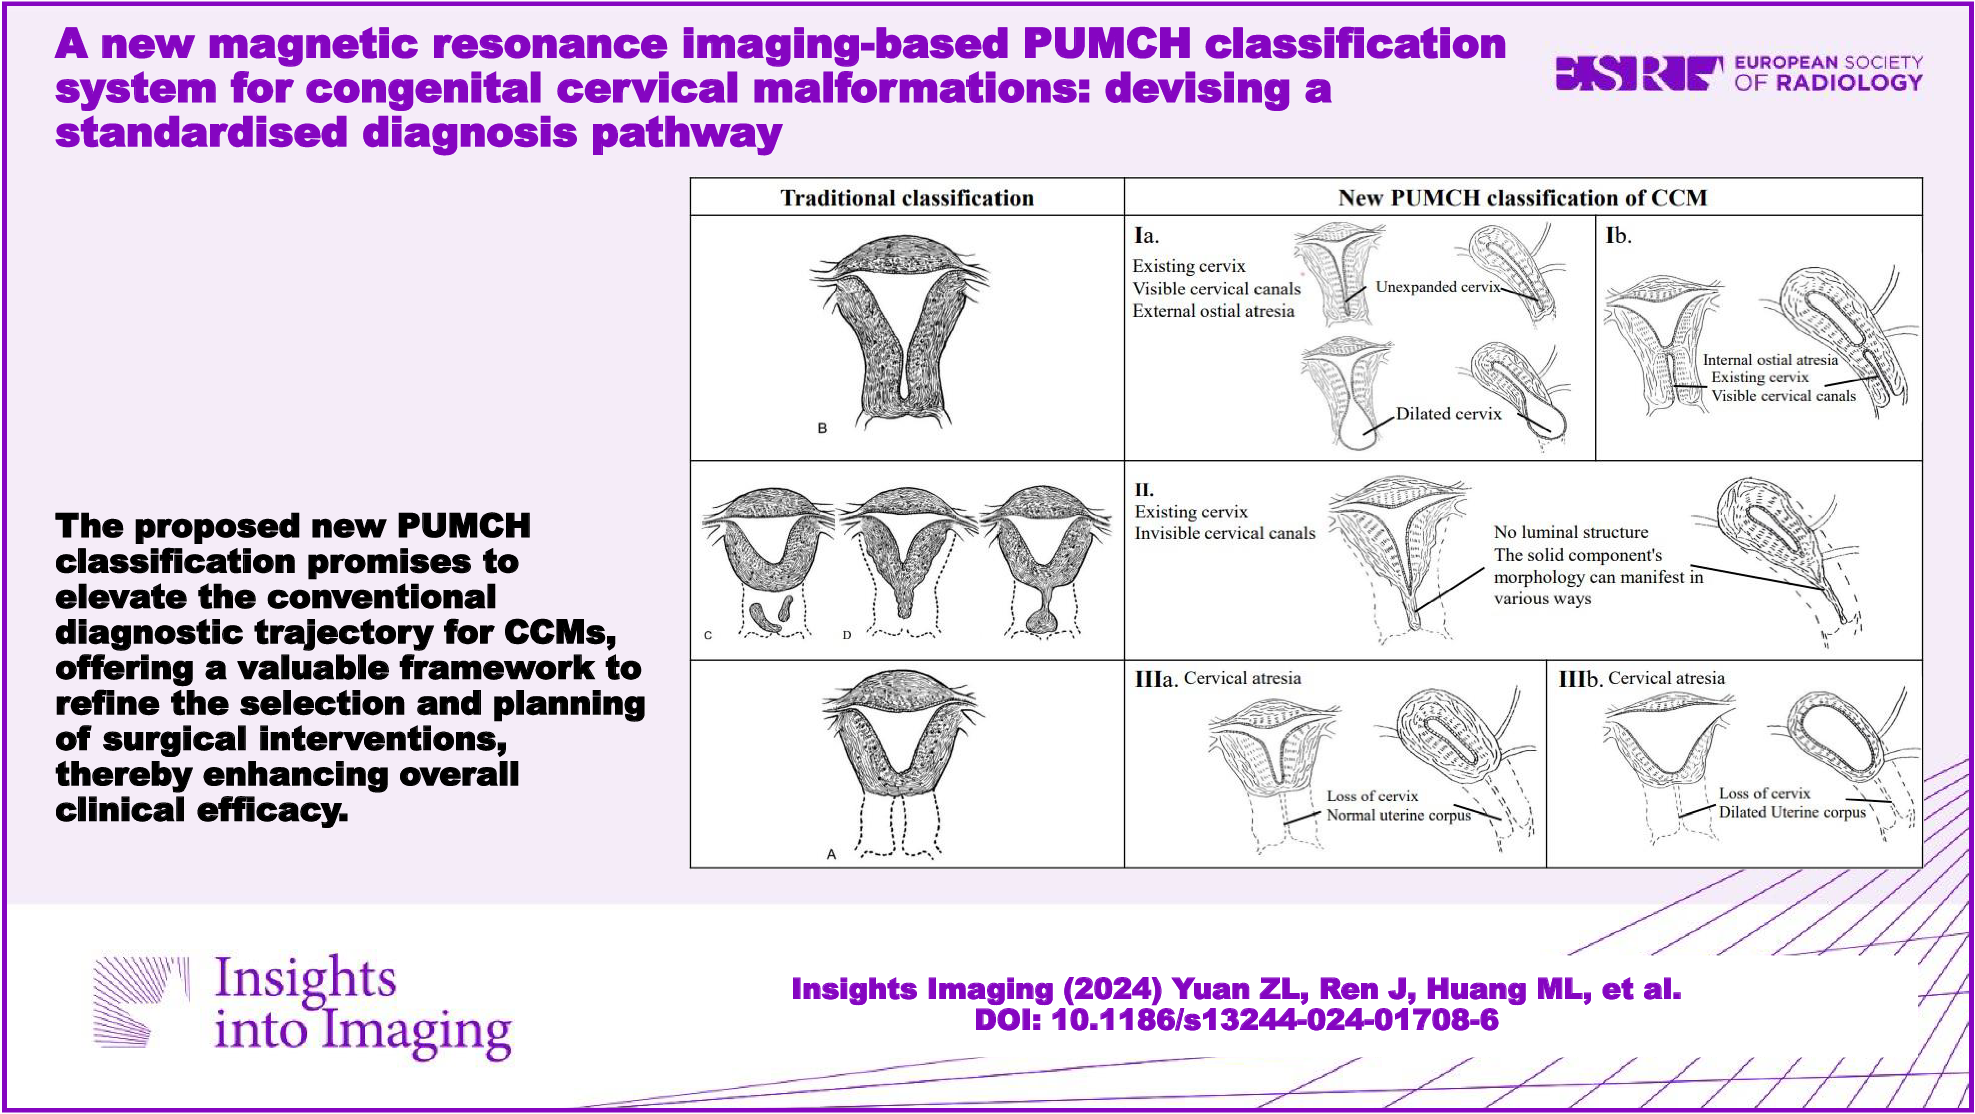
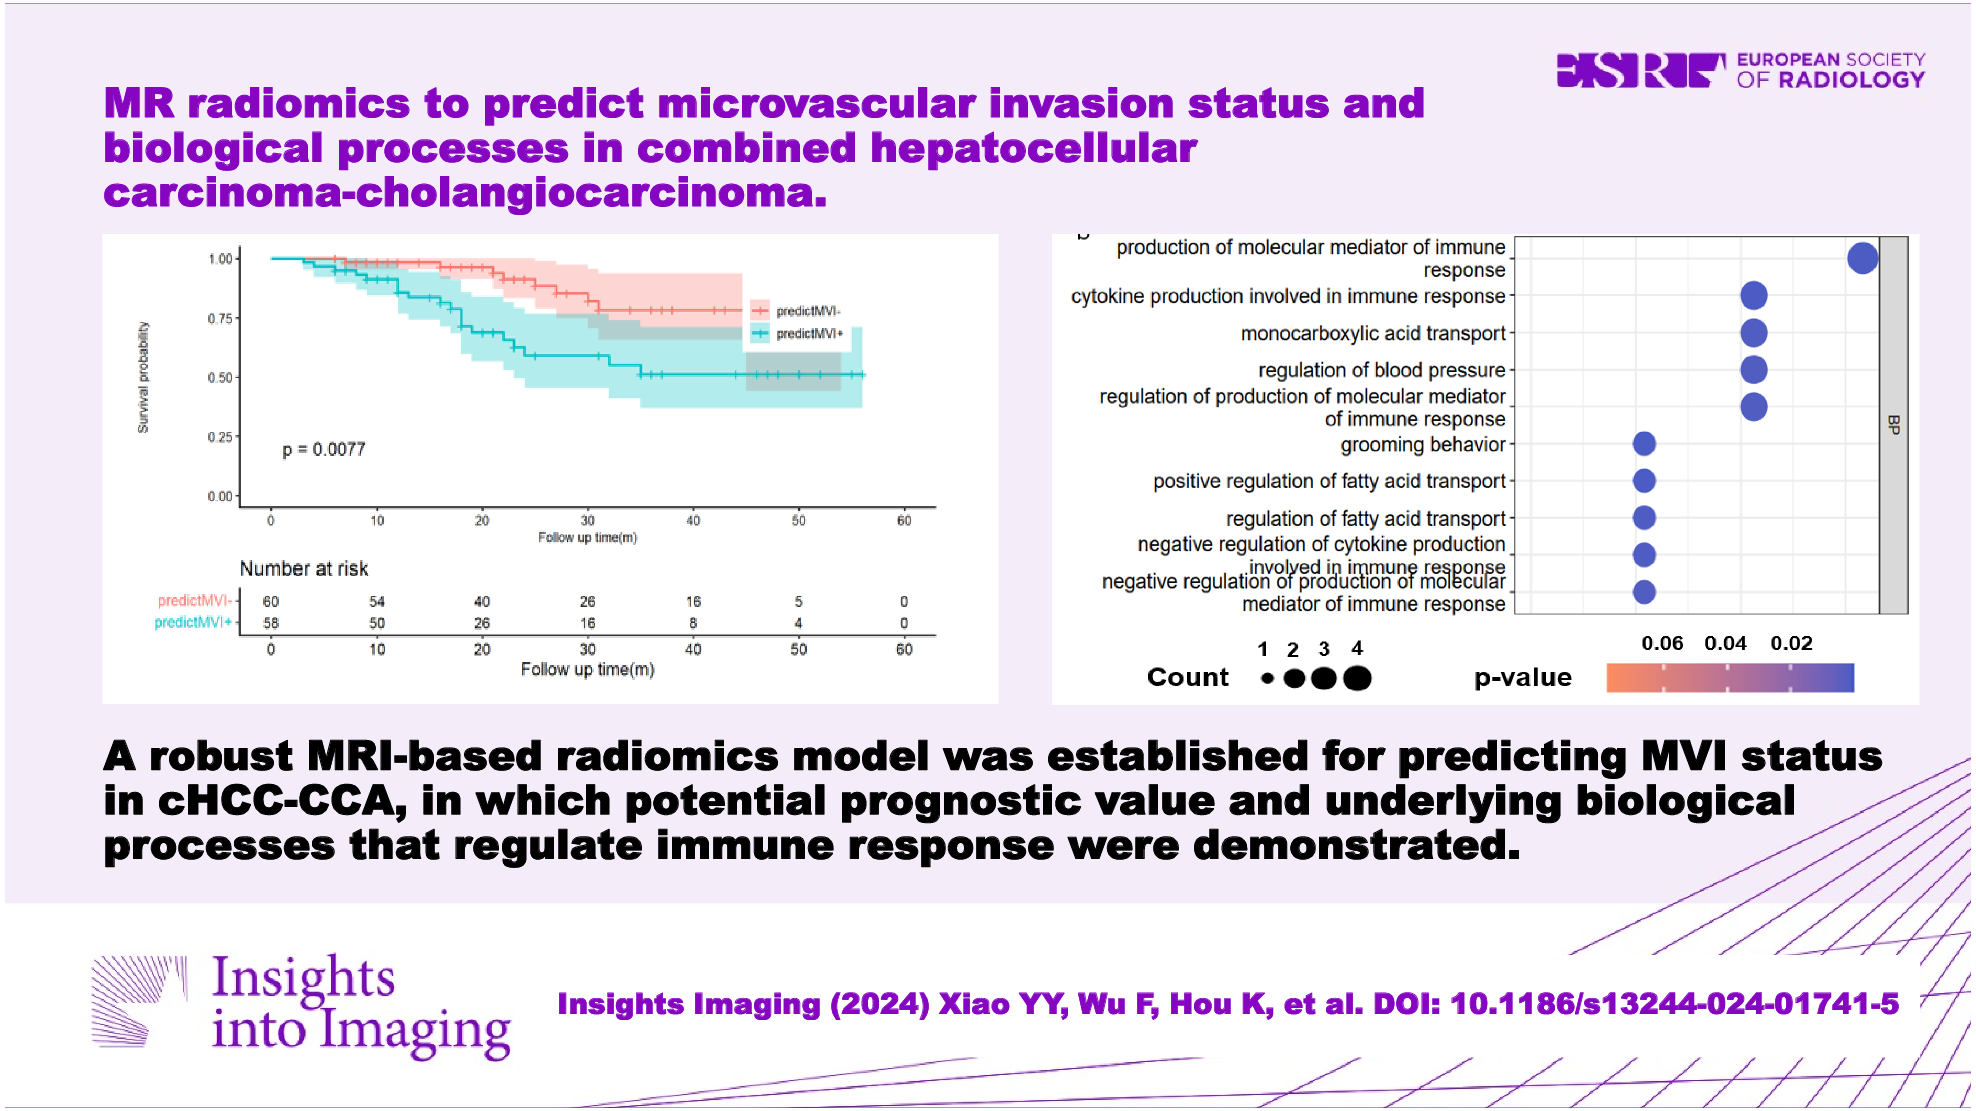
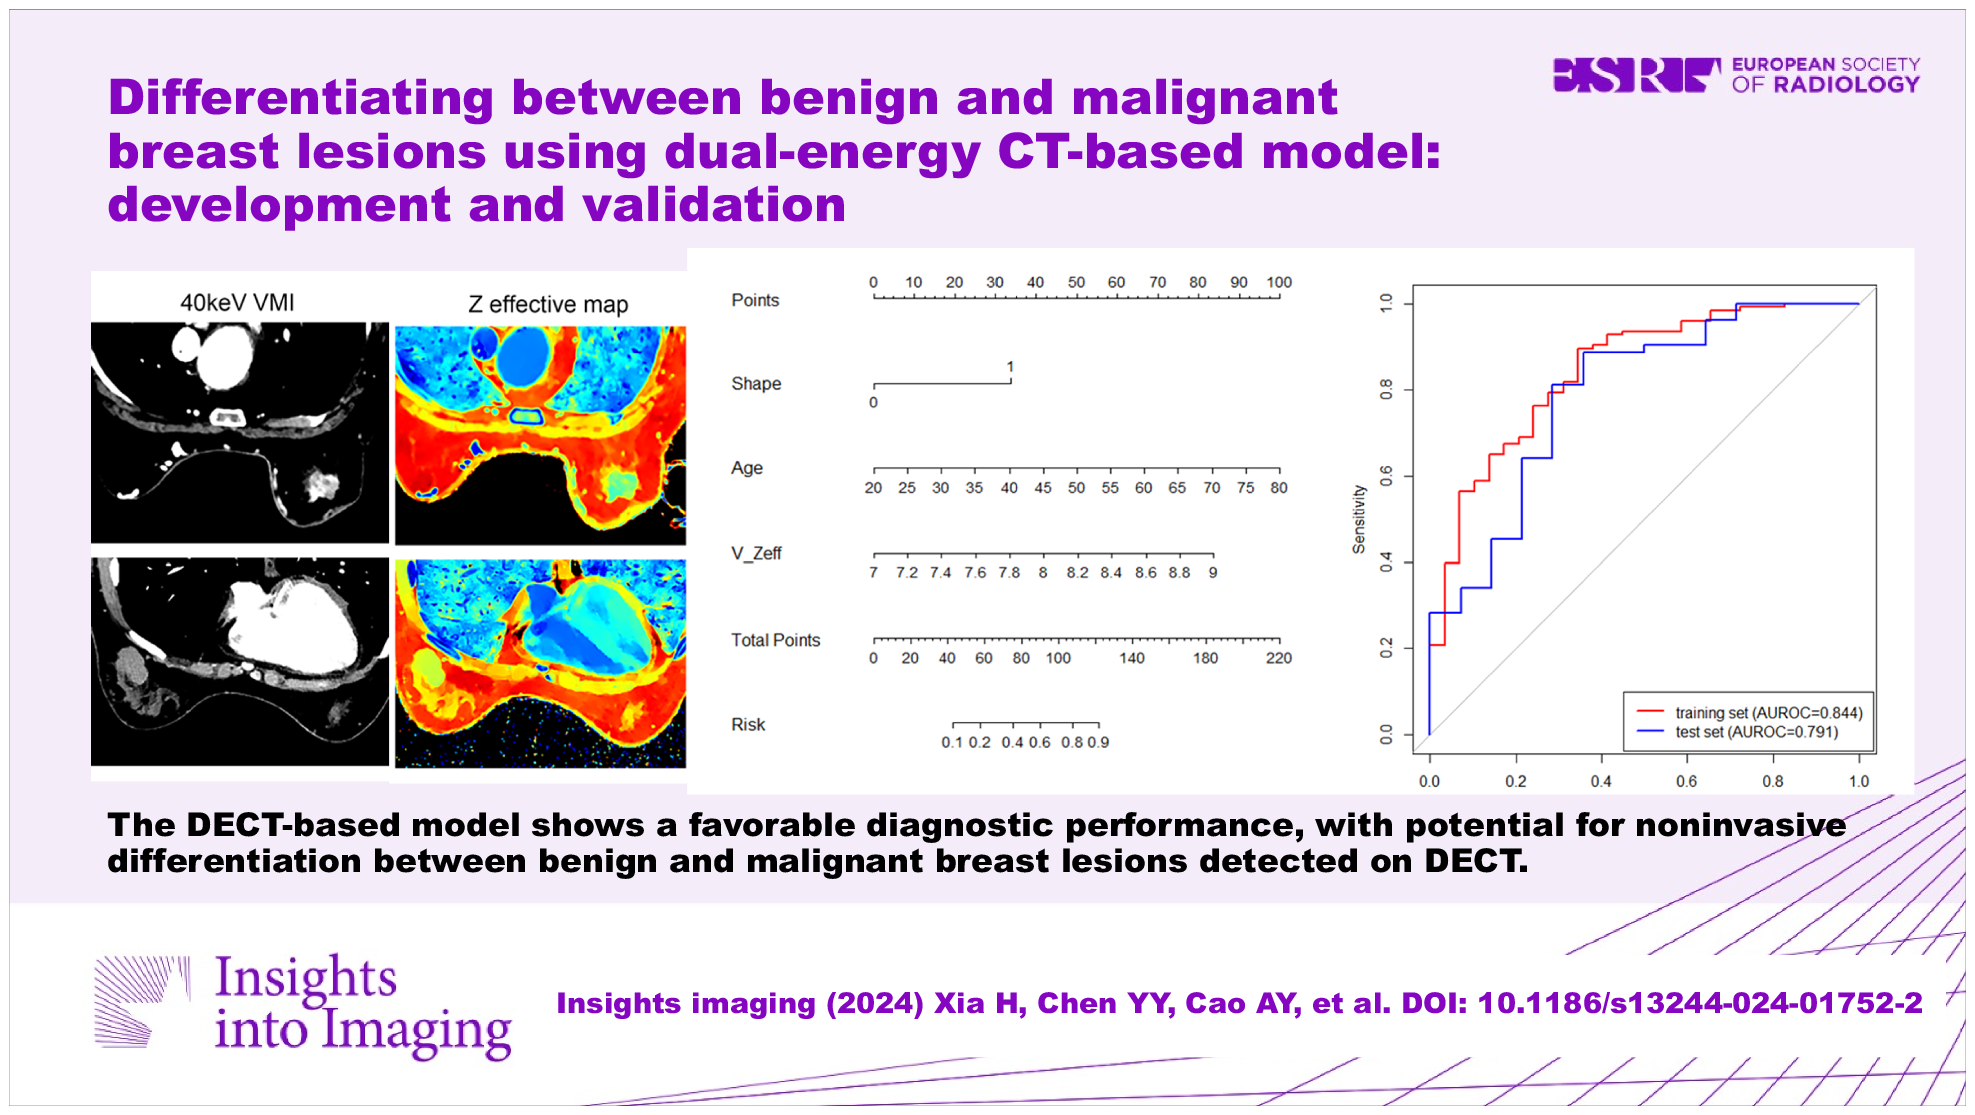


Table 2 displays the demographics and subjective CT findings across all cohorts. Patients were categorized into two groups based on follow-up results: PM and NM. Significant differences were observed in tumor infiltration into the surrounding fat and the level of CA19-9 between the two groups across all three cohorts. Primary tumor location, SUVmax, and levels of CEA exhibited differences in the training and external validation cohorts. Patient age reached statistical significance only in the internal validation cohort (p < 0.05).
Table 2 Demographic and subjective CT characteristics in the three cohortsPredictive performance of the pilot modelTable 3 provides a summary of quantitative comparisons, including sensitivity, specificity, accuracy, positive predictive value (PPV), negative predictive value (NPV), AUC, and average AUC of 50 runs, comparing the pilot models and radiomics-boosted models in both the training and internal validation cohorts. In all pilot models, using expanded ROI patches as the input variable achieved higher average AUC values in the validation cohort (p < 0.001). Comparing ResNet34 and ResNet50 models, the latter achieved average AUC gains with any CT patches and used PET expand ROI patches as input variables, yielding similar results (p < 0.001) (Fig. S1 A, B, D, and E). Ultimately, two optimal models were selected from the pilot models: ResNet50 with CT and PET expand ROI patches as input variables, exhibiting higher AUC and lower standard deviation (SD), indicating a high level of robustness (0.739 ± 0.027 and 0.798 ± 0.007, respectively). The AUC, accuracy, sensitivity, specificity, PPV, and NPV of the CT model that is closest to the average AUC value in the internal validation cohort are 0.749, 0.659, 0.600, 0.692, 0.529, and 0.750, respectively, while in the PET model, they are 0.797, 0.732, 0.933, 0.615, 0.583, and 0.941, respectively.
Table 3 Performance of pilot models with different input variables and different neural networksRFM selection and radiomics-boosted deep-learning model constructionFigure 4A, C illustrates the average correlation heatmap of RFM generated by expanded ROI patches from CT and PET images. After excluding highly correlated features, the RFMs of CT and PET include 37 and 27 features. The average correlation values between RFMs and the SM from the two pilot models are depicted in Fig. 4B, D, highlighting the highest-performing features with green boxes. For the RFMs of CT patches, GLDM-based small dependence emphasis (SDE) (0.145) and GLDM-based small dependence high gray level emphasis (SDHGLE) (0.146) achieved the highest average correlation. Similarly, for the RFMs of PET patches, GLCM-based difference entropy (DE) (0.288) and GLDM-based large dependence low gray level emphasis (LDLGLE) (0.258) were selected. The overall average correlation value of RFMs generated from CT is lower than PET.
Fig. 4
RFM selection. Average correlation heatmap of RFM generated by expanded ROI patches from CT (A) and PET (C) images. Panels B, D depict the average correlation values between RFM and SM of CT and PET pilot models after removing redundant features, highlighting the highest-performing features with green boxes. RFM, radiomics feature map; SM, saliency map
Compared to the ResNet50 using only CT expand ROI patches as input, the model’s performance significantly improved after adding RFMs (AUC from 0.739 ± 0.027 to 0.866 ± 0.018, p < 0.001) (Fig. S1 C). The AUC, accuracy, sensitivity, specificity, PPV, and NPV in the internal validation cohort are 0.869, 0.780, 0.800, 0.769, 0.667, and 0.870. Unexpectedly, the performance of the radiomics-boosted model decreased in PET (AUC from 0.798 ± 0.007 to 0.796 ± 0.008, p = 0.006) (Fig. S1 F and Table 3).
After a comprehensive comparison of various models, two best models based on PET/CT images were identified: (1) ResNet50 with CT ROI expand patches + RFMs as input. (2) ResNet50 with only PET ROI expand patches as input. The radiomics-boosted deep-learning model score was obtained by multivariable logistic regression on the output probabilities of the two models. This model not only exhibits the best predictive performance in the training and internal validation cohorts but also has high generalization ability in the external validation cohort. The AUC, accuracy, sensitivity, specificity, PPV, and NPV in the internal validation cohort are 0.897 (95% confidence interval (CI): 0.801–0.994), 0.829, 0.800, 0.846, 0.750, and 0.880, respectively, 0.885 (95% CI: 0.795–0.975), 0.821, 0.700, 0.889, 0.778, and 0.842 in the external validation cohort. In all validation datasets, these values were 0.889 (95% CI: 0.823–0.954), 0.825, 0.743, 0.871, 0765, and 0.857 (Table 4). All datasets showed differences between the NM and PM groups (Fig. 5A). According to the Hosmer-Lemeshow test, the ideal curve and the predictive calibration curve are similar in both training, internal, external, and all validation datasets (p = 0.225, 0.224, 0.447, 0.696, respectively) (Fig. 5B, C).
Table 4 Comparison of the prediction performance of four models for synchronous CRPM riskFig. 5
Performance evaluation of prediction models. Distribution of the radiomics-boosted deep-learning model score in all datasets (A). Calibration curves of the radiomics-boosted deep-learning model in training (B) and validation cohorts (C). Panels D–G show AUCs of different models in all training, internal, external, and all validation datasets. AUC, area under the curves
Model comparisonRadiomics-boosted deep-learning compared with classical radiomics modelThe AUCs of the radiomics model in all cohorts are illustrated in Fig. S2 A–F. The PET/CT classical radiomics model score, calculated by multivariable logistic regression, yielded AUCs of 0.813 (95% CI: 0.736–0.890), 0.680 (95% CI: 0.504–0.855), 0.642 (95% CI: 0.473–0.810), and 0.659 (95% CI: 0.537–0.779) in the training, internal, external, and all validation datasets, respectively. The IDI and DeLong test demonstrated that the radiomics-boosted deep-learning model improved performance compared to the classical radiomics model (IDI = 0.302, p < 0.001; DeLong test, p < 0.001) (Fig. 5D–G).
Radiomics-boosted deep-learning compared with clinical and subjective CT finding modelThree clinical information and one subjective CT feature were screened using univariate and multivariate logistic regression to construct a clinical and subjective CT finding model (Table 5). The AUCs in the training, internal, external, and all validation datasets were 0.797 (95% CI: 0.717–0.877), 0.727 (95% CI: 0.567–0.887), 0.786 (95% CI: 0.657–0.915), and 0.758 (95% CI: 0.658–0.858), respectively. The performance was still lower than the radiomics-boosted deep-learning model (IDI = 0.206, p = 0.005; DeLong test, p = 0.024) (Fig. 5D–G).
Table 5 Univariate and multivariate logistic regression analysis for clinical information and subjective CT findings in the training cohortSUVmax assessmentThe SUVmax showed limited performance, with AUCs of 0.650 (95% CI: 0.544–0.757) in the training cohort and 0.680 (95% CI: 0.506–0.853), 0.672 (95% CI: 0.518–0.826), and 0.686 (95% CI: 0.575–0.798) in the internal, external, and all validation datasets, respectively (Fig. 5D–G). Detailed data about AUC, accuracy, sensitivity, specificity, PPV, and NPV of all models are presented in Table 4.
留言 (0)