
記住我


Global climate change and anthropogenic disturbances have led to an increased incidence of coral diseases and bleaching during the last 3 decades, particularly in corals inhabiting tropical regions in the Caribbean and Indo-Pacific Ocean (Beeden et al., 2008; Aeby et al., 2011; Weil et al., 2012; 2016; Hughes et al., 2018; Johnson et al., 2022). In the last decade, heat-susceptible genotypes may have declined and/or adapted to such conditions; therefore, the remaining coral populations could have a higher thermal threshold for bleaching (Sully et al., 2019). Despite the increasing risk of climate change affecting coral health, studies have revealed that corals can improve their resilience through certain innate physiological mechanisms that involve chaperones and antioxidative enzymes, particularly heat shock proteins (Hsp70, Hsp60, and Hsp32) (Arya et al., 2007; Lanneau et al., 2008; Jin et al., 2016; Seveso et al., 2018; 2020; Montalbetti et al., 2021; Thummasan et al., 2021).
Massive Porites spp. are reef-building corals commonly found in reefs of the Indo-Pacific region, including the Ryukyu Islands in southern Japan (Veron, 1992; Nishihira, 2004). The health compromised coral tissues in massive corals such as Porites spp. often display non-normal pigmentation and develop some discoloration, such as pink, purple, and blue, that potentially represent an inflammation-like response (Palmer et al., 2009a). Among these, the pink pigmentation response (PPR) in massive Porites spp. colonies, a generalized inflammatory response characterized by the formation of pink lesions of different shapes and sizes, has been reported to increase in the Ryukyu Islands (Kubomura et al., 2021), with chronic seasonal variations (Yucharoen, 2016). In general, PPRs in corals develop swollen areas with pink discoloration, described as “pink lines” (Ravindran and Raghukumar 2002; 2006; Kenkel, 2008; Mohamed et al., 2012; Kritsanapuntu and Angkhananukroh, 2014; Séré et al., 2015), “pink spots” (Willis et al., 2004; Benzoni et al., 2010; Thinesh et al., 2011; Putchim et al., 2012; Kumar et al., 2014), and “pink pigmentation” (Raymundo et al., 2005; Palmer et al., 2009a).
Discoloration in PPRs is a phenomenon frequently observed in Porites spp. corals, but there are some reports regarding similar pigmentation phenomenon in other genera, such as Acropora (Bongiorni and Rinkevich, 2005; D’Angelo et al., 2012) and Montipora (D’Angelo et al., 2012; Aeby 1992; 2003 found that corals manifesting pink spots were infected by the trematode Podocotyloides stenometra. However later in the literature; Benzoni et al., 2010; Yucharoen 2016, found that the pink spots and other pink swollen lesions observed in massive corals, may not always be the result of tissue inflammation caused by the trematodes, but also injuries caused by other organisms penetrating the coral tissues, bites of fishes and the response to environmental stressors like high sea-surface temperature, strong illumination, low salinity, and desiccation. Therefore, the PPR is linked with an immune response of corals to those stresses mainly promoting the formation of reactive oxygen species (ROS) and the coral innate immune response through the production of antioxidant enzymes and FP (fluorescent proteins) (Palmer et al., 2009a; Palmer et al., 2009b; Bridges et al., 2020). Palmer et al. (2009)a and Palmer et al. (2009)b reported the presence of a red fluorescent protein (RFP) that plays an important role in photoprotection and the reduction of ROS. Bridges et al. (2020) reported that RFP expression in pink-pigmented lesions of Porites lobata is an innate immune response. Moreover, green fluorescent proteins (GFPs) in scleractinian corals play an important role in the removal of ROS (Bou-Abdallah et al., 2006).
To date, several FPs and chromoproteins (CPs) have been reported in anthozoans with possible roles in photoprotection (Matz et al., 1999; Miyawaki, 2002; Verkhusha and Lukyanov 2004; Bollati et al., 2022). The CPs present in anthozoans are highly homologous to FPs, such as GFPs. FPs and FP-like CPs are classified into four groups: cyan, green, and red that are fluorescent, and nonfluorescent CPs (Labas et al., 2002). Apart from the normal green-brown color of anthozoans from their symbiotic algae, CPs are also responsible for the nonfluorescent coloration (Lukyanov et al., 2000; Wiedenmann et al., 2000). Since the discovery of GFPs in the crystal jelly, Aequorea victoria, CPs and FPs have been extensively studied. Alieva et al. (2008) revealed for the first time that several CPs are present in some scleractinian coral genomes. Similarly, Shinzato et al. (2012) reported the presence of fluorescent and nonfluorescent CPs in a whole-genome analysis of Acropora corals. In recent years, it has become clear that diverse FPs are present with complex expression in corals of the genus Acropora (Kashimoto et al., 2021; Satoh et al., 2021). However, it is not clear what condition will promote the expression of these proteins in Porites spp. corals. Therefore, this study aimed to identify and characterize the CPs expressed in the discolored tissues of massive Porites spp. colonies manifesting PPRs, by extracting and purifying their proteins and further identifying the genes involved in their expression. In addition, microscopic observations of coral tissues under normal and ultraviolet light were conducted to clarify differences in the localization of CPs and RFP.
2 Materials and methods2.1 Coral samplingColonies of massive Porites spp. were sampled from a coral reef at Sesoko Beach in Sesoko Island, Okinawa, Japan (26°39ʹN 127°51ʹE), at low tide (depth 0.5–1 m) on 18 September 2018 (sampling permit No. 30–55, granted by the Okinawa Prefectural Government) (Figure 1). For protein analysis, a hammer and chisel were used to collect coral pieces from three colonies of Porites spp., two displaying PPRs as pink spots (Ps) and pink patches (Pp), and one healthy colony (H) (Figure 2). For microscopic observation, the coral pieces displaying Pp and the healthy-appearing colony were used. Sampled fragments of each colony (10–20 cm2) were kept in sterilized tagged bags with surrounding seawater and transported to the laboratory at the Tropical Biosphere Research Centre (University of The Ryukyus, Okinawa, Japan) at Sesoko Island. Samples were maintained in an aquarium for 24 h with natural running seawater, temperature fluctuating between 26.5°C and 27.5°C, and attenuated natural illumination with a maximum of 200 μmol photons cm−2 s−1 to avoid the formation of ROS until treatment.
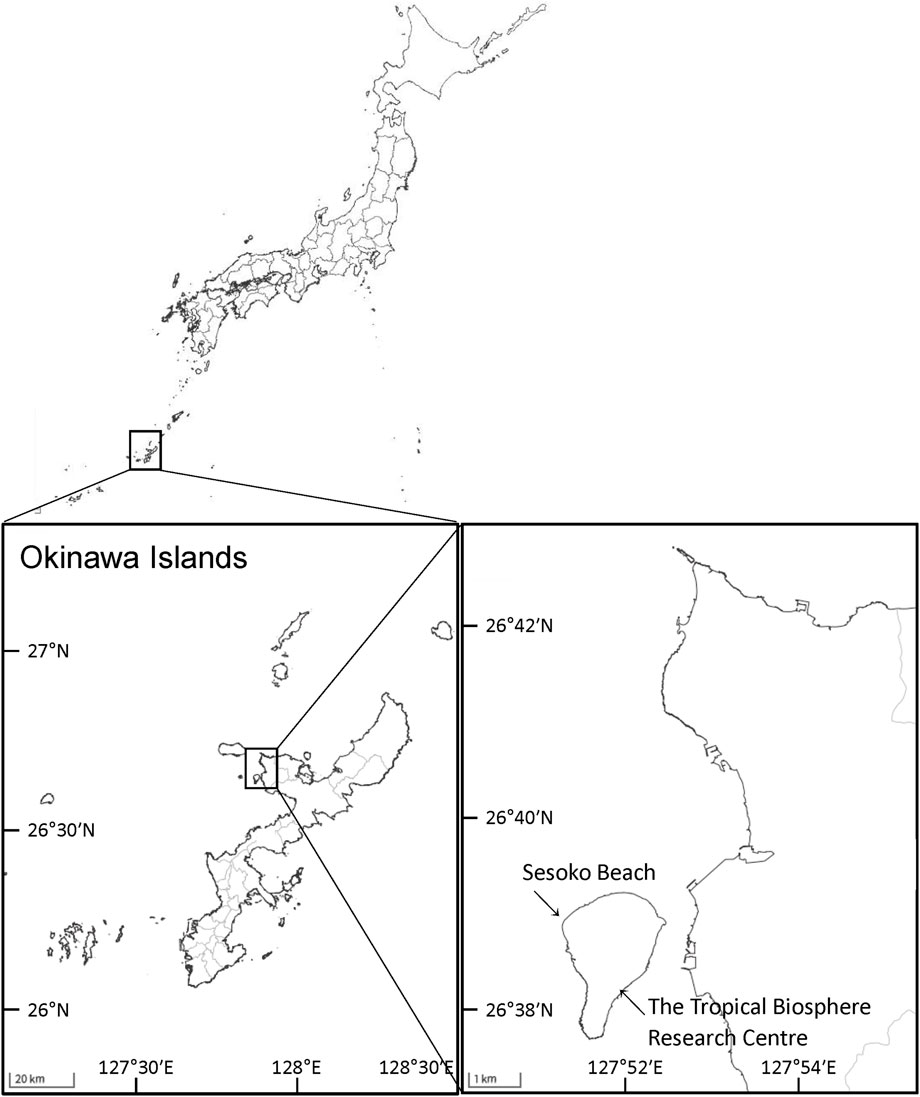
Figure 1. Study area and sampling sites in Okinawa, Japan. Maps were obtained from The Geospatial Information Authority of Japan (https://www.gsi.go.jp/).
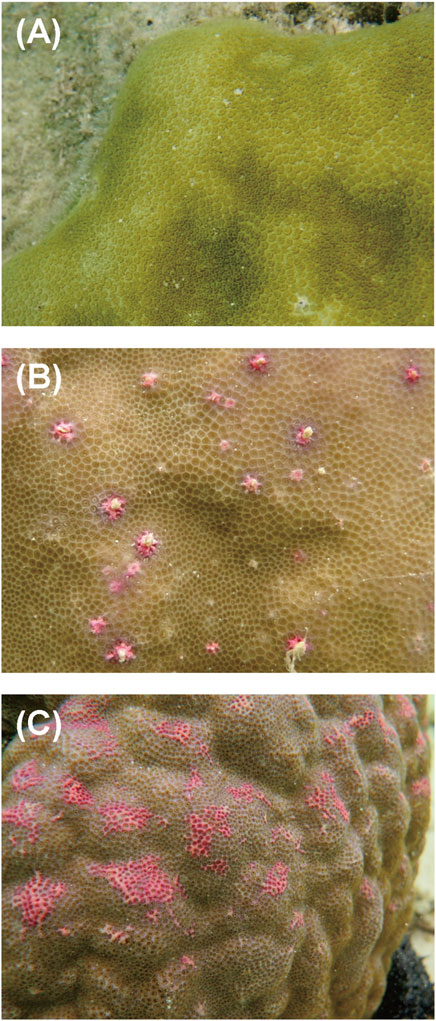
Figure 2. Aspects of different types of PPRs in massive Porites colonies: (A) healthy-appearing colony, (B) colony exhibiting pink spots, and (C) colony exhibiting pink patches.
2.2 Extraction and concentration of chromoproteinsTissue solutions were obtained from the pink-pigmented area of the colonies displaying Ps and Pp, as well as from H as a control. Coral tissues of 0.8–1.6 cm2 (Ps), 3–5 cm2 (Pp), and 4 cm2 of H were removed from the skeleton with a Waterpik dental flosser (DENTREX; Ricoh Elemex, Aichi, Japan) (Johannes and Wiebe, 1970) using 3.5% NaCl solution and 10 mM sodium phosphate buffer (pH 7.5). Crude tissue solutions were homogenized using a glass homogenizer and filtered through Whatman glass microfiber filters (Grade GF/F, pore size 0.7 µm; GE Healthcare Life Sciences, Buckinghamshire, United Kingdom) to remove the endosymbiotic algae Symbiodiniaceae cells and coral tissue debris. The soluble fractions were centrifuged at 3,000 × g using Amicon Ultra centrifugal filters (Merck KGaA, Darmstadt, Germany) to concentrate molecules with masses greater than 10,000 Da to retain proteins. Concentrated extracts were transferred to microtubes using Pasteur pipettes. The Amicon meshes were then washed three times with 200 µL of 10 mM sodium phosphate buffer (pH 7.5) for complete recovery of the samples. The final volume of the extract was approximately 1.5 mL. Approximately 50 μL of the protein extracts were used for separation through electrophoresis, and the remaining used for purification. A scheme of the experimental flow is shown in Figure 3.
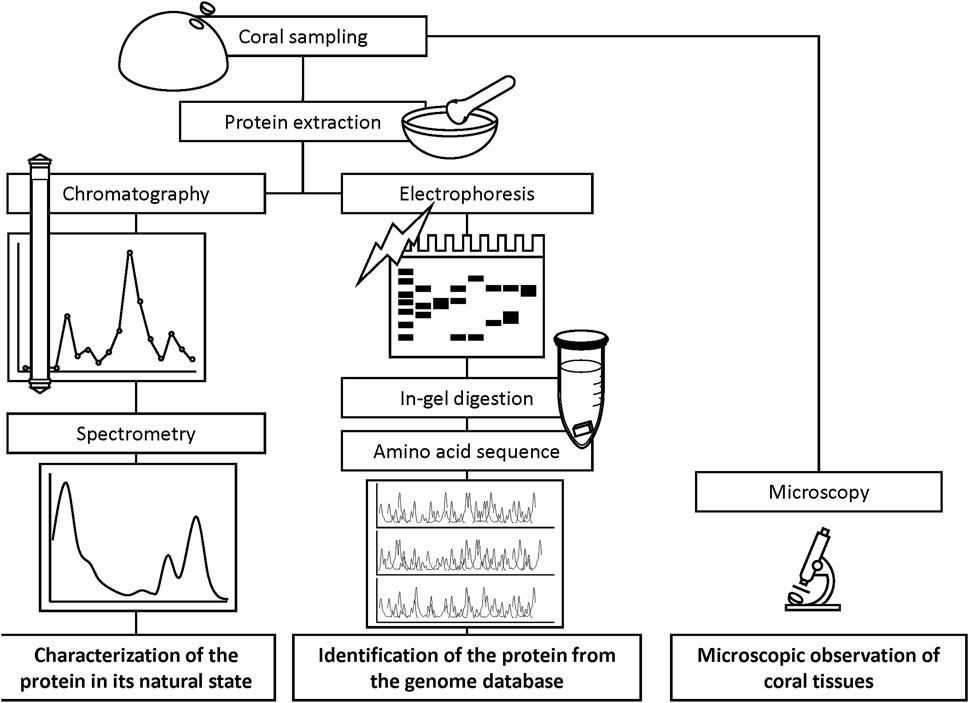
Figure 3. Schematized experimental flow for the characterization of chromoprotein.
2.3 Purification and characterization of chromoproteinsPartial purification of CPs from the protein extracts was performed via successive gel-filtration chromatography (Superdex 200 HR 10/30 column; GE Healthcare Life Science) on a fast protein liquid chromatography (FPLC) system (ÄKTA prime; GE Healthcare Life Science). The samples were eluted with 10 mM sodium phosphate buffer (pH 7.5) containing 0.15 M NaCl at a flow rate of 0.5 mL/min. Forty elution products were collected in 1-mL fractions each, and their optical properties and enzymatic activity measured. Absorbance at 280 and 580 nm was measured for each fraction using a spectrophotometer (model UV-2450; Shimadzu, Kyoto, Japan). Molecular weights were estimated using a Gel Filtration Standard molecular marker (Bio-Rad Laboratories, Hercules, California, United States of America).
2.4 Amino acid sequence identification2.4.1 Protein concentrationThe total protein content was determined using a Bio-Rad Protein Assay Kit (Bio-Rad Laboratories) based on the Bradford method (Bradford, 1976) with bovine serum albumin as a standard. The Bradford method quantifies proteins using Coomassie Brilliant Blue G-250, a triphenylmethane blue dye that binds to proteins in acidic solutions and shifts the maximum absorption wavelength from 465 to 595 nm. Absorbance at 595 nm was measured using a Shimadzu spectrophotometer (model UV-2450) at 25°C.
2.4.2 ElectrophoresisSodium dodecyl polyacrylamide gel electrophoresis (SDS-PAGE) was performed using a RAPIDAS AE-6500 apparatus (ATTO, Tokyo, Japan) with 1-mm thick precast slab gels containing 10%–20% gradient acrylamide (e-PAGEL E-T1020L; ATTO), according to the procedure described by Laemmli (1970). 100 μg of each protein extract (Pp, Ps, and H) were loaded onto the gel. Electrophoresis was performed at 40 mA for 80 min. After electrophoresis, the gel was stained with a CBB-250 solution (Wako Pure Chemical Industries, Osaka, Japan). The applied molecular mass standard (Precision Plus Protein Standards; Bio-Rad Laboratories) contained protein bands of 10, 20, 25, 37, 50, 75, 100, 150, and 250 kDa in size. Gel photographs were taken with a Panasonic DMC-GF3 camera (Panasonic, Osaka, Japan), and the molecular weights of the protein sample bands calculated using ImageJ software (http://imagej.net/) after the exposure and contrast were adjusted.
2.4.3 In-gel tryptic digestionThe protein bands obtained from the CBB-stained SDS-PAGE gel were sliced into small pieces (approximately 1 mm3) and faded with 50 mM NH4HCO3/50% acetonitrile. Proteins in the sliced gel fragments were reduced and alkylated with 10 mM dithiothreitol/50 mM NH4HCO3 for 45 min at 56°C and 55 mM iodoacetamide/50 mM NH4HCO3 at 25°C for 30 min in the dark. After being washed with acetonitrile, the proteins were digested in 10 µL trypsin (Sequencing Grade; Promega, Madison, WI, United States of America) at 37°C overnight. Tryptic peptides were extracted from the gel fragments using 50% acetonitrile containing 3% formic acid, and the peptide extracts centrifuged at 10,000 × g for 20 min in a vacuum centrifuge.
2.4.4 Liquid chromatography-tandem mass spectrometry analysisLiquid chromatography-tandem mass spectrometry analysis was performed using a linear ion trap time-of-flight mass spectrometer (LIT–TOF MS; NanoFrontier eLD; Hitachi High-Technologies Corporation, Tokyo, Japan) coupled to a nanoflow HPLC (NanoFrontier nLC; Hitachi High-Technologies Corporation) at the Instrumental Research Support Center of the Research Institute of Green Science and Technology, Shizuoka University (Shizuoka, Japan). Peptides extracted from the gel were trapped and desalted using a C18 monolith trap column (0.05 mm ID × 150 mm long; Hitachi High-Technologies Corporation) and thereafter loaded onto a MonoCap C18 Fast-flow column (0.05 mm ID × 150 mm long; GL Sciences, Inc., Tokyo, Japan). Elution was done using a linear gradient from 5% to 40% solvent B for 60 min at a flow rate of 200 nL/min. Solvent A comprised 2% acetonitrile and 0.1% formic acid, and solvent B contained 98% acetonitrile and 0.1% formic acid. The eluent was ionized using a nanoelectrospray ionization source equipped with an uncoated silica tip (New Objective, Woburn, MA, United States of America) and analyzed using LIT–TOF MS. Mass spectra were obtained by scanning in the positive ion mode in the mass range of m/z 200–2000. MS/MS spectra were generated by using collision-induced dissociation in a linear ion trap. The proteins were identified by analyzing the MS/MS data via de novo sequencing and with the protein identification software, PEAKS Studio (version 7.0; Bioinformatics Solutions, Inc., Waterloo, ON, Canada) (Ma et al., 2003). A protein identification database was generated using the protein sequences of P. astreoides, P. australiensis, and P. lobata obtained from Reef Genomics (http://reefgenomics.org/) (Liew et al., 2016). Reliability of the protein identification results obtained via PEAKS was increased through further analysis of the sequences using MASCOT MS/MS Ions Search (http://www.matrixscience.com/) (Cottrell, 2011) and the sequence tag search tool, SPIDER (Han et al., 2004). The detected proteins were identified through a similarity search of amino acid sequences using the Basic Local Alignment Search Tool (BLAST) on the National Center of Biotechnology Information database (https://blast.ncbi.nlm.nih.gov/), the DNA Data Bank of Japan (DDBJ) (http://blast.ddbj.nig.ac.jp/), and Reef Genomics.
2.4.5 Phylogenetic analysisA phylogenetic tree of the proteins identified in this study, together with other FPs described previously (Alieva et al., 2008), was constructed using an online program (http://www.phylogeny.fr/) developed by Dereeper et al. (Dereeper et al., 2008; Dereeper et al., 2010). Phylogenetic analysis was performed using the following programs: MUSCLE 3.8.31 for multiple alignments, Gblocks 0.91b for alignment refinement, PhyML 3.1 for phylogeny using maximum likelihood, and TreeDyn for tree rendering.
2.5 Microscopic observation of in vivo fluorescence in coralsOverview photographs of corals manifesting PPR and healthy-appearing corals were taken in the laboratory with an OLYMPUS E-PL6 camera under a white light-emitting diode (LED) and processed using Adobe Lightroom (Adobe, San Jose, CA, United States of America) with the following settings: exposure, +0.5; highlight, −75; shadow, −20; white level, +65; black level, −40. The fluorescence levels of each sample were observed using a stereoscopic microscope (Nikon SMZ-1000; Nikon, Tokyo, Japan), and photographs obtained using an OLYMPUS E-PL6 camera equipped with a mount conversion ring. Visible images were obtained under environmental light and an exposure of one-fifth of a second with a sensitivity of ISO 400. Fluorescence images were obtained through excitation with a blue LED with a wavelength range of 380–550 nm (KR93SP; Eco-lamps Inc., Kowloon, Hong Kong), exposure for 13 s with a sensitivity of ISO 100, and filtering through a 600-nm bandpass filter (BPB-60; Fujifilm, Tokyo, Japan). The bandpass filter was attached to the objective lens of the microscope. All images were processed using Adobe Lightroom software.
2.6 Maximum quantum yield of photosystem IIThe photosynthetic activity of Symbiodiniaceae under each coral condition was evaluated using the maximum quantum yield of photosystem II (Fv/Fm), and the minimum fluorescence yield (F0) measured using Junior-PAM (Walz, Effeltrich, Germany). Coral nubbins were subjected to dark acclimation for 30 min (Krause and Weis, 1991). The Fv/Fm and F0 values measured at 10 different points in every coral nubbin were used to estimate averages and standard errors (Supplementary Table S1).
2.7 Hydrogen peroxide-scavenging activityEnzyme samples were prepared by removing excess water from the collected coral pieces and excavating nine points (1.0–1.5 cm2) on each coral colony surface (Pp and H) using whetstone drilling. The excavated areas were rinsed with 1 mL of 50 mM Tris-HCl buffer (pH 7.6) to collect the coral tissue, and the extract centrifuged at 10,000 × g for 3 min to remove debris. The supernatant was used to measure the protein concentration and hydrogen peroxide-scavenging activity (HSA), following the method described in Palmer et al., 2009a. To measure HSA, each 50 µL of the sample (coral tissue in buffer solution) and 50 µL of 50 mM hydrogen peroxide solution were mixed on 96-wells microplate. The absorbance at 240 nm was measured every 81 s for 30 min, and the data converted using a standard curve of hydrogen peroxide (serial dilutions: 0, 6.25, 12.5, 25, and 50 mM). HSA was normalized to the protein concentration (Supplementary Table S2).
2.8 Statistical analysisIndependent-samples t-test analysis was carried out to determine significant differences between the Fv/Fm and HSA data from Pp colony and H colony. Normality of the data was tested using Anderson–Darling test. Significant differences were evaluated at p < 0.01.
3 Results3.1 Purification and characterization of chromoproteinsThe soluble fraction of coral tissues manifesting Pp was separated into 40 elution fractions using FPLC. Of these, elution product 18 (18 mL elution volume) showed the highest absorbance at a wavelength of 580 nm (Figure 4A). Using a marker protein, the molecular weight of the main peak fraction (18) was estimated to be 49 kDa. The absorption spectrum of the main fraction is shown in Figure 4B.
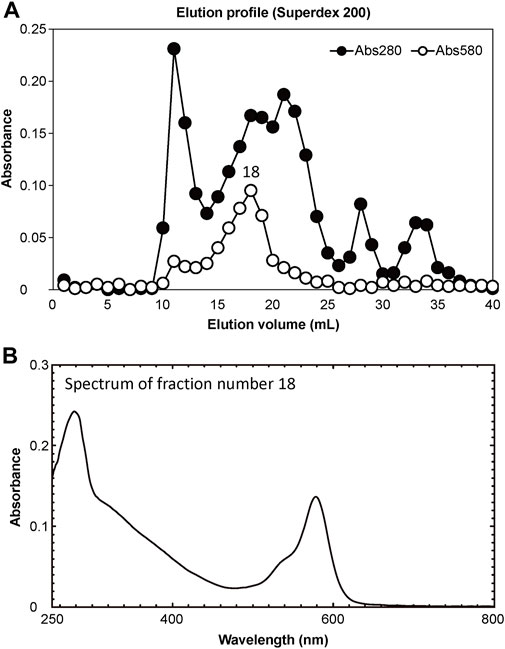
Figure 4. Results of purification of extracted proteins. (A) Separation of pink-coloured protein by Superdex 200 gel filtration column chromatography. Solid and open circles indicate protein fractions measured at 280 nm (estimate protein content) and 580 nm (estimate CP content), respectively. (B) Absorption spectrum of peak fraction number 18 in the elution profile.
3.2 Identification of chromoproteins from corals manifesting pink pigmentation responsesThree notable bands on the SDS-PAGE gel were found in the Ps and Pp coral tissues (Figure 5; bands 1–3). PEAKS analysis showed that the proteins extracted from bands 1 and 2 (Protein A) had the same alignment as that of the candidate protein (Porites_australiensis_11250) that was detected in the protein sequences of P. australiensis with high coverage (75%). The amino acid sequence of Protein A was queried on Reef Genomics with the protein database “Porites lutea gene models (ReFuGe 2020),” which identified 20 homologous proteins. Reanalysis of the Protein A was performed with these 20 proteins using PEAKS, where the database identified six proteins with high scores and coverage values with respect to the proteins synthesized by P. lutea. The amino acid sequences of these six proteins are shown in Figure 6. Among the six proteins, plut2.m8.16902.m1 with a GFP domain had the highest coverage (81%). Alignment of plut2.m8.16902.m1 using the BLAST search program in the DDBJ database revealed high similarities with other CPs and FPs from Acropora aculeus, A. digitifera, Goniopora tenuidens, Galaxea fascicularis, A. millepora, and many other coral species (Table 1). Using electrophoresis and amino acid sequence analyses (in-gel trypsin digestion and liquid chromatography-tandem mass spectrometry analysis), its molecular weight was determined to be 25 kDa (Figure 5; Table 1). The protein in band 3 (Protein B) was also analyzed using the same methods and showed a high similarity with thioredoxin-like proteins from several marine organisms (Table 1). On the other hand, no remarkable band in the electrophoresis result near 25 kDa (CPs and GFP) was found for the healthy colony: the greenish appearance of the healthy colony (Figure 2A) was due to the reflection from the green band of the endolithic community that was well developed underneath the coral tissue and not to the presence of GFP. Moreover, the molecular weight of GFP in Porites lutea is 24.8 kDa (Porites lutea database in Reef Genomics) but, from the electrophoresis study, the healthy coral did not show high expression of protein in the band corresponding to GFP’s molecular weight. Phylogenetic analysis revealed that the six identified proteins were nonfluorescent, similar to that of other CPs in several coral species (Figure 7).
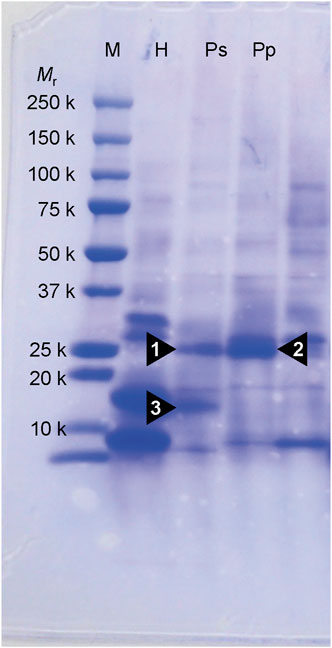
Figure 5. SDS-PAGE on 10% polyacrylamide gel of partially purified protein extracts from corals. Proteins were stained by coomassie brilliant blue R-250. Numerals under Mr denote the molecular masses of marker protein. Arrowhead (1, 2 and 3) indicates a protein that appears specifically in the pink lesions of Ps and Pp. M, molecular weight markers; H, healthy-appearing colony; Ps, pink spot exhibiting colony; Pp, pink patch exhibiting colony.
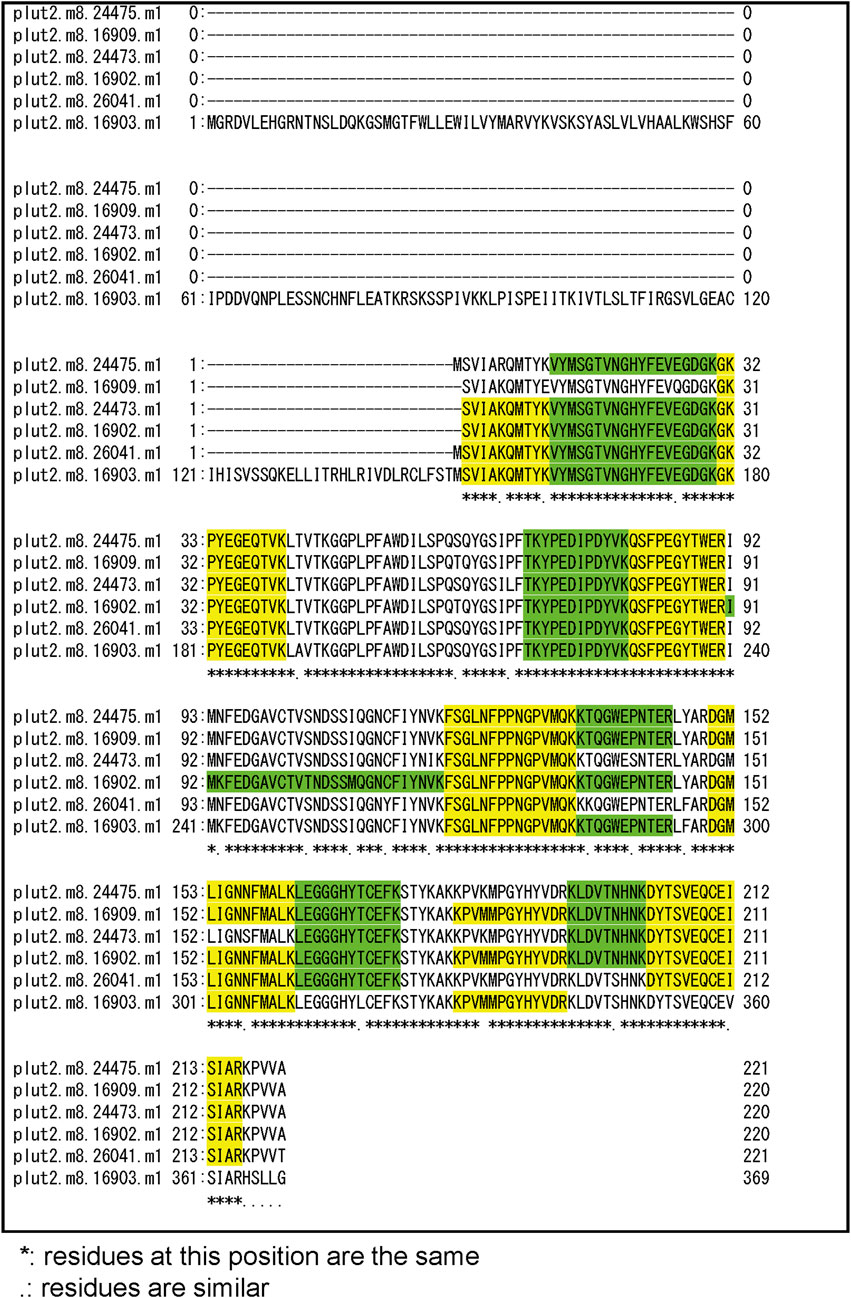
Figure 6. Alignment of amino acid sequence of 6 candidate proteins that hitted with high coverage values for peptide fragments of bands 1 and 2 (Protein A) in Figure 5. Peptide fragments detected by PEAKS Software were indicated as green and yellow.
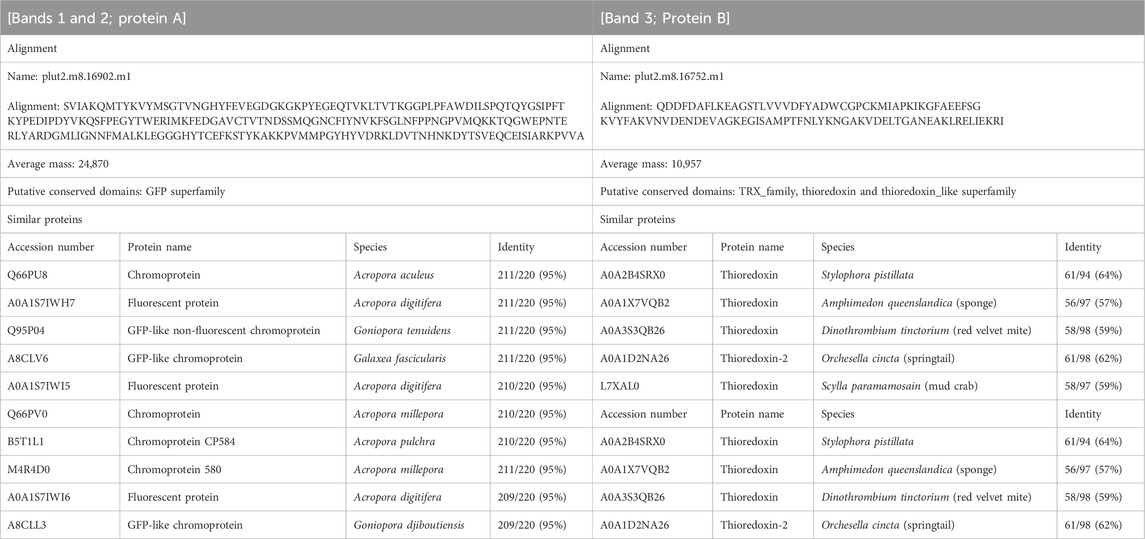
Table 1. Amino acid sequences and homologues of protein that were specific for corals manifesting Ps and Pp. Alignments were determined by BLAST search from database of P. lutea on Reef Genomics. Putative conserved domains and similar proteins were determined by BLAST search from UniProtKB/Swiss-Prot + TrEMBL database on DDBJ.
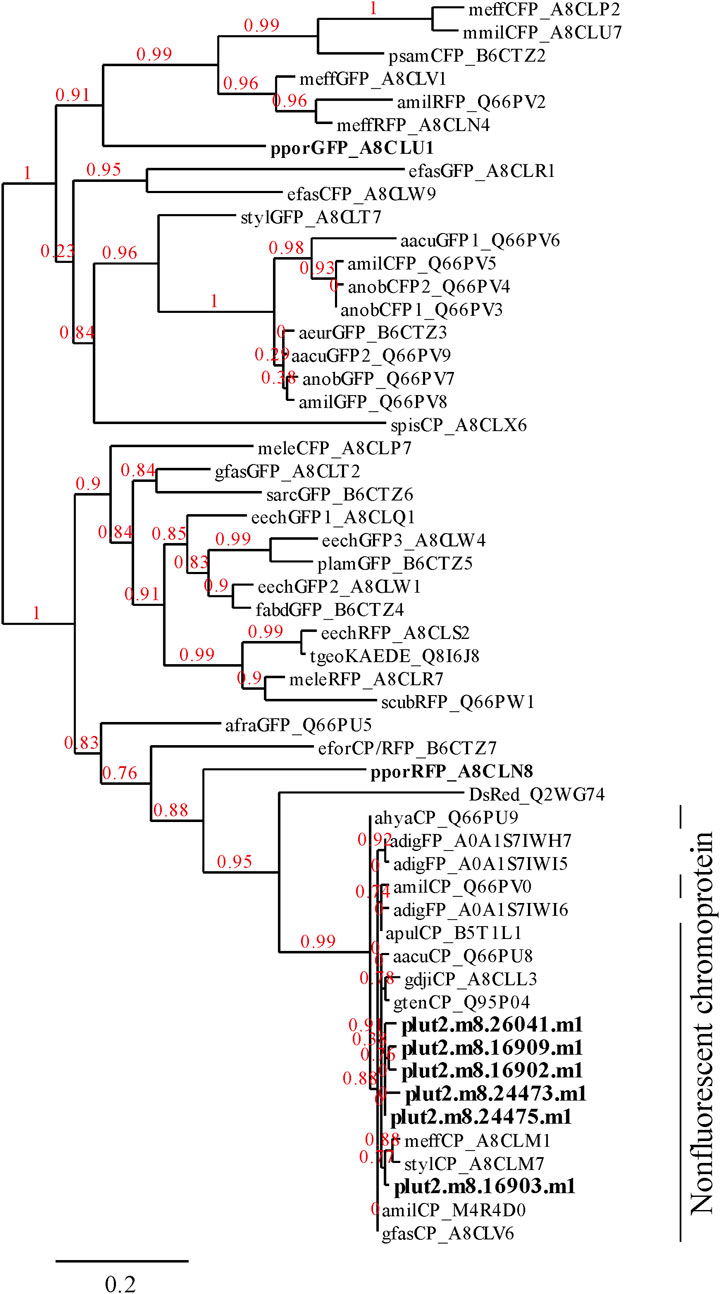
Figure 7. Phylogenetic tree showing the relationships among 6 proteins found in the present research (Figure 6) and FPs and CPs of corals. The alignments of P. lutea protein were identified using PEAKS analysis. Other FPs listed in Alieva et al. (Alieva et al., 2008) were obtained from the database of UniProt (http://www.uniprot.org/). The 6 proteins identified in this study and other FPs of Porites spp. are indicated in bold text.
3.3 Localization of chromoproteins and red fluorescent protein in corals displaying pink pigmentation responsesFigure 8 shows the aspect of the colony manifesting Pp (Figure 8A,C,E) and healthy-appearing coral colony (Figure 8B,D,F) under visible light, and their fluorescence under a stereoscopic microscope using the bandpass filter transmitting light at 600 nm wavelength. Under visible light, the entire surface of the corals was purple and the tentacles a pale pink (Figure 8C). Conversely, under blue LED light and bandpass filter, red fluorescence was observed only at the tip of the tentacles (Figure 8E), and slight fluorescence was observed in healthy-appearing corals (Figure 8F).
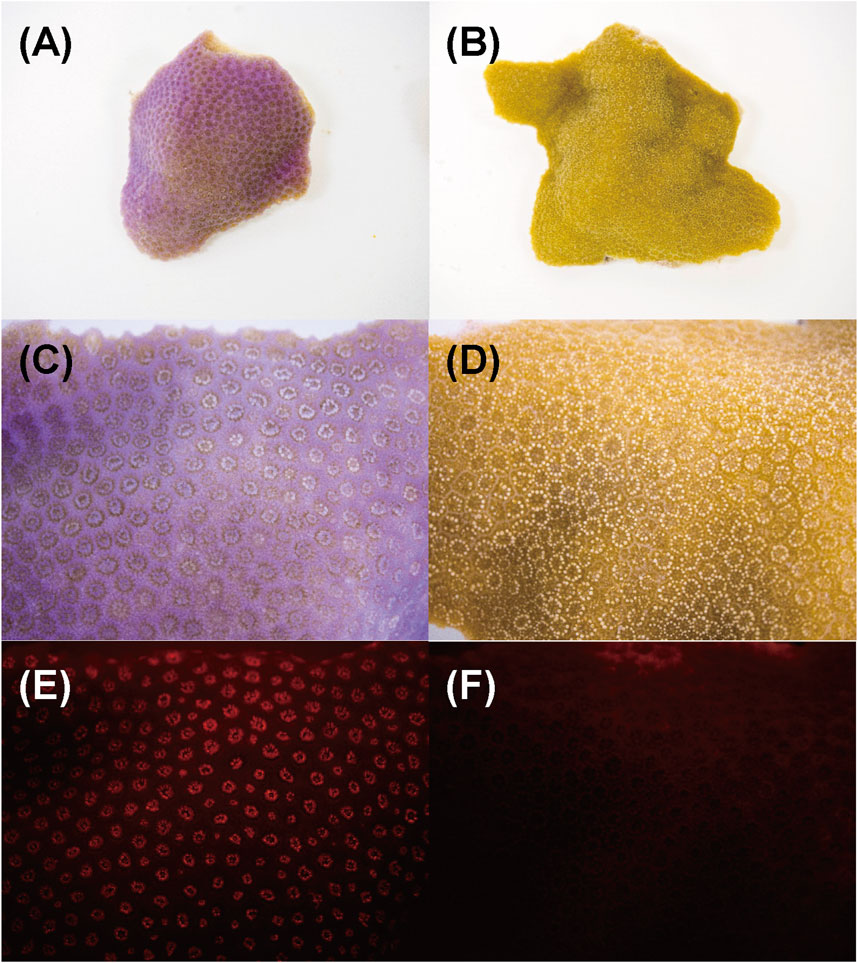
Figure 8. Aspects of Porites nubbins and fluorescence image that were taken under microscope. Images of (A, B) are overview of corals nubbins and (C–F) are magnified images (10X). (A, C, and E) Coral manifesting pink patch (Pp), (B, D and F) healthy-appearing colony (H). The (E and F) are fluorescent image under blue LED light.
3.4 Evaluation of the coral stress stateThe stress conditions of the studied corals and their Symbiodiniaceae were estimated by measuring the Fv/Fm and F0 (Table 2), as well as the HSA (Table 3). The Fv/Fm and F0 values of the corals with pink pigmentation were 0.434 and 369.5, respectively, which were significantly lower than those of healthy-appearing corals (0.521 and 597.3, respectively) (p < 0.01). Furthermore, the HSA value of corals manifesting pink pigmentation (1.88 nmol min−1 mg−1 protein) was 4.3 times significantly higher than that of healthy-appearing corals (0.44 nmol min−1 mg−1 protein) (p < 0.01).
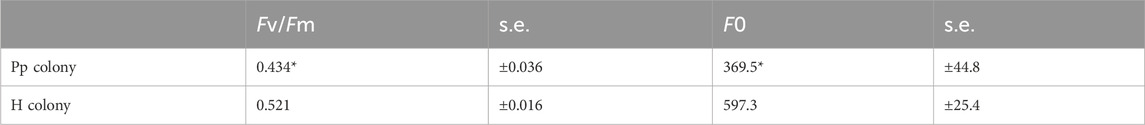
Table 2. Comparison of maximum quantum yield of photosystem II (Fv/Fm) and minimum fluorescence yield (F0) of each coral colony (Pp and H). Means ± s.e. (n = 10). Asterisks mean significant differences with healthy-appearing coral by t-test at p < 0.01.
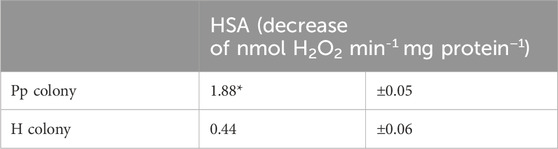
Table 3. Comparison of hydrogen peroxide scavenging activity (HSA) of each coral colony (Pp and H). Means ± s.d. (n = 9). Asterisks mean significant differences with healthy-appearing coral by t-test at p < 0.01.
4 DiscussionThe pink pigment produced by corals manifesting PPRs was found to be a type of nonfluorescent CP. Our results also revealed that the CP was common in Ps and Pp lesions and homologous to other nonfluorescent CPs that have been reported in other corals (Alieva et al., 2008; Shinzato et al., 2012; Takahashi-Kariyazono et al., 2018). Furthermore, Protein A in this study showed high similarity to the six nonfluorescent CPs that are encoded in the genome of P. lutea, especially plut2.m8.16902.m1 (plutCP) (Figure 6). In particular, the fragments from I91–K118 were not detected in proteins other than plutCP. In addition, proteins other than nonfluorescent CPs were detected with low coverage and intensity using PEAKS analysis. These results indicate that plutCP expressed in the PPR lesions was a major protein present in the bands 1 and 2. As only plutCP was detected with the highest degree of similarity, we assumed that only this protein could be responsible for the pink-colored tissue. A BLASTP search of the plutCP protein identified several CPs and FPs with high similarities, including CPs of A. aculeus (accession number Q66PU8), A. millepora (Q66PV0 and M4R4D0), A. pulchra (B5T1L1), G. tenuidens (Q95P04), G. djiboutiensis (A8CLL3), and G. fascicularis (A8CLV6), and FPs of A. digitifera (A0A1S7IWH7, A0A1S7IWI5, and A0A1S7IWI6). Although these CPs have a maximum absorbance at a wavelength of approximately 580 nm, they did not produce any fluorescence (Alieva et al., 2008). Furthermore, the amino acid sequences of plutCP and the other five proteins were compared with those of several known FPs, DsRed (Q2WG74), KAEDE (Q8I6J8), asFP595 (Q9GZ28), and other proteins listed in Table 1 by Alieva et al., 2008 (Figure 7). Surprisingly, all six proteins found in this study were identified as nonfluorescent CPs, unlike other RFPs, confirming that plutCP is a type of nonfluorescent CP that belongs to clade B in Alieva’s classification. Clade B mainly consists of purple and blue nonfluorescent CPs, and their genes have been found in Acroporidae, Pocilloporidae, Poritidae, Faviidae, Pectinidae, Oculinidae, and Dendrophyliidae. In this study, novel CP genes from P. lutea were added to this clade, and plutCP isolated from coral tissue. Finally, to confirm that the protein was indeed a nonfluorescent CP, we examined the corals using optical and fluorescence microscopy (Figure 8). A red-purple color was found throughout the coenosarc, and was particularly intense in color, whereas the tips of the tentacles were pale. In contrast, fluorescence observations revealed strong red fluorescence at the tips of the tentacles and almost no fluorescence in the coenosarc. Fluorescence images were obtained by filtering through a 600-nm bandpass filter attached under the objective lens of the microscope. Therefore, the red fluorescence of chlorophyll that is predominantly detected at a wavelength of 680 nm was removed; thus, the red fluorescence detected was most likely because of RFP, which emits fluorescence at wavelengths below 600 nm. As a reference, similar observations in healthy corals showed almost no fluorescence, suggesting that the detected fluorescence was a result of RFP and not chlorophyll. Thus, the protein responsible for the reddish-purple discoloration found in PPR was different from a RFP and confirmed to be an independent, nonfluorescent CP. These results indicate that CPs were distributed uniformly across the surface of the coral colonies mainly in the coenosarc, and the localization of the CPs was different from that of RFP. The molecular weight of plutCP extracted from massive Porites spp. manifesting PPRs was different in the SDS-PAGE (25 kDa), amino acid sequence (24,870 Da), and gel-filtration chromatography (49 kDa), and this result can be attributed to the formation of a dimer under native conditions, similar to that observed for GFP (Ward and Cormier, 1979). Ahmed et al. (2022) also reported that other CPs (gfasPurple, amilCP, spisPink, and eforRed) form dimers in solution, based on X-ray crystal structure analysis.
The present study demonstrated that CPs were encoded in the genome of Porites corals (P. astreoides, P. australiensis, and P. lobata), and the same CP expressed in different morphologies of PPRs (Ps and Pp), associated with the pink pigmentation response of inflamed tissues. Three presumed CP sequences were also identified in A. digitifera (Shinzato et al., 2012). These sequences were also included in the same clade as the six Porites sequences obtained in our study, which supports the present results as the 6 detected proteins beat similar properties as non-fluoresce and the formation of dimers. Moreover, in addition to plutCP synthesized by Porites spp. corals, a thioredoxin-like protein that is linked to redox signaling was expressed at high levels in the Ps lesions (Figure 5, Band 3).
The CP of Porites spp. was detected only in tissues that manifested PPRs. In relation to other types of CPs, Shinzato et al. (2012) reported that the three CPs of A. digitifera were highly expressed in the developmental stages but very poorly in adults. Studies by Takahashi-Kariyazono et al. (2018) also showed that FPs in middle-/long-wavelength emissions (519, 606, and 613 nm) and CPs were important for Acropora larvae, but were not expressed in adults. However, Smith et al. (2013) and Gittins et al. (2015) reported that high-level expression of CPs in adult corals (Acropora nobilis and A. millepora) was correlated with the reduction of photodamage under acute light stress, confirming the photoprotective function of CPs. This, together with the results of electrophoresis in the present study, show Porites spp. corals manifesting PPR lesions expressed high levels of CPs rather than in healthy tissues.
The PPRs in Porites spp. corals are highly distributed in the apical area of the colony, which is impacted by light in the shallow reefs of Okinawa during the low-tide period, in contrast to those medial and basal areas of the colony which are self-shaded (Yucharoen, 2016). The high production of CPs in the restricted PPR lesions reflects a focalized immune response of these corals to environmental stressors: biotic as the penetration of boring organisms, and more importantly, abiotic factors such as the salinity, the height of low tide, the time of exposure to air, and nutrient concentration, among others (In Yucharoen, 2016, pg.41, Table 5). In addition, RFPs and CPs coexist in the PPR lesions, but their distribution differs within the coral tissue, mainly coenosarc for CPs and tip of polyps’ tentacles for RFPs. CPs and their homologs have been suggested to serve as coral health indicators, as they usually protect cells against free radicals, and CPs likely also play important roles in the coral immune system and photoprotection, similar to that of RFPs. Palmer et al. (2009a) demonstrated that various CPs may act as antioxidants in coral hosts, showing a greater ability to scavenge hydrogen peroxide in inflamed tissues than healthy tissues. Correspondingly, the current study found high hydrogen peroxide-scavenging rates in Porites spp. corals tissues affected by PPR confirming this hypothesis. Several cases, such as dark-blue pigment in A. hemprichii (Rinkevich et al., 1994), pink-blue spot syndrome in A. eurystoma (Bongiorni and Rinkevich, 2005), dark spot syndromes in Porites, Siderastrea, and Montastraea (Cervino et al., 2001; Borger, 2005), and purple pigment in octocorals (Mullen et al., 2006), have been reported, but information about the presence and roles of CPs in Porites corals is scarce. D’Angelo et al. (2012) proposed that coloration changes in hosts expressing GFP-like proteins in response to wounding and infestation. Yucharoen (2016) reported a remarkable increase in CPs in relation to high HSA. Taken together, these studies indicate that massive Porites may produce CPs as an immune response against oxidative stress promoted by several environmental disturbances (biotic and abiotic), resulting in PPR lesions. Therefore, it can be concluded that the CP isolated from Porites. in the present study might possess antioxidant activity, contributing to the coral defense mechanism against ROS induced by various stresses (Yucharoen, 2016), and opportunistic infection in coral tissues displaying PPRs.
Although Porites corals are tolerant species that can adapt to various environments (Cantin and Lough, 2014), they occasionally show sensitivity to environmental stresses (Raymundo et al., 2005). Our results indicate that PPRs on Porites spp. in the area of Sesoko Lagoon could be promoted by environmental stressors and/or mechanical injuries caused by fish bites or boring organisms. CP, which is specifically expressed in PPR lesions, may serve as an antioxidant in the affected coral tissue. Furthermore, CP and RFP showed differential distribution within the PPR lesion, suggesting that CP, which is uniformly distributed in the coenosarc and covers a wide surface area, may have a more important role as an antioxidant than that of RFP, which is present only at the tips of tentacles.
This is the first study to report the role and distribution of CPs in corals manifesting PPR lesions. We believe that these findings will aid our understanding of PPR formation mechanism, which is an important subject in coral disease research. In addition, we describe, for the first time, the coexistence of nonfluorescent proteins and FPs in massive Porites spp. manifesting PPRs. Despite the PPR morphology (Ps or Pp) of Porites spp., the corals expressed the same type of CP. CPs have potential applications as genetic markers and cellular biosensors because of their ease of detection (Liljeruhm et al., 2018). The protocol used in this study, including genome analysis and microscopic observation using different filters, could be applied in future studies of pigments that commonly manifest in corals affected by other diseases. Therefore, this method opens the possibility to a deeper understanding of coral disease mechanisms in response to changing environment.
5 CompliancePermission for coral sampling was obtained from Okinawa Prefecture (permit No. 30–55). The permit period was from 20 July 2018 to 19 July 2019.
Data availability statementThe original contributions presented in the study are included in the article/Supplementary Material, further inquiries can be directed to the corresponding author.
Ethics statementThe manuscript presents research on animals that do not require ethical approval for their study.
Author contributionsTS: Writing–original draft, Investigation, Conceptualization, Methodology, Formal Analysis, Visualization, Validation, Data curation, Writing–review and editing. BC: Writing–original draft, Writing–review and editing, Validation, Supervision, Resources, Project administration, Methodology, Funding acquisition. MY: Writing–original draft, Writing–review and editing, Formal Analysis, Validation, Data curation. HD: Writing–review and editing, Methodology, Formal Analysis, Data curation. YS: Writing–review and editing, Supervision, Project administration.
FundingThe author(s) declare that financial support was received for the research, authorship, and/or publication of this article. Grant-in-Aid for Fund for the Promotion of Joint International Research [Fostering Joint International Research (B)] from the Japanese Ministry of Education, Culture, Sports, Science and Technology (MEXT) (No. 18KK0298), and by the 50th Anniversary Grant from the Mitsubishi Corporation on “Global Coral Reef Conservation Project (GCRCP). The funders were not involved in the study design, collection, analysis, interpretation of data, the writing of this article, or the decision to submit it for publication.
AcknowledgmentsWe are grateful to the staff at Sesoko Station, Tropical Biosphere Research Center (University of the Ryukyus, Japan), for providing the necessary facilities during this study, and to Mr. Sunao Uehara for his assistance with coral sampling.
Conflict of interestThe authors declare that the research was conducted in the absence of any commercial or financial relationships that could be construed as a potential conflict of interest.
The author(s) declared that they were an editorial board member of Frontiers, at the time of submission. This had no impact on the peer review process and the final decision.
Publisher’s noteAll claims expressed in this article are solely those of the authors and do not necessarily represent those of their affiliated organizations, or those of the publisher, the editors and the reviewers. Any product that may be evaluated in this article, or claim that may be made by its manufacturer, is not guaranteed or endorsed by the publisher.
Supplementary materialThe Supplementary Material for this article can be found online at: https://www.frontiersin.org/articles/10.3389/fphys.2024.1339907/full#supplementary-material
ReferencesAeby G. S. (1992). The potential effect the ability of a coral intermediate host to regenerate has had on the evolution of its association with a marine parasite. Proceeding of the Seventh International Coral Reef Symposium, Guam, 1992, 2.
Aeby G. S. (2003). Corals in the genus Porites are susceptible to infection by a larval trematode. Coral Reefs 22, 216. doi:10.1007/s00338-003-0310-9
CrossRef Full Text | Google Scholar
Aeby G. S., Williams G. J., Franklin E. C., Kenyon J., Cox E. F., Coles S., et al. (2011). Patterns of coral disease across the Hawaiian Archipelago: relating disease to environment. PLoS ONE 6, e20370. doi:10.1371/journal.pone.0020370
PubMed Abstract | CrossRef Full Text | Google Scholar
Ahmed F. H., Caputo A. T., French N. G., Peat T. S., Whitfield J., Warden A. C., et al. (2022). Over the rainbow: structural characterization of the chromoproteins gfasPurple, amilCP, spisPink and eforRed. Acta Crystallogr. D. Struct. Biol. 78 (Pt 5), 599–612. doi:10.1107/S2059798322002625
PubMed Abstract | CrossRef Full Text | Google Scholar
Alieva N. O., Konzen K. A., Field S. F., Meleshkevitch E. A., Hunt M. E., Beltran-Ramirez V., et al. (2008). Diversity and evolution of coral fluorescent proteins. PLoS ONE 3, e2680. doi:10.1371/journal.pone.0002680
PubMed Abstract | CrossRef Full Text | Google Scholar
Beeden R., Willis B., Raymundo L., Page C., Weil E. (2008). Underwater cards for assessing coral health on indo-pacific reefs - Resources - CCRES.
Benzoni F., Galli P., Pichon M. (2010). Pink spots on Porites: not always a coral disease. Coral Reefs 29, 153. doi:10.1007/s00338-009-0571-z
留言 (0)