
記住我


An increase in intracellular Ca2+ concentration ([Ca2+]i) with different spatio-temporal features is the primary mechanism by which vascular endothelial cells and endothelial colony forming cells (ECFCs) regulate a plethora of cardiovascular functions (McCarron et al., 2017; Moccia et al., 2023b), including vascular tone and permeability (De Bock et al., 2013; Ottolini et al., 2019), angiogenesis (Moccia et al., 2019; Negri et al., 2019), and vasculogenesis (Lodola et al., 2017; Zuccolo et al., 2018). The endothelial Ca2+ response to extracellular stimuli, including hormones, neurotransmitters, and growth factors, is triggered by inositol-1,4,5-trisphosphate (InsP3)-induced Ca2+ release from the endoplasmic reticulum (ER) and maintained over time by store-operated Ca2+ entry (SOCE) (Moccia et al., 2023a; Moccia et al., 2023b). However, recent studies have highlighted that the lysosomal Ca2+ store can also play a crucial role in patterning the endothelial Ca2+ signals (Moccia et al., 2021a; Negri et al., 2021b). The second messenger nicotinic acid adenine dinucleotide phosphate (NAADP) can support intracellular Ca2+ release by gating two pore channels (TPCs), which exist in two isoforms and mediate lysosomal Ca2+ release in response to several endothelial autacoids (Brailoiu et al., 2010; Esposito et al., 2011; Favia et al., 2014; Zuccolo et al., 2019a; Zuccolo et al., 2019b; Berra-Romani et al., 2020; Negri et al., 2022). Transient Receptor Potential Mucolipin 1 (TRPML1) provides an additional pathway for lysosomal Ca2+ release (Kilpatrick et al., 2016; Thakore et al., 2020; Negri et al., 2021b; Moccia et al., 2023c; Scorza et al., 2023). TRPML1 is mainly located in late endosomes and lysosomes (Dong et al., 2010; Zhang et al., 2012; Kilpatrick et al., 2016; Li et al., 2019) and may be gated by the lysosome-associated phosphoinositide, phosphatidylinositol 3,5-bisphosphate, (PI(3,5)P2) (Dong et al., 2010; Zhang et al., 2012), which is generated by the lipid kinase PYKfive (Isobe et al., 2019). It has been widely recognized that TRPML1 mediates local Ca2+ signals that normally do not spread to the whole cytosol, but are spatially restricted to the perilysosomal space to control autophagy (Medina et al., 2015), lysosome volume (Cao et al., 2017), and lysosome trafficking (Xu and Ren, 2015). However, several studies have recently shown that TRPML1-mediated lysosomal Ca2+ release may also result in global increases in [Ca2+]i that require the functional interaction with ER Ca2+ release through InsP3Rs or ryanodine receptors (RyRs) and with SOCE (Kilpatrick et al., 2016; Thakore et al., 2020; Boretto et al., 2023; Scorza et al., 2023). Surprisingly, little information is available about the role played by TRPML1 in vascular endothelial cells (Negri et al., 2021b; Lai et al., 2024; Yang et al., 2024; Zhang et al., 2024). The synthetic TRPML1 agonist, ML-SA1, induces peri-lysosomal Ca2+ signals that promote lysosome movement and lysosome-multivesicular bodies interaction in mouse coronary artery endothelial cells (Li et al., 2022). It is, however, still unknown whether TRPML1 also induces Ca2+ signals in human vascular endothelial cells and whether they are supported by InsP3-induced ER Ca2+ release.
The hCMEC/D3 cell line is the most widely used model of human cerebrovascular endothelial cells (Bintig et al., 2012; Weksler et al., 2013; Helms et al., 2016; Bader et al., 2017; Luo et al., 2019) and provides a predictive model to investigate how endothelial Ca2+ signals are shaped and regulate the Ca2+-dependent production of vasorelaxing mediators, such as nitric oxide (NO), at the human blood-brain barrier (Negri et al., 2021c; Soda et al., 2023). Several studies have shown that neurotransmitters and neuromodulators, such as acetylcholine, glutamate, γ-aminobutyric (GABA), and histamine, evoke NO release from hCMEC/D3 cells through an increase in [Ca2+]i that is patterned by InsP3-induced ER Ca2+ release, NAADP-induces lysosomal Ca2+ mobilization, and SOCE (Zuccolo et al., 2019b; Berra-Romani et al., 2020; Negri et al., 2020; Negri et al., 2022). Herein, we demonstrate that the lysosomal TRPML1 is also expressed in hCMEC/D3 cells. We also provide the first evidence that TRPML1-mediated endothelial Ca2+ signals are supported by ER Ca2+ release through InsP3Rs and by SOCE. We further show that the genetic and pharmacological blockade of TRPML1 reduced the ER Ca2+ load. Moreover, TRPML1-mediated global Ca2+ signals lead to robust NO release that may regulate a variety of processes, including an increase in local cerebral blood flow (CBF), at the neurovascular unit. Finally, we provide the first evidence that TRPML1 support agonist-induced intracellular Ca2+ release and NO production in vascular endothelial cells. These findings hint at TRPML1 as an additional component of the endothelial Ca2+ toolkit that may be recruited by extracellular autacoids to regulate the endothelial Ca2+-dependent functions.
2 Materials and methods2.1 Cell cultureHuman cerebral microvascular endothelial cells (hCMEC/D3) were obtained from Institut National de la Santé et de la Recherche Médicale (INSERM, Paris, France). hCMEC/D3 cells between passage 25 and 35 were used and cultured as described in (Negri et al., 2022; Berra-Romani et al., 2023). The cells were seeded at a concentration of 27.000 cells/cm2 and grown in tissue culture flasks coated with 0.1 mg/mL rat tail Collagen type 1, in the following medium: EBM-2 medium (Lonza, Basel, Switzerland) supplemented with 5% fetal bovine serum, 1% Penicillin-Streptomycin, 1.4 μM hydrocortisone, 5 μg/mL ascorbic acid, 1/100 chemically defined lipid concentrate (Life Technologies, Milan, Italy), 10 mM HEPES and 1 ng/mL basic fibroblast growth factor. The cells were cultured at 37 °C, 5% CO2 saturated humidity.
2.2 SolutionsPhysiological salt solution (PSS) had the following composition (in mM): 150 NaCl, 6 KCl, 1.5 CaCl2, 1 MgCl2, 10 Glucose, 10 Hepes. In Ca2+-free solution (0Ca2+), Ca2+ was substituted with 2 mM NaCl, and 0.5 mM EGTA was added. Solutions were titrated to pH 7.4 with NaOH. The osmolality of PSS as measured with an osmometer (Wescor 5,500, Logan, UT, United StatesA) was 300–310 mOsm/L.
2.3 [Ca2+]i and NO imagingCells were on glass gelatin-coated coverslips at a density of 5,000 cells/cm2 for 24–48 h (Mussano et al., 2020). Cells were next loaded the selective Ca2+-fluorophore Fura-2 acetoxymethyl ester (2 µM Fura-2/AM; Thermo Fisher Scientific, Waltham, MA, United States) in PSS for 30 min at 37°C and 5% CO2, as described in (Negri et al., 2022; Berra-Romani et al., 2023). After washing in PSS, the coverslip was fixed to the bottom of a Petri dish and the cells were observed by an upright epifluorescence Axiolab microscope (Carl Zeiss, Oberkochen, Germany), usually equipped with a Zeiss ×40 Achroplan objective (water-immersion, 2.0 mm working distance, 0.9 numerical aperture). The cells were excited alternately at 340 and 380 nm, and the emitted light was detected at 510 nm. A first neutral density filter (1 or 0.3 optical density) reduced the overall intensity of the excitation light, and a second neutral density filter (optical density = 0.3) was coupled to the 380 nm filter to approach the intensity of the 340 nm light. A round diaphragm was used to increase the contrast. The excitation filters were mounted on a filter wheel (Lambda 10, Sutter Instrument, Novato, CA, United States). Custom software, working in the LINUX environment, was used to drive the camera (Extended-ISIS Camera, Photonic Science, Millham, United Kingdom) and the filter wheel, and to measure and plot online the fluorescence from 10 up to 40 rectangular “regions of interest” (ROIs). Each ROI was identified by a number. Since cell borders were not clearly identifiable, a ROI may not include the whole cell or may include part of an adjacent cell. Adjacent ROIs never superimposed. [Ca2+]i was monitored by measuring, for each ROI, the ratio of the mean fluorescence emitted at 510 nm when exciting alternatively at 340 and 380 nm (F340/F380). An increase in [Ca2+]i causes an increase in the ratio (Negri et al., 2022; Berra-Romani et al., 2023). Ratio measurements were performed and plotted online every 3 s. The experiments were performed at room temperature (22 °C). The Fe2+ quench experiments were performed as described in (Kilpatrick et al., 2016) by replacing CaCl2 with an equimolar amount of FeCl2 and measuring the quenching of Fura-2 fluorescence at 360 nm, i.e., the isosbestic point for Fura-2.
To evaluate NO release, hCMEC/D3 cells were loaded with 4-Amino-5-methylamino-2′,7′-difluorofluorescein diacetate (1 μM, DAF-FM DA) for 60 min in PSS at 22°C, as illustrated in (Negri et al., 2020; Berra-Romani et al., 2023). DAF-FM fluorescence was measured by using the same imaging setup described above for Ca2+ measurements but with a different filter set, i.e., excitation at 480 nm and emission at 535 nm wavelength (emission intensity denoted as NOi (F535/F0)). The changes in DAF-FM fluorescence evoked by extracellular stimulation were recorded and plotted online every 5 s. Measurements of NO were performed at 22 °C. The cellular production of NO was reported as relative fluorescence (F/F0) of DAF-FM DA, where F is the fluorescence intensity obtained during recordings and F0 is the basal fluorescence intensity.
2.4 ImmunoblottingCells were seeded on a 6-well culture plate, grown to a confluency of 70%–80%, and then silenced or not, according to the protocol described below. For cell lysis, plates were kept on ice and cells were washed twice in ice-cold PBS, scraped with RIPA buffer (Pierce® RIPA Buffer, Thermo Fisher Scientific, Waltham, MA, United States) and protease inhibitor cocktail (Halt™ Protease Inhibitor Cocktail, 1:100, Thermo Fisher Scientific, Waltham, MA, United States). Lysates were vortexed and kept on ice for 10 min, then centrifuged at 4 °C for 15 min at 13,000× g. Protein concentrations were determined by using a Bicinchoninic Acid (BCA) kit (Merck KGaA, Darmstadt, Germany) following the manufacturer’s instructions. 20 μg of lysates were resuspended in SDS loading buffer, heated 30 min at 37 C and then separated on 4%–15% Mini-PROTEAN TGX Precast Protein Gels Bio-Rad (Bio-Rad, Hercules, CA; United States). Then, the proteins were transferred out of the gel on to the PVDF Membrane (Trans-Blot Turbo Transfer Pack, Bio-Rad, Hercules, CA; United States) with the Trans-Blot Turbo Transfer apparatus (BioRad, Hercules, CA; United States). Membranes were blocked by incubation for 1 h at room temperature in TBST (20 mM Tris, 150 mM NaCl, 0.1% Tween 20, pH 7.6) 5% BSA solution and then incubated in agitation overnight at 4 °C with rabbit anti–TRPML1 (#ACC-081, 1:200 in TBST 5% BSA 0.02% sodium azide; Alomone, Jerusalem, Israel) and anti-β-Actin-Peroxidase (#A385416, 1:1,000 in TBST 5% BSA 0.02% sodium azide; Merck KGaA, Darmstadt, Germany) antibodies. Membranes were then washed with TBST and incubated with the appropriate HPR–conjugated antibody (anti-rabbit HRP #31460, 1:2,000 in TBST 5% BSA; Thermo Fisher Scientific, Waltham, MA, United States). Differences in protein expression was evaluated by using Fiji (ImageJ software).
2.5 ImmunofluorescenceCells were cultured on Collagen Type I (#C3867, Merck KGaA, Darmstadt, Germany) coated glass coverslips and used after 80%–90% confluency. Cells were washed and then incubated with LysoTracker™ Red DND-99 (#L7528, 50 nM; Thermo Fisher Scientific, Waltham, MA, United States) for 1 h. After incubation, cells were washed twice with Hanks’ Balanced Salt Solution (HBSS), fixed in 4% paraformaldehyde at room temperature for 10 min and permeabilized with 0.1% Triton X-100 in PBS for 10 min. Cells were then blocked with 1% BSA in PBS and incubated overnight at 4 °C with the following primary antibodies: anti-TRPML1 (#ACC-081; Alomone Labs, Jerusalem, Israel) 1:200 in TBST 1% BSA; anti-LAMP1 (#ab25630, Abcam, Cambridge, United Kingdom) 1:100 in TBST 5% BSA. Bound antibodies were detected with Alexa Fluor secondary antibodies (#A11008, #A21235, 1:500, Alexa FluorTM 488; Thermo Fisher Scientific, Waltham, MA, United States). Images were collected on a Leica SP8 Confocal scanning microscope using oil immersion 60x (HC PL APO 63x/1.40 OIL CS2 UV, Leica, Wetzlar, Germany) objectives.
2.6 Gene silencingGenetic deletion of MCOLN1, which encodes for TRPML1, was carried by using a similar approach to that described in (Mussano et al., 2020; Negri et al., 2020). Cells were transiently transfected with the esiRNA targeting TRPML1 (EHU062561, MISSION® esiRNA, 100 nM final concentration) purchased from Merck (Merck KGaA, Darmstadt, Germany) by using the Lipofectamine™ RNAiMAX Transfection Reagent (Thermo Fisher Scientific, Waltham, MA, United States) protocol in Opti-MEM™ I Reduced Serum Medium (Thermo Fisher Scientific, Waltham, MA, United States), according to manufacturer’s instructions. 4 h after transfection, the esiRNA-Lipofectamin complex was eliminated and fresh culture media containing 5% FBS was added to the cells. Cells were then kept in incubator at 37°C and 5% CO2 and allowed to grow according to the protocol to be used. The effectiveness of silencing was determined by immunoblotting and the silenced hCMEC/D3 cells were used 48 h after transfection. The Trypan blue exclusion assay confirmed that the genetic silencing of TRPML1 did not affect hCMEC/D3 cell viability (Supplementary Figure S1).
2.7 StatisticsAll the data have been obtained from at least three independent experiments on hCMEC/D3 cells. The peak amplitude of agonist-evoked Ca2+ signals was measured as the difference between the ratio (F340/F380) at the Ca2+ peak and the mean ratio of 30 s baseline before the peak.
Data were analyzed with GraphPad Prism 7 (GraphPad Software, Inc., La Jolla, CA, United States). Preliminary Shapiro-Wilk test was performed to check the normal distributions of each dataset: accordingly, statistical analysis was performed by using either the non-parametric tests (Mann-Whitney test or Kruskal–Wallis test) or parametric tests (Student’s t-test or one-way ANOVA test). A p-value of <0.05 was considered significant.
2.8 ChemicalsML-SAI (# SML0627), ML-SI3 (GW405833 hydrochloride; # G1421), CPA (Ciclo piazonic acid; # C1530), 2-APB (# D9754), BTP-2 (# 203890 CRAC channel inhibitor BTP2), Pyr6 (# SML1241), were purchased from Merck GKaA (Darmstadt, Germany). BAPTA/AM (#196419) and L-NIO (L-N⁵-1-Iminoethyl ornithine, Dihydrochloride; # 400600) were purchased from Merck Millipore (Burlington, Massachusetts, United States). Nigericin sodium salt (# 4,312) was purchased from Tocris Bioscience (Bristol, United Kingdom). PI(3,5)P2 diC8) (#P-3508) was purchased from Echelon Biosciences Inc. (Salt Lake City, United States). All other chemicals were of analytical grade and purchased from Sigma Chemical Co. (Milan, Italy).
3 Results3.1 Lysosomal TRPML1 is expressed in hCMEC/D3 cellsThe synthetic agonist, ML-SAI, has been widely used to evaluate the functional expression of functional TRPML1 channels in a variety of cell lines (Kilpatrick et al., 2016; Thakore et al., 2020; Tedeschi et al., 2021; Boretto et al., 2023; Scorza et al., 2023). In hCMEC/D3 cells loaded with the ratiometric Ca2+-sensitive fluorophore, Fura-2, ML-SAI induced a dose-dependent increase in [Ca2+]i that was evident at concentrations ≥10 µM (Figure 1A). At 10–50 μM, ML-SA1 caused a slow but transient increase in [Ca2+]i that started with some delay after the application of the agonist (Figure 1A). Higher concentrations of ML-SA1 (100 μM and 200 µM) induced a biphasic Ca2+ signal following the slow increase in [Ca2+]i and representing a rapid Ca2+ peak followed by a sustained plateau level (Figure 1A). The amplitude of the Ca2+ response to increasing concentrations of ML-SA1 has been reported in Figure 1B. Immunofluorescence showed that punctate vesicular structures could be detected in hCMEC/D3 cells stained with the lysosomal marker LAMP-1 (Supplementary Figure S2A) and Lysotracker Red (Supplementary Figure S2B), a red fluorescent weak base that is selective for acidic organelles (Faris et al., 2019; Scorza et al., 2023). Consistent with this, nigericin (50 µM), a H+/K+ ionophore that alkalinizes the lysosomal pH (Morgan et al., 2011; Riva et al., 2018; Morgan and Galione, 2021), erased Lysotracker Red fluorescence (Supplementary Figure S2C), confirming that it selectively labels lysosomal vesicles. Co-immunofluorescence analysis showed that both Lysotracker Red and a TRPML1 specific antibody exhibited a similar punctate distribution throughout the cells (Figure 1C). Finally, immunoblotting with a TRPML1-specific antibody detected a major band of ∼75 kDa (Figure 1D), which is the predictive molecular weight for the TRPML1 protein (Tedeschi et al., 2021). Taken together, these findings show that the lysosomal TRPML1 is expressed and triggers global Ca2+ signals in hCMEC/D3 cells.
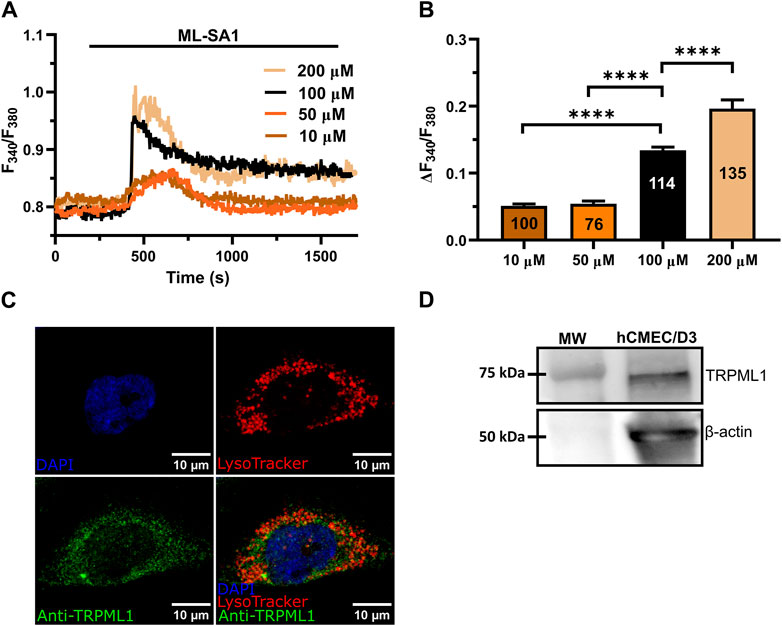
Figure 1. ML-SA1 evokes a dose-dependent increase in [Ca2+]i in hCMEC/D3 cells. (A) Intracellular Ca2+ signals evoked by increasing concentration of ML-SA1 in hCMEC/D3 cells. (B) Mean ± SEM of the peak amplitude of ML-SA1-induced Ca2+ responses in hCMEC/D3 cells at different agonist concentrations. **** indicates p < 0.0001 (Student’s t-test and Mann-Whitney test). (C) Confocal fluorescence images of hCMEC/D3 cells loaded with LysoTracker-Red DND-99 (red) to mark acidic organelles and stained with an antibody against TRPML1 antibody (green). Nuclei were stained using DAPI (blue). Scale bar: 10 µm. (D) Representative western blotting analysis of TRPML1 on hCMEC/D3 cells lysates. Major bands of the expected molecular weights (MW) for TRPML1 (75 kDa) and the loading control protein β-actin (50 kDa) is indicated.
3.2 TRPML1-mediated global Ca2+ signals are sustained by lysosomal Ca2+ release and extracellular Ca2+ entryRecent studies have shown that the global Ca2+ response to TRPML1 activation involves both lysosomal Ca2+ release and extracellular Ca2+ entry across the plasma membrane (Kilpatrick et al., 2016; Tedeschi et al., 2021). The long-lasting plateau phase of the Ca2+ responses illustrated in Figure 1A suggests that ML-SA1 at concentrations higher than 50 μM may also activate a Ca2+ entry pathway in hCMEC/D3 cells. Consistent with this hypothesis, in the absence of extracellular Ca2+ (0Ca2+), 100 μM ML-SA1 induced a transient increase in [Ca2+]i whose amplitude was significantly (p < 0.05) smaller as compared to the amplitude of the Ca2+ response recorded in the presence of extracellular Ca2+ (Figures 2A,B). Restoration of extracellular Ca2+ 300 s after the removal of ML-SA1 induced a prompt increase in [Ca2+]i that was obviously independent of the presence of the agonist in the bath (Figure 2C). As discussed in (Morgan et al., 2011; Garrity et al., 2016; Faris et al., 2019; Lloyd-Evans and Waller-Evans, 2019; Moccia et al., 2021b), depletion of the lysosomal Ca2+ pool with nigericin has long been used as a pharmacological approach to confirm that ML-SA1 and NAADP mobilize the lysosomal Ca2+ store. Consistent with this, the application of nigericin (50 µM) under 0Ca2+ conditions induced a transient increase in [Ca2+]i reflecting the depletion of the lysosomal Ca2+ content (Figure 2D). The subsequent application of 100 μM ML-SA1 failed to induce a discernible Ca2+ response in hCMEC/D3 cells (Figures 2D,F). In addition, ML-SA1-induced intracellular Ca2+ release was abolished by ML-SI3 (10 µM) (Figures 2E,F), a specific TRPML1 antagonist (Wang et al., 2015; Kilpatrick et al., 2016; Boretto et al., 2023), and by the genetic deletion of TRPML1 with a selective small interfering RNA (siTRPML1) (Figures 2E,F). The efficacy of the siTRPML1-mediated reduction in TRPML1 protein expression has been illustrated in Figures 2G,H. Taken together, these findings show that TRPML1-mediated global Ca2+ signals are triggered by lysosomal Ca2+ release and sustained by extracellular Ca2+ entry.
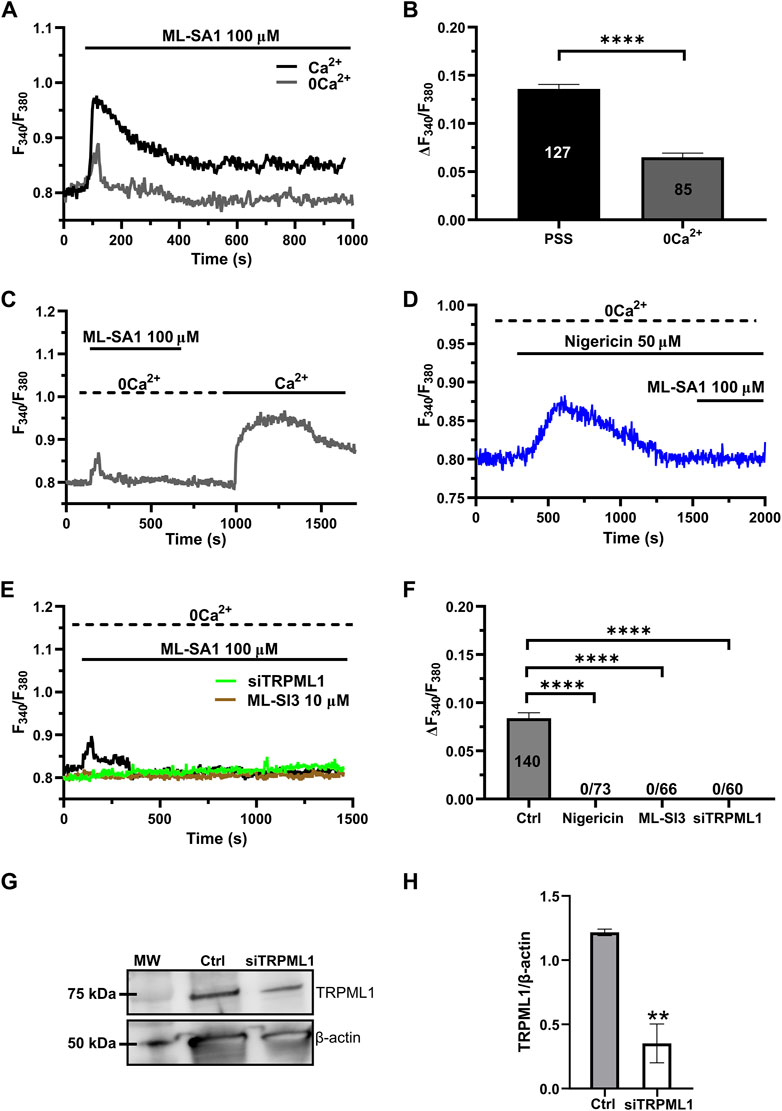
Figure 2. Lysosomal Ca2+ release and extracellular Ca2+ entry sustain TRPML-mediated Ca2+ signals hCMEC/D3 cells. (A) ML-SA1 induced a small transient increase in [Ca2+]i in the absence of extracellular Ca2+. (B) Mean ± SEM of the peak amplitude of the TRPML1-induced Ca2+ responses in presence and absence of extracellular Ca2+. **** indicates p < 0.0001 (Student’s t-test). (C) Restoration of extracellular Ca2+ upon removal of the agonist resulted in a second bump in [Ca2+]i, which was indicative of SOCE. (D) Pre-incubation with nigericin (50 μM, 20 min) under 0Ca2+ conditions, induced a transient increase in [Ca2+]i, reflecting the depletion of the Ca2+ store. The subsequent application of ML-SA1 failed to induce a significant Ca2+ response in hCMEC/D3 cells. (E) Pharmacological (ML-SI3; 10 μM, 20 min) and genetic (siTRPML1) inhibition of TRPML1, totally abolished the Ca2+ response under 0Ca2+ condition. (F) Mean ± SEM of the amplitude of Ca2+ responses in cells under the designated treatments. **** indicates p < 0.0001 (Kruskal–Wallis one-way Anova test followed by Dunn’s post hoc test). (G) Representative western blotting analysis of the TRPML1 protein expressed in hCMEC/D3 (Ctrl) and hCMEC/D3 transfected with the specific siTRPML1 (siTRPML1). Major bands of the expected molecular weights (MW) for TRPML1 (75 kDa) and the loading control protein β-actin (50 kDa) is indicated. (H) Mean ± SEM of the TRPML1/β-actin ratio expression of four independent western blotting experiments. ** indicates p < 0.005 (Student’s t-test).
3.3 ER Ca2+ release through InsP3Rs and SOCE contribute to TRPML1-mediated global Ca2+ signals in hCMEC/D3 cellsThe ER is the major Ca2+ store that may amplify spatially restricted lysosomal Ca2+ microdomains into global increases in [Ca2+]i (Morgan, 2016; Moccia et al., 2023c; Galione et al., 2023). Furthermore, the evidence mentioned previously that ML-SA1-induced extracellular Ca2+ entry may occur even in the absence of the agonist of the bath is reminiscent of SOCE activation (Murata et al., 2007; Bird et al., 2008; Moccia et al., 2023a), further confirming the contribution of the ER Ca2+ store between the initial event of lysosomal Ca2+ release and the subsequent influx of Ca2+. Consistent with this, the intracellular Ca2+ response to 100 μM ML-SA1 was significantly (p < 0.05) reduced by the prior incubation with cyclopiazonic acid (CPA; 20 µM) under 0Ca2+ conditions to deplete the ER Ca2+ store (Figure 3A) and by 2-aminoethoxy diphenyl borate (2-APB; 50 µM) (Figure 3B), a reliable InsP3R blocker in the absence of extracellular Ca2+ (Pafumi et al., 2015). The inhibitory effect of CPA and 2-APB on ML-SA1-induced intracellular Ca2+ release has been illustrated in Figure 3C hCMEC/D3 cells do not express RyRs (Zuccolo et al., 2019b) and, therefore, we did not assess their contribution to ML-SA1-induced intracellular Ca2+ release. SOCE is the main pathway that sustains Ca2+ entry during ER Ca2+ release events through InsP3Rs in vascular endothelial cells (Blatter, 2017; Groschner et al., 2017; Moccia et al., 2023a), including hCMEC/D3 cells (Berra-Romani et al., 2020; Negri et al., 2020; Negri et al., 2021a; Negri et al., 2022). Consistent with this, 100 μM ML-SA1 induced a transient and tiny Ca2+ response in the presence of 20 µM BTP-2 (Figures 3D,E) or 10 µM Pyr6 (Figures 3D,E), which are two established blockers of Orai1 (Schleifer et al., 2012; Chauvet et al., 2016; Zuccolo et al., 2016; Zhang et al., 2020), which serves as store-operated Ca2+ channel in hCMEC/D3 cells (Zuccolo et al., 2019b; Negri et al., 2020). However, TRPML1 can directly mediate Ca2+ entry across the plasma membrane (Kilpatrick et al., 2016). TRPML1 is also permeable to Fe2+, which causes a significant quench in Fura-2 fluorescence when it enters the cytosol (Kilpatrick et al., 2016). Therefore, hCMEC/D3 cells were challenged with FeCl2 (1 mM) under 0Ca2+ conditions after stimulation with ML-SA1 (100 μM), as shown in (Kilpatrick et al., 2016). Supplementary Figure S3 shows that FeCl2 did not induce any detectable quench in Fura-2 fluorescence, thereby suggesting TRPML1 does not directly contribute to ML-SA1-evoked Ca2+ entry. Taken together, these findings demonstrate that TRPML1-mediated global Ca2+ signals in hCMEC/D3 cells are supported by ER Ca2+ release through InsP3Rs and by SOCE activation.
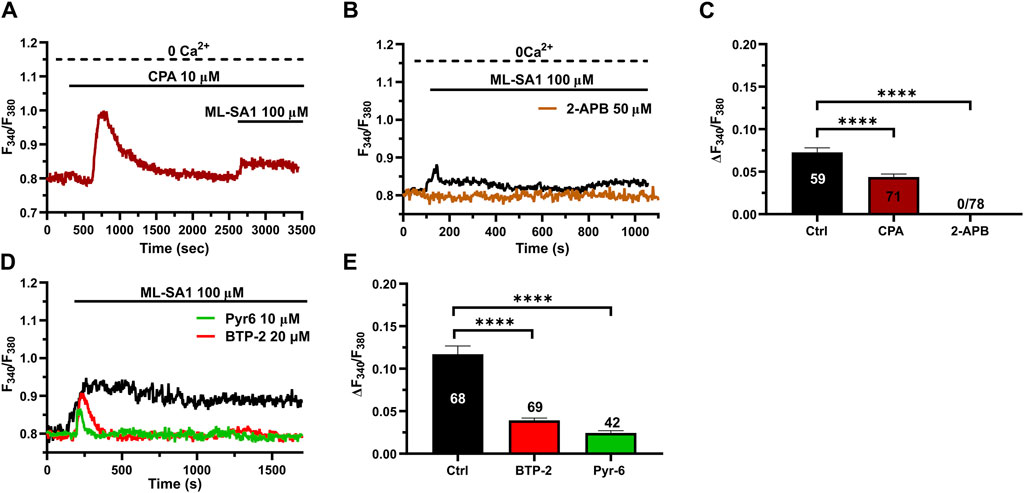
Figure 3. ER Ca2+ release and SOCE contribute to the TRPML1-mediated Ca2+ signals in hCMEC/D3 cells. (A, B) pre-incubation with CPA (10 μM, 30 min) or 2-APB (50 μM, 30 min) significantly reduced the ML-SA1-induced Ca2+ response under 0Ca2+ conditions. (C) Mean ± SEM of the amplitude of the Ca2+ responses in cells under the designated treatments. **** indicates p < 0.0001 (Kruskal–Wallis one-way Anova test followed by Dunn’s post hoc test). (D) The Orai1 blockers, BTP-2 (20 μM, 20 min) and Pyr6 (20 μM, 20 min), reduced the ML-SA1-evoked Ca2+ response. (E) Mean ± SEM of the amplitude of Ca2+ responses in cells under the designated treatments. Each drug totally inhibited the Ca2+ response. **** indicates p < 0.0001 (Kruskal–Wallis one-way Anova test followed by the Dunn’s post hoc test).
3.4 TRPML1 regulates ER Ca2+ load in hCMEC/D3 cellsTRPML1 could promote ER Ca2+ release by directly activating the juxtaposed InsP3Rs via Ca2+-induced Ca2+ release (CICR) (Thakore et al., 2020) or by loading the ER with Ca2+ in a SERCA-dependent manner, thereby activating InsP3Rs via the ER Ca2+ overload (Macgregor et al., 2007; PMID: 17387177). A recent study showed that TRPML1 regulates the ER Ca2+ content in primary rat cortical neurons (Tedeschi et al., 2021). Therefore, we reasoned that, if TRPML1 did the same in hCMEC/D3 cells, CPA-evoked ER Ca2+ release would be impaired by interfering with TRPML1-mediated Ca2+ mobilization. In agreement with this hypothesis, the ER Ca2+ response to CPA (20 μM) was significantly (p < 0.05) reduced by blocking TRPML1 with either ML-SI3 (10 µM) (Figure 5A) or the siTRPML1 (Figure 4A). The statistical analysis of these experiments has been illustrated in Figure 4B. Collectively, these findings strongly suggests that TRPML1-mediated lysosomal Ca2+ release leads to an increase in ER Ca2+ content, which is decreased upon its inhibition. Therefore, we conclude that TRPML1 may mediate ER Ca2+ content and lead to InsP3 activation upon an increase in luminal Ca2+ (Missiaen et al., 1992).
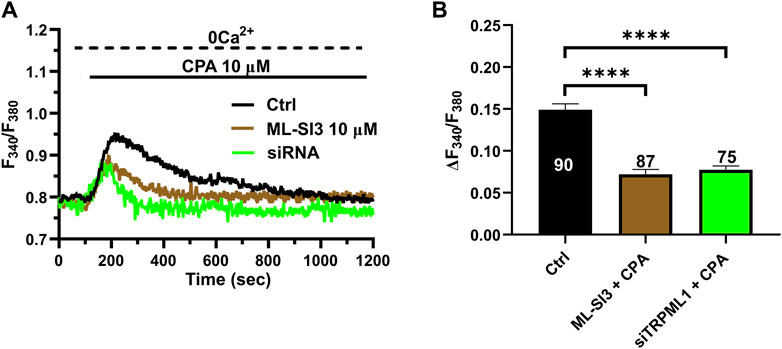
Figure 4. The inhibition of TRPML1 reduces ER Ca2+ release. (A) The transient Ca2+ response induced by CPA (10 µM) under 0 Ca2+ conditions is strongly reduced in the presence of ML-SI3 (10 μM, 20 min) and in hCMEC/D3 cells transfected with the selective siTRPML1. (B) Mean ± SEM of the amplitude of the Ca2+ responses in cells under the designated treatments. **** indicates p < 0.0001 (Kruskal–Wallis one-way Anova test followed by the Dunn’s post hoc test).
3.5 TRPML1 mediates PI(3,5)P2-evoked Ca2+ signals in hCMEC/D3 cellsThe lysosomal phosphoinositide PI(3,5)P2 is regarded as a putative endogenous ligand of TRPML1 (Dong et al., 2010; Zhang et al., 2012; Isobe et al., 2019; Li et al., 2019; Negri et al., 2021b). In order to assess whether PI(3,5)P2 was also able to induce TRPML1-mediated global Ca2+ signals in hCMEC/D3 cells, we challenged the cells with PI(3,5)P2 diC8, a cell-permeable analog of PI(3,5)P2 (Tedeschi et al., 2021). 10 μM PI(3,5)P2 diC8 induced a slowly rising, but long-lasting increase in [Ca2+]i (Figure 5A). The Ca2+ add-back protocol confirmed that, under 0Ca2+ conditions, 10 µM PI(3,5)P2 diC8 induced a transient increase in [Ca2+]i that was followed by a second elevation in [Ca2+]i upon restoring extracellular Ca2+ in the absence of the agonist (Figure 5B). As described above for ML-SA1, previous depletion of the lysosomal Ca2+ store with nigericin (50 µM) abolished PI(3,5)P2 diC8-induced intracellular Ca2+ release in the absence of extracellular Ca2+ (0Ca2+) (Figure 5C). Furthermore, the intracellular Ca2+ response to PI(3,5)P2 diC8 was significantly (p < 0.05) reduced by both ML-SI3 (10 μM; Figure 5D) and by the selective siTRPML1 (Figure 5D). The inhibitory effect of nigericin, ML-SI3, and siTRPML1 on PI(3,5)P2 diC8-induced intracellular Ca2+ release has been illustrated in Figure 5E. Collectively, these findings provide the evidence that PI(3,5P)2 may also serve as an endogenous agonist of TRPML1 in hCMEC/D3 cells.
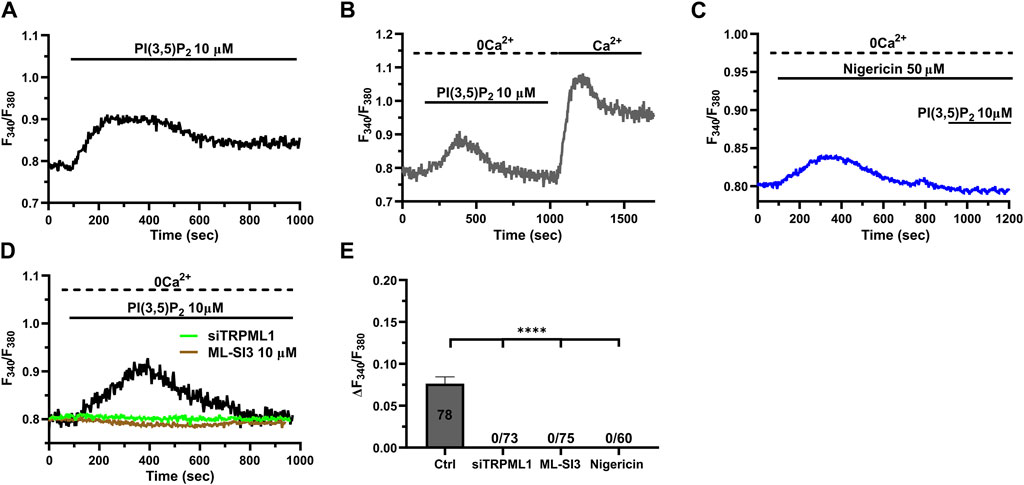
Figure 5. The endogenous ligand PI(3,5)P2 mimics the Ca2+ response to ML-SA1. (A) 10 µM PI(3,5)P2 induced a long-lasting increase in [Ca2+]i, mimicking the ML-SA1-evoked Ca2+ response. (B) Restoration of extracellular Ca2+ upon removal of the agonist PI(3,5)P2 resulted in a second bump in [Ca2+]i, which was indicative of SOCE. (C) Depletion of lysosomal Ca2+ stores with 50 µM nigericin abolished the PI(3,5)P2 –induced Ca2+ response. (D). Pharmacological (ML-SI3; 10 μM, 20 min) and genetic (siTRPML1) inhibition of TRPML1 totally abolished the PI(3,5)P2 –induced Ca2+ response, in absence and presence of extracellular Ca2+. (E) Mean ± SEM of the amplitude of Ca2+ responses in the absence of extracellular Ca2+ (0Ca2+) under the designated treatments. Each drug totally inhibited the Ca2+ response. **** indicates p < 0.0001 (Kruskal–Wallis one-way Anova test followed by the Dunn’s post hoc test).
3.6 TRPML1-mediated global Ca2+ signals lead to NO release in hCMEC/D3 cellsRecent studies have shown that a global increase in [Ca2+]i can result in robust NO release from hCMEC/D3 cells (Berra-Romani et al., 2020; Negri et al., 2020; Negri et al., 2022; Berra-Romani et al., 2023). In order to assess whether TRPML1-mediated global Ca2+ signals could also induce NO production, we loaded hCMEC/D3 cells with the NO-sensitive fluorophore, DAF-FM DA. We found that 100 μM ML-SA1 induced a slow, but sustained increase in DAF-FM fluorescence (Figure 6A), which was indicative of NO release (Sheng et al., 2005; Sheng and Braun, 2007; Greenberg et al., 2017; Berra-Romani et al., 2020; Negri et al., 2020; Negri et al., 2022; Berra-Romani et al., 2023). ML-SAI-induced NO release was significantly inhibited by BAPTA-AM (20 μM; Figure 6A), a membrane permeable buffer of intracellular Ca2+ levels, and by L-NIO (50 μM; Figure 6A), a specific eNOS inhibitor. The inhibitory effect of BAPTA and L-NIO on ML-SA1-induced NO release has been illustrated in Figure 5C. Moreover, ML-SI3 (10 µM) and siTRPML1 significantly (p < 0.05) inhibited ML-SA1-induced NO release (Figures 6B,C). Therefore, the lysosomal TRPML1 is able to trigger massive NO production in the human cerebrovascular endothelial cell line, hCMEC/D3.
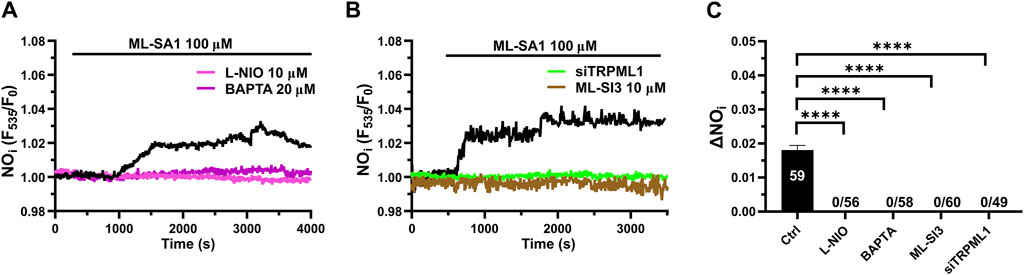
Figure 6. TRPML1 induces Ca2+-dependent NO release in hCMEC/D3 cells. (A) 100 μM ML-SA1 evoked a slow, but sustained increase in DAF-FM fluorescence, which reflected NO release and was inhibited by L-NIO (10 μM, 1 h) and BAPTA-AM (20 μM, 2 h). (B) Pharmacological (ML-SI3; 10 μM, 20 min) and genetic (siTRPML1) inhibition of TRPML1, significantly abolished the ML-SA1-induced NO response. (C) Mean ± SEM of the amplitude of NO responses in presence of extracellular Ca2+. **** indicates p < 0.0001 (Kruskal–Wallis one-way Anova test followed by the Dunn’s post hoc test).
3.7 TRPML1 supports ATP-induced Ca2+ signaling and NO release in hCMEC/D3 cellsThe evidence that lysosomal Ca2+ release through TRPML1 controls ER Ca2+ release and induce InsP3R-mediated Ca2+ signaling strongly suggests that TRPML1 may support agonist-induced Ca2+ signals and NO release in hCMEC/D3 cells. ATP has long been the most widely exploited agonist to stimulate endothelial Ca2+ signals along the vascular tree (Scarpellino et al., 2019; Scarpellino et al., 2022; Lisec et al., 2024). ATP activates the Gq-coupled P2Y2 receptors to elicit InsP3-induced ER Ca2+ release in hCMEC/D3 cells (Bintig et al., 2012; Forcaia et al., 2021). A recent study showed that ATP-induced Ca2+ signaling is primarily mediated by intracellular Ca2+ release in hCMEC/D3 cells (Bintig et al., 2012). Herein, we found that ATP (100 μM) evoked a transient increase in [Ca2+]i that was significantly (p < 0.05) reduced by ML-SI3 (10 µM) (Figure 7A) and siTRPML1 (Figure 7A). We then assessed whether the pharmacological blockade of PYKfive, which is part of the lipid kinase complex that synthetizes PI(3,5)P2, with the selective inhibitor, apilimod (Somogyi et al., 2023), affected ATP-induced ER Ca2+ release. Apilimod (100 nM) significantly (p < 0.05) reduced ATP-induced ER Ca2+ release in hCMEC/D3 cells (Figure 7A), while it did not activate per se any increase in [Ca2+]i, as reported in (Hou et al., 2023). The inhibitory effect of ML-SI3, siTRPML1, and apilimod on the intracellular Ca2+ response to ATP has been illustrated in Figure 7B. Furthermore, both the pharmacological and genetic blockade of TRPML1-mediated lysosomal Ca2+ release with, respectively, ML-SI3 (10 µM) (Figures 7C,D) and the siTRPML1 (Figures 7C,D), significantly reduced ATP-induced NO release in hCMEC/D3 cells loaded with DAF-DM. Overall, these findings indicate that TRPML1, either indirectly (by refilling the ER Ca2+ pool) or directly (by activating the ER-embedded InsP3Rs via the luminal Ca2+ overload) can support agonist-induced endothelial Ca2+ signaling at the neurovascular unit.

Figure 7. TRPML1 mediates ATP-induced intracellular Ca2+ release and NO production. (A) The Ca2+ response to ATP (100 μM) under 0 Ca2+ conditions was strongly reduced in the presence of ML-SI3 (10 μM, 20 min) or apilimod (100 nM, 20 min) and in hCMEC/D3 cells transfected with the selective siTRPML1. (B) Mean ± SEM of the amplitude of the Ca2+ responses in cells under the designated treatments. **** indicates p < 0.0001 (Kruskal–Wallis one-way Anova test followed by Dunn’s post hoc test). (C). ATP (100 μM) induced a sustained increase in DAF-DM fluorescence, which reflected NO release and was inhibited in the presence of ML-SI3 (10 μM, 20 min) and in hCMEC/D3 cells transfected with the selective siTRPML1. (D) Mean ± SEM of the amplitude of the Ca2+ responses in cells under the designated treatments. **** indicates p < 0.0001 (Kruskal–Wallis one-way Anova test followed by the Dunn’s post hoc test).
4 DiscussionIn the present investigation, we showed that the lysosomal TRPML1 can trigger global Ca2+ signals, involving both Ca2+ release and Ca2+ entry, in human cerebrovascular endothelial cells, as recently shown for HeLa cells and primary cultured human skin fibroblasts (Kilpatrick et al., 2016), rat primary cortical neurons (Tedeschi et al., 2021), and MDA-MB-231 breast cancer cells (Boretto et al., 2023). We further showed that TRPML1-mediated global Ca2+ signals lead to robust NO production, which is not only a recognized proxy for endothelial Ca2+ signaling, but also a critical vasorelaxing pathway in brain microcirculation. Therefore, the endothelial TRPML1 channel stands out as a novel component of the Ca2+ toolkit at the neurovascular unit that could be involved in the regulation of CBF during neuronal activity (Negri et al., 2021c; Longden et al., 2021; Moccia et al., 2022; Mughal et al., 2024). In agreement with this hypothesis, we showed that TRPML1 supports ATP-induced intracellular Ca2+ release and NO production in hCMEC/D3 cells.
Lysosomal Ca2+ signaling is emerging as an additional regulator of endothelial Ca2+ dynamics (Moccia et al., 2021a; Negri et al., 2021b). The lysosomal agonist, nicotinic acid adenine dinucleotide phosphate (NAADP), has been shown to gate endothelial TPCs to regulate mean arterial pressure via NO release (Brailoiu et al., 2010), to stimulate angiogenesis (Favia et al., 2014), von Willebrand factor release (Esposito et al., 2011), and vasculogenesis (Di Nezza et al., 2017; Moccia et al., 2021b). In addition, NAADP-induced lysosomal Ca2+ release may interact with InsP3-induced ER Ca2+ mobilization to shape the Ca2+ signal and thereby increase eNOS activity in the human cerebrovascular endothelial cell line, hCMEC/D3, employed in the present investigation (Berra-Romani et al., 2020; Negri et al., 2020; Negri et al., 2021a; Negri et al., 2022). The endothelial role of TRPML1 is less known. A recent study has shown that TRPML1 can increase the interaction between lysosomes and multivesicular bodies in mouse coronary artery endothelial cells, which results in reduced exosome release (Li et al., 2022). The application of low concentrations of ML-SA1 (10 μM), a TRPML1 synthetic agonist, induced a spatially-restricted lysosomal Ca2+ signal, as revealed by a GCaMP3-ML1 construct that was designed by expressing the genetic Ca2+-indicator, GCaMP3, on the cytoplasmic NH2-tail of TRPML1 (Li et al., 2022). Herein, we assessed whether TRPML1 was expressed and able to induce global Ca2+ signals in the human cerebrovascular endothelial cell line, hCMEC/D3, as cytosolic Ca2+ signals are believed to play a crucial role in endothelium-dependent NO release and CBF regulation at the neurovascular unit (Negri et al., 2021c; Kuppusamy et al., 2021; Longden et al., 2021; Thakore et al., 2021; Moccia et al., 2022; Peters et al., 2022; Mughal et al., 2024).
ML-SA1 induced a dose-dependent global Ca2+ signal consisting of a slow rise in [Ca2+]i that leads to rapid Ca2+ upstroke followed by a plateau-like phase slightly above the baseline. This long-lasting increase in [Ca2+]i was evident at concentrations of ML-SA1 ≥ 50 µM. Immunofluorescence and immunoblotting confirmed that the TRPML1 protein was expressed in acidic lysosomal vesicles that were widely distributed throughout the cytosol. These findings demonstrate that the endothelial TRPML1 channel is not only expressed in coronary, but also in brain circulation. Lysosomal-derived Ca2+ signals can be amplified into a global increase in [Ca2+]i by the recruitment of ER-embedded InsP3Rs via the CICR process (Kilpatrick et al., 2013; Penny et al., 2014; Kilpatrick et al., 2016; Galione et al., 2023). An additional pathway that could be activated upon the NAADP-triggered depletion of the InsP3-sensitive ER Ca2+ store is SOCE, as reported in human cardiac mesenchymal stromal cells (Faris et al., 2022) and MDA-MB-231 cells (Boretto et al., 2023), but not ECFCs (Moccia et al., 2021b) and metastatic colorectal cancer cells (Faris et al., 2019). Furthermore, extracellular Ca2+ entry through TRPML1 channels that are located on the plasma membrane can support lysosomal Ca2+ mobilization (Kilpatrick et al., 2016). Consistently, in the absence of extracellular Ca2+, ML-SA1 evoked a tiny and transient increase in [Ca2+]i in hCMEC/D3 cells, which is similar to that recorded under the same conditions in HeLa cells (Kilpatrick et al., 2016). This finding supports the emerging notion that ML-SA1 can induce both intracellular Ca2+ release and extracellular Ca2+ entry (Kilpatrick et al., 2016; Tedeschi et al., 2021). The intracellular Ca2+ response to ML-SA1 was abolished by depleting the lysosomal Ca2+ pool and by the pharmacological or genetic blockade of TRPML1. These findings confirm that TRPML1 activation can also result in lysosomal Ca2+ mobilization in human cerebrovascular endothelial cells. We must point out that the tiny Ca2+ response evoked by ML-SA1 under 0Ca2+ conditions was almost suppressed despite the 60% reduction in TRPML1 protein expression achieved by the specific siTRPML1 used in the present study. The following mechanisms could explain these seemingly contradictory results. First, the remaining TRPML1 protein (≈40%) is not expressed in the acidic vesicle membranes and, therefore, cannot contribute to the Ca2+ signal. Second, our epifluorescence imaging system does not detect subcellular Ca2+ signals, as already reported in (Moccia et al., 2019). Thus, we cannot rule out that some TRPML1-mediated local Ca2+ release events still occurred but were not detected. This hypothesis would be further consistent with the evidence that, although lysosomes contain ≈500 µM free Ca2+, they occupy ≈3% of the total endothelial cell volume and are sparse throughout the cytoplasm (Lloyd-Evans and Waller-Evans, 2019). Thus, reducing TRPML1 protein expression by 60% could result in discrete subcellular Ca2+ signals that can be recorded only with confocal or 2-photon microscopy (Boittin et al., 2002; Kinnear et al., 2008), especially if they are uncoupled from the ER, as further discussed below. For instance, Kinnear et al. revealed that NAADP elicited subcellular Ca2+ signals that did not significantly increase Fura-2 fluorescence until they led to ER Ca2+ release in rat pulmonary artery vascular smooth muscle cells (Kinnear et al., 2008). In agreement with these hypotheses, we have recently shown that the lysosomal Ca2+ response to NAADP is virtually abolished in circulating endothelial colony forming cells transfected with a siRNA selectively targeting TPC1 despite the fact the TPC1 protein expression is downregulated by ≈ 60% (Moccia et al., 2021b). Therefore, we are confident that the overall evidence based upon the pharmacological and genetic blockade of TRPML1 supports its primary role in the Ca2+-response to ML-SA1.
ML-SA1-induced intracellular Ca2+ mobilization was also attenuated or virtually abolished by depleting the ER Ca2+ store and by blocking InsP3Rs. These findings are consistent with those reported in HeLa cells (Kilpatrick et al., 2016) and indicate that InsP3Rs sustain the lysosomal Ca2+ signal in hCMEC/D3 cells. Therefore, the absence of a regenerative Ca2+ response at low concentrations of ML-SA1 (<50 µM) can be explained by the failure of spatially-restricted lysosomal Ca2+ nanodomains to fully recruit the juxtaposed InsP3Rs (Medina et al., 2015; Davis et al., 2023). On the other hand, an increase in the amount of lysosomal Ca2+ mobilized by higher concentrations of ML-SA1 (>50 µM) could successfully trigger ER Ca2+ release through InsP3Rs. Lysosomal Ca2+ release could mobilize the ER Ca2+ pool by either triggering CICR through RyRs/InsP3Rs (Yuan et al., 2024; Yuan et al., 2024) or by refilling the ER in a SERCA-dependent manner, thereby leading to luminal Ca2+ overload and InsP3R/RyR opening (Macgregor et al., 2007). A recent investigation revealed that TRPML1-mediated lysosomal Ca2+ release tonically regulates the ER Ca2+ content in primary rat cortical neurons (Tedeschi et al., 2021). Herein, we found that CPA-evoked ER Ca2+ release, which can be used as a proxy for the free ER Ca2+ concentration (Brandman et al., 2007; Pierro et al., 2014; Lodola et al., 2017), was significantly reduced upon the pharmacological (with ML-SI3) or genetic (with the specific siTRPML1) blockade of TRPML1. This finding strongly suggests that local TRPML1-mediated Ca2+ signals are rerouted into the ER in a SERCA-dependent manner, thereby controlling the free ER Ca2+ concentration that is available to be released through the ER leakage channels and/or the InsP3R. Therefore, it is reasonable to conclude that ML-SA1 gates TRPML1, which is likely to lead to ER Ca2+ overload and InsP3R activation from the luminal side. Consistent with this hypothesis, the pharmacological blockade of SOCE with two distinct pyrazole derivatives, Pyr6 and BTP-2, converted the global increase in [Ca2+]i induced by ML-SA1 into a tiny Ca2+ transient that strongly resembled that measured under 0Ca2+ conditions. In addition, the “Ca2+ add-back” protocol revealed that TRPML1-dependent Ca2+ entry did not require the presence of the extracellular agonist to occur, while it was only associated with the previous depletion of the intracellular Ca2+ pool. This feature is a hallmark of SOCE activation, which confirms that TRPML1 leads to ER Ca2+ depletion (Murata et al., 2007; Bird et al., 2008; Moc
留言 (0)