
記住我


The human protein tyrosine phosphatase proteome (PTPome) comprises about 125 proteins (Alonso et al., 2004; Alonso and Pulido, 2016), encoded by 39 genes. Of these 39 genes, 17 encode cytosolic or non-transmembrane (PTPN) proteins and 22 encode receptor (PTPR) or transmembrane proteins (Alonso et al., 2004; Lee et al., 2015; Alonso and Pulido, 2016). The protein tyrosine phosphatases (PTPs) are implicated in the regulation of gene transcription, mRNA processing, control of mitosis, cell differentiation, cell growth, and receptor-mediated endocytosis, as well as in sensing the extracellular CO2/HCO3− concentrations (Tonks, 2013; Zhou et al., 2016; Young et al., 2021; Zhang et al., 2023). Abnormalities in PTPs play an important role in the pathogenesis of numerous diseases, from cancer to immune deficiency (He et al., 2014). The loss of function of certain PTPs, such as PTPN13 (Mcheik et al., 2020), PTEN (González-García et al., 2022), PTPRD (Szaumkessel et al., 2017), and the receptor protein tyrosine phosphatases γ (RPTPγ or PTPRG) and ζ (RPTPζ or PTPRZ), can contribute to cancer progression (Boni and Sorio, 2021; Sloth et al., 2022).
RPTPγ and RPTPζ comprise the R5 (or class V) PTP subfamily (Alonso et al., 2004), which is distinguished by (a) an amino-terminal (Nt) extracellular carbonic anhydrase–like domain (CALD) that sequentially links to (b) a single extracellular fibronectin III (FNIII) domain, (c) a transmembrane (TM) domain, (d) the D1 PTPase domain, (e) the D2 blocking domain, and (f) a PDZ-binding domain at the cytosolic carboxy terminus (Ct) (Krueger and Saito, 1992; Barnea et al., 1993). Both RPTPγ and RPTPζ have multiple splice variants, which include secreted proteins (i.e., they lack the TM domain).
Within RPTPγ and RPTPζ, the substitution of residues conserved in the α-carbonic anhydrases (α-CAs), specifically the solvent network, proton shuttle, and two of the three conserved histidine residues that coordinate Zn2+, render the CALDs catalytically inactive. However, the CALD retains most of the other amino acids that are highly conserved in α-CAs, suggesting to us that the CALDs can still bind CO2 or HCO3−, even if they cannot catalyze CO2/HCO3− interconversion (Zhou et al., 2016).
In addition, CO2/HCO3−, RPTPγ and RPTPζ CALDs also bind to contactin (CNTN) cell-adhesion molecules. The RPTPγ CALD binds to the second and third Ig repeats in CNTN3, 4, 5, or 6 via an extended β-hairpin loop (residues 288–301) not present in the α-CAs, with the remaining contacts provided by RPTPγ residues 225–229. In the RPTPζ CALD, a homologous β-hairpin loop (residues 267–280), with additional contacts from R208 and K208, binds to Ig domains 2 and 3, but only of CNTN1 (Peles et al., 1995; Bouyain and Watkins, 2010; Lamprianou et al., 2011). The differences between the key amino acid residues in the RPTPζ CALD β-hairpin loop vs RPTPγ largely explain the specificity of the RPTPζ-CNTN1 interaction (Bouyain and Watkins, 2010; Lamprianou et al., 2011). These CALD-contactin interactions promote cell adhesion during the development and maintenance of the central nervous system (CNS), and their disruption is implicated in neurological disorders, such as autism and schizophrenia (Fernandez et al., 2004; Roohi et al., 2009; Lamprianou et al., 2011; Oguro-Ando et al., 2017).
Another RPTPζ ligand is pleiotrophin (PTN), a heparin-binding growth factor involved in cell proliferation, differentiation, and migration (Mohebiany et al., 2013). Yet a third are the chondroitin sulfates that anchor to numerous serine–glycine dipeptide motifs located between the FNIII and TM domains of RPTPζ (Maurel et al., 1994). Depending on their structure, the chondroitin sulfates tend to increase the binding affinity of PTN to the RPTPζ extracellular domain (Maeda et al., 1996). PTN binding induces RPTPζ dimerization, which includes trans-protomer D1–D2 interactions that block substrate access to the active sites of the two intracellular phosphatase domains. The net result is increased tyrosine phosphorylation (Fukada et al., 2006) due to the unbalanced action of tyrosine kinases of various downstream signaling molecules of RPTPζ, which include, but are not limited to, β-catenin (Meng et al., 2000; Perez-Pinera et al., 2006), G protein–coupled receptor kinase interactor 1 (Kawachi et al., 2001; Fukada et al., 2005), and anaplastic lymphoma kinase (Perez-Pinera et al., 2007). We are not aware of any reports of PTN binding to or inducing dimerization of RPTPγ.
RPTPγ, for which the full-length human and mouse cDNAs were first cloned by the Schlessinger laboratory (Barnea et al., 1993), is almost ubiquitously expressed in mammalian tissues. RPTPγ expression levels are particularly high in the CNS, endocrine, immune, and various epithelial or endothelial tissues, particularly in the lungs, liver, and kidneys (Tsukamoto et al., 1992; Barnea et al., 1993; Lamprianou et al., 2006; Vezzalini et al., 2007; Lorenzetto et al., 2014; Uhlén et al., 2015; Hansen et al., 2020). In the CNS, RPTPγ is present in the embryonic brain, where it regulates neurite outgrowth and cell adhesion (Sahin et al., 1995; Shintani et al., 2001). In the adult brain, RPTPγ predominantly localizes to the neurons of the neocortex, striatum, cerebellum, many nuclei of the brainstem, and the hippocampus stratum pyramidale (SP) (Lamprianou et al., 2006; Lorenzetto et al., 2014). In the cerebellum, Bergmann radial glia, as identified by co-staining with either glial fibrillary acidic protein (GFAP) or S100 EF-hand Ca2+-binding protein (Lorenzetto et al., 2014), express RPTPγ. Resting astrocytes and microglia in situ in the adult mouse brain are almost always negative for RPTPγ expression (Lamprianou et al., 2006; Lorenzetto et al., 2014). To summarize from previous reports, RPTPγ expresses widely throughout the body; in the CNS, RPTPγ is present mainly in certain neurons and in some astrocytes.
Schlessinger and collaborators generated RPTPγ knockout (Ptprg−/−) mice (Lamprianou et al., 2006). These mice develop normally, exhibit only mild behavioral abnormalities (Lamprianou et al., 2006), but have a marked decrease in their ability to defend against chronic whole-body metabolic acidosis (Zhou et al., 2016). Ptprg−/− mice also exhibit an attenuated vasodilator response when extracellular HCO3− concentration ([HCO3−]o) decreases (Boedtkjer et al., 2016) and are prone to elevated blood pressure induced by hyperventilation (Hansen et al., 2020). Moreover, loss-of-function mutations and single-nucleotide polymorphisms in human RPTPγ are also associated with heart ischemic vascular disease (Hansen et al., 2020) and increased risk of human cerebral infarction (Carty et al., 2015).
Saito and colleagues were the first to clone the cDNA encoding full-length RPTPζ using human tissue (Krueger and Saito, 1992). Shortly thereafter, Schlessinger and collaborators cloned and characterized RPTPζ from both humans and mice (Levy et al., 1993). RPTPζ expresses in some peripheral tissues, such as stomach and bone (Schinke et al., 2008; Fujikawa et al., 2017; Fujikawa et al., 2019), as well as Schwann cells in the peripheral nervous system (Snyder et al., 1996). However, RPTPζ preferentially expresses in the CNS (Levy et al., 1993), which includes the spinal cord (Milev et al., 1994). High RPTPζ expression levels in the embryonic ventricular zone (VZ) and sub-ventricular zone (SVZ) are consistent with an important role for RPTPζ in CNS development (Levy et al., 1993; Canoll et al., 1996). During development, the radial processes of several classes of glia exhibit RPTPζ expression (Canoll et al., 1993; Canoll et al., 1996; Lorenzetto et al., 2014). RPTPζ splice variants with TM domains tend to be expressed in the glial progenitors located in the SVZ, whereas the secreted variant, phosphacan, is expressed at high levels in more mature astrocytes located beyond the SVZ (Canoll et al., 1996). Schwann cells and astrocytes that surround the olfactory bulb axons also express RPTPζ (Canoll et al., 1993), as do primary astrocytes in culture in rats (Sakurai et al., 1996), as well as glioblastoma (Krueger and Saito, 1992) and glioma cell lines (Sakurai et al., 1996). Furthermore, Shintani et al. (1998) reported astrocytic RPTPζ expression in both cortical cultures from e16 embryonic mice, early postnatal animals (≤P10), and in adult cortical and hippocampal (HC) astrocytes. To summarize from previous reports, RPTPζ expresses mainly in the CNS, particularly in cells of the VZ/SVZ and radial glial cells of embryos and in certain neurons in adults.
The considerable disparity in the reported levels of astrocytic RPTPζ expression among different studies is likely contingent upon several factors, which include (a) whether the astrocytes are cultured or in situ, (b) the specific brain region from which they originate, (c) whether they are quiescent or reactive, (d) their age, and (e) whether it is mRNA transcript or protein expression that is reported.
The Noda and Schlessinger laboratories independently generated RPTPζ knockout (Ptprz1−/−) mice (Shintani et al., 1998; Harroch et al., 2000). Adult Ptprz1−/− mice of either strain show no obvious anatomical abnormalities (Shintani et al., 1998; Harroch et al., 2000; Tamura et al., 2006). However, they exhibit increased oligodendrocyte differentiation, impaired remyelination (Harroch et al., 2002; Kuboyama et al., 2012; Kuboyama et al., 2015; Kuboyama et al., 2016), and age-dependent impaired spatial learning (Niisato et al., 2005; Tamura et al., 2006).
In the present study, we examine (a) mixed neuron–astrocyte HC cultures from P0–P2 mice, and HC tissue from (b) P0–P2 neonates and (c) adults. We detect the mRNAs encoding and clone the corresponding cDNAs of both novel and previously reported mouse RPTPγ and RPTPζ variants. We also determine by immunocytochemistry (ICC) and immunohistochemistry (IHC) in each cell/tissue preparation that RPTPγ and RPTPζ co-express in the same mouse HC neurons. However, we detect neither RPTPγ nor RPTPζ in HC astrocytes. This observation corroborates much of the previous literature regarding the almost exclusive expression and localization of RPTPγ in neurons. However, the present results are in contrast to some previous studies reporting either that RPTPγ and RPTPζ express in different types of neurons (Lorenzetto et al., 2014) or that RPTPζ is primarily expressed in glia (Canoll et al., 1993; Canoll et al., 1996; Shintani et al., 1998; Harroch et al., 2000).
MethodsEthical approval and animal proceduresProtocols for housing and handling mice were approved by the Institutional Animal Care and Use Committee at Case Western Reserve University.
Mouse lines and breedingThe Ptprg−/− and Ptprz1−/− mice were generous gifts of Prof. Joseph Schlessinger (Harroch et al., 2000; Lamprianou et al., 2006). We backcrossed for more than seven generations with our standard laboratory wild-type (WT) strain, C57/BL6Case, which we derived from mice originally provided by Prof. Alan Verkman as heterozygotes for the aquaporin 1 knockout (Aqp1−/−) mouse (Ma et al., 1998).
Cell cultureWe obtained primary co-cultures of HC neurons and astrocytes from WT and Ptprz1−/− mice as described previously (Bouyer et al., 2004; Salameh et al., 2014; Salameh et al., 2017). In summary, after decapitating non-anesthetized P0–P2 pups (both sexes), we identified and isolated the hippocampus and digested the tissue in a HEPES-buffered saline containing (in mM): 143.7 NaCl, 3 KCl, 10 HEPES, 1.1 EDTA, 5.5 L-cysteine, and 1% papain (cat# LS003162, Worthington Biochemical Corp., Lakewood, NJ), at pH 7.40. After 10 min of papain digestion at 37°C, to disperse cells, we triturated (using a series of flamed Pasteur pipettes of decreasing tip diameters, from 5 to 3 to 1 mm) the tissue in media containing 22 mM HCO3−, dissolved in 9.5% minimum essential medium (MEM; cat# 61100-103, Gibco, BRL, Life Technologies Inc., Gaithersburg, MD), 1.5% trypsin inhibitor (cat# T9253, Sigma-Aldrich, St. Louis, MO), and 1.5% bovine serum albumin (BSA, cat# A7906, Sigma-Aldrich) equilibrated with 5% CO2 in a 37°C incubator, at a pH of 7.40. After trituration, we diluted the cell suspension to a concentration of ∼1 × 10⁵ cells∙ml−1, plated this suspension onto a coverslip previously coated with 0.1% poly-L-ornithine, and placed it in a 35-mm Petri dish containing 1 mL culture media that contained 70% preconditioned complete media (see below), 30% neurobasal media (cat# 21103, Gibco), supplemented with 0.02% B27 (cat# 17504–044, GIBCO), 10 ng ml−1 FGF-5 (cat# F4537, Sigma-Aldrich), and 1 ng mL−1 basic fibroblast growth factor (cat# F0291, Sigma-Aldrich). We placed these Petri dishes in an incubator at 37°C, with 5% CO2/balanced air. After 24 h (and then every 2 days after that), we exchanged half of the media with neurobasal media supplemented with 10% B27 and 1% pen/strep. We used the cells for physiological studies between day 14 and ∼23 in culture.
The preconditioned complete media was made by incubating 200 μL of freshly dissociated cells (∼1 × 10⁵ cells∙ml−1) in 10 mL MEM solution supplemented with 10% fetal bovine serum (cat# 26140-079, Gibco) and 0.02% penicillin–streptomycin (cat# 15140–122, Gibco) for 1 week, followed by filtration.
Total RNA isolation for RT-PCRFrom cell cultureWe aspirated the culture media from day 14, mixed neuron–astrocyte HC cultures, and added 0.3 mL TRIzol reagent (cat# 1559602, Thermo Fisher Scientific) per 35-mm dish. We homogenized the sample by repeated pipetting using a P-200 pipette tip and then followed the manufacturer’s instructions for phenol–chloroform extraction and ethanol precipitation to purify total RNA (TRNA). We dissolved the purified TRNA in RNAse-free H2O, assayed concentration and quality using a NanoDrop 2000 UV spectrophotometer (Thermo Fisher Scientific) to assess absorbance at 260 and 280 nm, and stored 5-μg/μL aliquots in single-use tubes at −80°C until ready to perform RT-PCRs.
From tissueThe initial steps for isolating pup HC tissue for TRNA isolation were as described above for the preparation of mixed neuron–astrocyte HC cultures. However, instead of digesting the isolated pup hippocampi, we immediately snap-froze and stored the tissue at −80°C until we collected enough samples to isolate TRNA with TRIzol reagent.
To isolate adult mouse hippocampi, we sacrificed 9- to 12-week-old animals under isoflurane-induced anesthesia by cervical dislocation. We immediately dissected the hippocampi from both hemispheres, snap-froze the samples, and then stored them at −80°C until we isolated TRNA with TRIzol reagent.
To isolate TRNA, we added 1 mL of TRIzol reagent to 10 frozen pup hippocampi or 5–6 frozen adult hippocampi and then homogenized for 5 min at room temperature. We then purified and stored the TRNA as described above for the cell culture samples.
RT-PCR cloningWe followed the manufacturer’s instructions from the SuperScript IV First-Strand Synthesis System (cat# 18091050, Thermo Fisher Scientific) to perform reverse transcription from the TRNA isolated from culture, pup, or adult mouse hippocampi primed with 2.5 μM Oligo (dT)20 in a 20-µL total reaction volume. The RNA template was digested with RNase H, the cDNA product was isolated from the reaction using the QIAquick PCR Purification Kit (cat# 28104, Qiagen), and the cDNA concentration assayed by NanoDrop UV spectrophotometry (Thermo Fisher Scientific).
We assembled PCRs using 5 μg of cDNA template with PrimeSTAR HS DNA Polymerase (cat# R010A, Takara Bio), dNTPs, and the gene-specific primers according to the manufacturer’s instructions. We performed 30 cycles of PCR amplification, loaded the PCRs on 1% agarose gels, isolated amplified bands from the agarose with a sterile scalpel, and purified the cDNA fragments from the agarose using the QIAquick Gel Extraction Kit (cat# 28704, Qiagen). The concentration of each isolated band was determined using NanoDrop UV spectrophotometry. We ligated the PCR bands into the pCR-Blunt plasmid using the Zero Blunt PCR Cloning Kit (cat# K270040, Thermo Fisher Scientific) and transformed the plasmid into TOP-10 chemically competent E. coli provided in the kit. Individual colonies were isolated from Kanamycin-selective agar plates (50 μg/mL Kanamycin) and grown in LB media (+50 μg/mL Kanamycin) overnight at 37°C. We isolated and purified plasmid using the QIAprep Spin Miniprep Kit (cat# 27104, Qiagen), and the inserted PCR fragment was sequenced with M13 Forward, M13 Reverse, and other gene-specific primers.
PCR primersFor each primer, we provide the nomenclature, primer sequence, and location in Table 1.
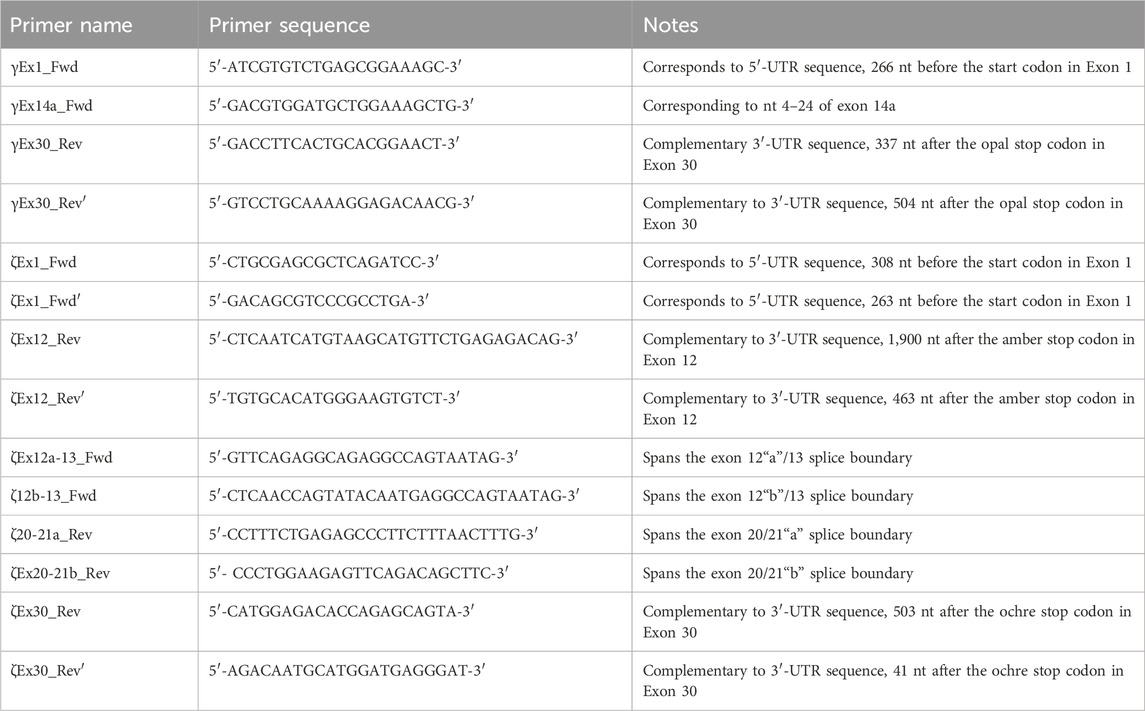
Table 1. Nomenclature, sequence, and description of all PCR primers used in the present study.
RPTPγ primersWe designed two primer sets specifically for Ptprg transcripts: one to amplify long transcripts and another to amplify short transcripts. The first (“long”) γEx1_Fwd and γEx30_Rev primer pair amplifies all possible Ptprg transcripts that initiate with Exon 1 and terminate with Exon 30, which includes Ptprg-V1 (NM_008981) and the hypothetical Ptprg-X1 assembly (XM_006517956). The second (“short”) γEx14a_Fwd and γEx30_Rev′ primer pair amplifies the Ptprg-V2 transcript (NM_001347593), which initiates in Exon 14a and terminates in Exon 30, 146 nt 3′ to the termination of the previous reverse primer (i.e., γEx30_Rev). We clone the purified PCR bands into the pCR-Blunt plasmid using the Zero Blunt PCR Cloning Kit as described above.
RPTPζ primersDetermining the presence of different Ptprz1 transcripts is more challenging than is for Ptprg (which has one validated1 short transcript, one validated long transcript, and one hypothetical long transcript; see previous paragraph) for three reasons: (a) Ptprz1 has as many as nine assemblies, four validated and five hypothetical; (b) Ptprz1 has multiple “short” (<5.4 kb), one “intermediate” (5.4–8.0 kb), and multiple “long” (>8.0 kb) Ptprz1 transcripts; and (c) the differences that arise from alternate utilization of three of the cassettes (exon 16, which may be spliced in or out; exon 21“a” or 21“b”2) are so small that the alternative splicing yields multiple full-length transcripts that are difficult to distinguish in a single PCR on the basis of size alone. Therefore, we designed sets of nested primer pairs (Table 2) to amplify cDNA fragments from at most two possible transcripts per PCR and then verified the identity of these transcripts through cloning the cDNA and sequencing. In both Table 2 and the lists below, “V” designates previously verified murine Ptprz1 variants, whereas “X” designates variants previously designated as hypothetical. As described above, we cloned PCR bands for all short, intermediate, and long Ptprz1 transcripts into pCR-Blunt for sequencing.
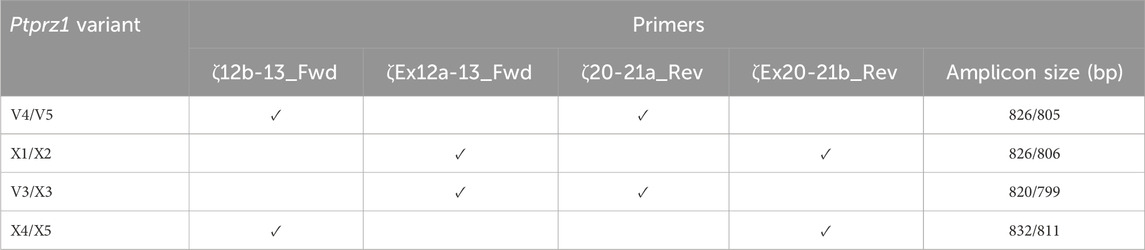
Table 2. Primer-pair combinations for the second round Ptprz1 variant-specific PCR amplicons. The primers in the first round of PCR were always ζEx1_Fwd and ζEx30_Rev, as summarized in Table 1. In the first column, the solidus flanks two variants that the primer set could amplify. In the last column, the solidus flanks the base-pair lengths of the respective variants.
V1: To amplify the lone intermediate-length Ptprz1-V1 transcript, we used, in the round-one PCR, ζEx1_Fwd together with the ζEx12_Rev primer. We then used the purified amplicon from round one as template in a second, nested PCR using the ζEx1_Fwd′ and ζEx12_Rev′ primer pair.
Other variants: To amplify all possible “short” and “long” Ptprz1 full-transcripts that commence with exon 1 and end with exon 30, in round-one PCR, we used the primers ζEx1_Fwd and ζEx30_Rev. For the second round, we used the amplicons from round one as templates, together with the ζEx1_Fwd′ and ζEx30_Rev′ primer pair.
To identify the presence of all other alternative Ptprz1 cassettes from transcripts that commence with exon 1 and end with exon 30, we used first-round PCR amplicons amplified from PCRs primed with ζEx1_Fwd and ζEx30_Rev as the cDNA template in second-round nested PCRs. These second-round PCRs were primed with new sets of “diagnostic” nested primers (also summarized in Table 1) that produce shorter, variant-specific amplicons. We outline the rationale for the designs of these novel second-round primers in the following list:
V3/X3: We designed the ζEx12a-13_Fwd and ζEx20-21a_Rev primer pair that will amplify an 820-bp fragment of Prprz1-V3 and/or a 799-bp fragment of Prprz1-X3 cDNA if the transcripts are present in TRNA.
V4/5: The ζ12b-13_Fwd and ζ20-21a_Rev primer pair amplifies an 826-bp fragment of Prprz1-V4 and/or 805-bp fragment of Prprz1-V5 if these transcripts are present in TRNA.
X1/X2: We designed the ζEx12a-13_Fwd and ζEx20-21b_Rev primer pair to amplify an 827-bp fragment of Prprz1-X1 and/or 806-bp fragment of Prprz1-X2 if mRNAs are present in the TRNA sample.
X4/5: The ζ12b-13_Fwd and ζEx20-21b primer pair amplify an 832-bp fragment of Ptprz1-X4 and/or 811 bp fragment of Ptprz1-X5 if the transcripts are present in the TRNA sample.
AntibodiesRPTPγ. An RPTPγ chicken IgY antibody raised against the murine RPTPγ sequence 390CZNEDEKEKTFTKDSDKDLK407 (Mafficini et al., 2007)—Figure 2B, variant V1—was a generous gift from Claudio Sorio (University of Verona, Italy) and used in both ICC and IHC experiments at 2.5 μg ml–1 working concentration, diluted from the affinity-purified antibody stock (1.2 mg ml–1).
RPTPζ. We developed a new rabbit polyclonal antibody (GenScript, Piscataway, NJ) against an extracellular epitope between the FNIII and TM domains of murine RPTPζ (anti-RPTPζ vs 690QIDESRETTESFSP703; Figure 6B, magenta arrowhead, common to all variants). The antibody was affinity purified, and the titer was determined to be >1:512,000 by indirect ELISA. Aliquots of affinity-purified anti-RPTPζ (stock concentration, 0.794 mg ml–1) in phosphate-buffered saline (PBS) with 0.02% sodium azide (pH 7.40) were stored at −80°C. The working dilution was 1:1,000 from the affinity-purified antibody stock solution for cell cultures and 1:500 for tissue sections. We validated the anti-RPTPζ antibody specificity on RPTPζ−/− mixed neuron–astrocyte HC cultures and brain slices.
Other primary antibodies. To identify CNS neurons in cultures or tissue sections, we used microtubule-associated protein 2 (MAP2) antibody (mouse IgG1 1:500 dilution; cat# MAB3418, Sigma-Aldrich). To identify astrocytes either in culture or tissue, we stained these with the GFAP antibody (GFAP, mouse IgG1 1:400 dilution; cat# G3893, Sigma-Aldrich).
Secondary antibodies. We applied 1 μg ml–1 of secondary antibodies conjugated to Alexa Fluor 633 to detect the binding of the primary antibodies against RPTPγ (cat# A-21103, Thermo Fisher Scientific, goat anti-chicken) or RPTPζ (cat# A-21070, Thermo Fisher Scientific, goat anti-rabbit). We detected the anti-MAP2 or anti-GFAP binding by incubating samples with 1 μg ml–1 of goat anti-mouse secondary antibody conjugated to Alexa Fluor 488 (cat# A-28175, Thermo Fisher Scientific). We counterstained cell nuclei with 4,6-diamidino-2-phenylindole (DAPI, 300 μM working concentration, diluted from a 30 mM stock dissolved in dimethylformamide).
ImmunocytochemistryWe aspirated the media from mixed neuron–astrocyte HC cultures and washed 3× with ice-cold PBS. We then fixed the cultures by incubating them for 20 min in 4% paraformaldehyde (PFA, cat# 15710, Electron Microscopy Sciences) in PBS. We then permeabilized the cells by incubating the samples in PBS + 0.05% Tween 20 (PBST) for 10 min. For the primary antibodies raised in mouse or rabbit, we blocked non-specific antibody binding by incubating the fixed and permeabilized cells in 5% normal goat serum (NGS) in PBS for 30 min at room temperature. For samples stained with the chicken RPTPγ primary antibody, we blocked the fixed and permeabilized cells with 1% bovine serum albumin (cat #9048-46-8, Sigma) in PBS for 30 min at room temperature to minimize non-specific binding. We then incubated the fixed, permeabilized, and blocked samples with primary antibodies overnight at 4°C. Following the overnight primary antibody incubation, we washed the cells 3× with PBST and then again blocked with either 5% NGS or 1% BSA (for RPTPγ stained samples) in PBS for 60 min, all at room temperature. Subsequently, we incubated the cells for 60 min at room temperature with the appropriate fluorescently tagged secondary antibodies (see above). Finally, we washed the samples with PBST 3× and during the final wash, counterstained them with the nuclear marker DAPI. We mounted the stained coverslips in VECTASHIELD Antifade Mounting Medium (cat# H-1000-10, VectorLabs) on microscope slides, sealed the coverslip edges with clear nail polish, and left them to cure in the dark for at least 1 h before imaging or before storing the slides at 4°C until imaging.
ImmunohistochemistryIn the case of newborns, we decapitated P0–P2 pups, immediately excised the brains, and identified and isolated the hippocampi, which we placed into 4% PFA in PBS overnight at 4°C. The following day, the brains were switched to 2% PFA in PBS for 24 h at 4°C. In the case of adults, we placed mice under deep isoflurane-induced anesthesia and then transcardially perfused each animal, first with heparinized normal saline (0.9% NaCl in H2O with 10 units heparin per milliliter; cat# H0777, Sigma) to flush out the blood and then with 4% PFA in PBS. We immediately excised the brains and placed them into 2% PFA overnight at 4°C.
For fixed pup and adult brains, we performed sucrose exchange before embedding the whole brains in O.C.T. Compound (cat# 4586, Scigen), freezing, and cryosectioning. We cut and mounted 5-µm-thick sagittal brain sections on Superfrost Microscope Slides (cat# 12-550-15, Fisher Scientific) and stored them at −20°C until ready for use.
Prior to staining, we performed antigen retrieval by microwaving the sections in 2 mM citric acid/8 mM sodium citrate buffer, pH 6.0, first for 4 min at high power and then for 10 min at 50% power (in a 1200-W microwave). After microwaving, we placed the slides in a beaker, packed the beaker in ice, and allowed the sections to cool to room temperature while still keeping them submerged in citrate buffer. After cooling, we washed slides 3× 5 min with Tris-buffered saline + 0.05% Tween 20 (TBS-T), and then air-dried for 10 min. After delineating each section using a PAP Pen (cat# 195505, Research Products International Corp.), we rehydrated the slides 3× for 5 min with TBS-T and then blocked with 1% BSA, 4 nM NaN3 in TBS-T for 30 min to minimize non-specific binding. Primary antibodies were diluted from stock to their working concentrations in the appropriate blocking buffer (mouse monoclonal and rabbit polyclonal primary antibodies in 5% NGS in TBS, and chicken primary antibody in 1% BSA in TBS; see Antibodies, Secondary antibodies) and incubated overnight at 4°C. The next day, we performed a 5-min wash in TBS-T + 1% BSA, followed by a high-salt TBS wash (2.5% NaCl), and then another 5-min wash in TBS-T + 1% BSA. We diluted secondary antibodies in the appropriate blocking buffer as described above for the cultured cell staining and incubated in the dark for 2 h at room temperature. We next performed a 5-min wash in TBS-T + 1% BSA, followed by a high-salt TBS wash (2.5% NaCl), and then another 5-min wash in TBS. In the subsequent step, we then performed auto-fluorescence quenching using the TrueVIEW Autofluorescence Quenching Kit (cat# SP-8400-15, VectorLabs, Newark, CA) according to the manufacturer’s instructions. We performed a final 5-min wash in TBS before we mounted the stained sections in VECTASHIELD Antifade Mounting Medium. Finally, we sealed the coverslip edges with clear nail polish and left them to cure in the dark for at least 1 h before either imaging or storing the slides (at 4°C) for imaging.
Confocal microscopyWe acquired images using an FV3000 (IX83) laser-scanning confocal microscope equipped with a super-corrected PLAPON60×OSC2, 1.4 numerical aperture oil-immersion objective lens. For co-labeling studies, we scanned each laser line in an individual channel to minimize bleed-through, which was negligible. We acquired images utilizing the full dynamic range of the acquisition system, that is, setting laser intensity, photomultiplier tube voltage, and offset based on the laser wavelength and intensity of the specimen fluorophores. We sampled images at 12 bits/pixel with a dwell time of 10.0 μs/pixel.
ResultsRPTPγIdentification of a novel RPTPγ variant in mouse hippocampusThe mouse Ptprg gene (Gene ID: 19270) comprises 31 exons on chromosome 14. When we commenced the present investigation, the NCBI RefSeq database (Pruitt et al., 2012) contained two murine splice variants (i.e., V1 and V2). The variant 1 (Ptprg-V1, [NM_008981]) transcript is encoded by exons 1–30 (Figure 1A).
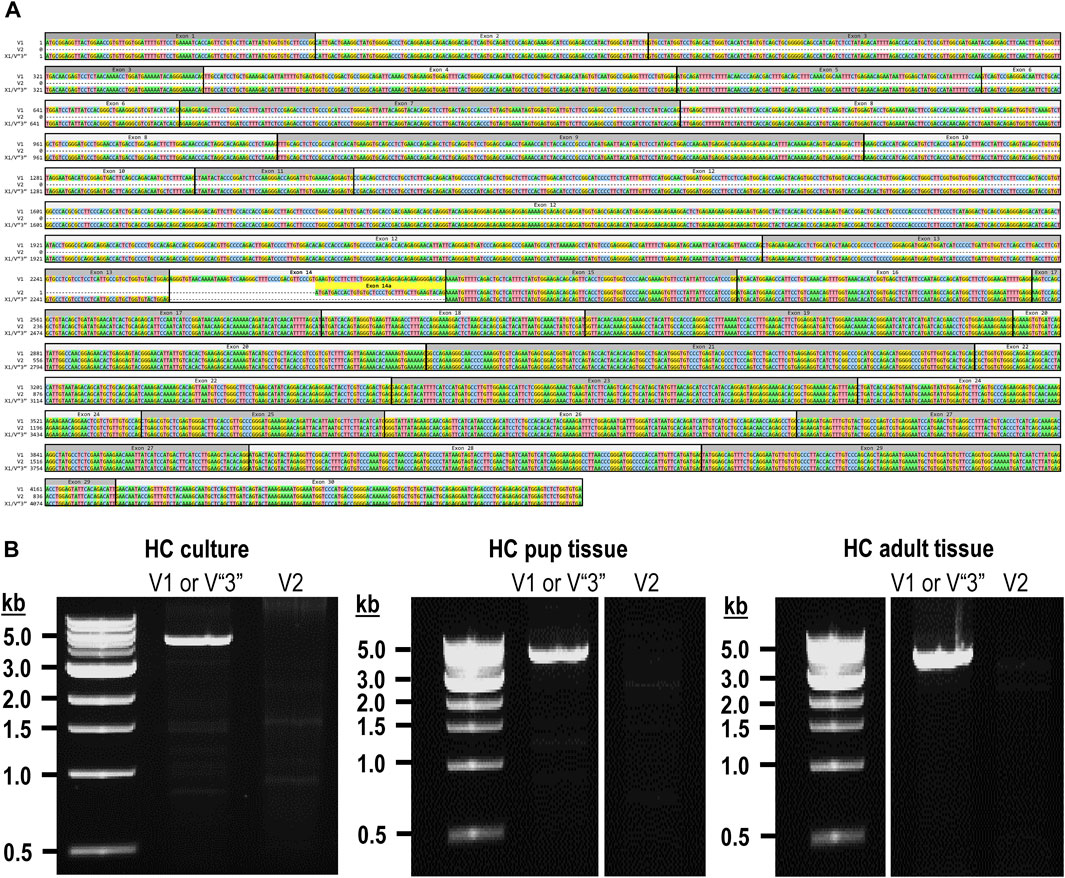
Figure 1. Nucleotide alignment of RPTPγ transcript variant ORFs. (A) Multiple sequence alignment of the ORF nucleotide sequences for the mouse variants RPTPγ-V1 (NM_008981), RPTPγ-V2 (NM_001347593), and RPTPγ-V“3” (formerly XM_006517956). We delineate exon boundaries with black boxes and provide the exon numbers above the nucleotide sequences (odd exon numbers on a gray background, even numbers on a white background). Note that alternative splicing yields exon 14 in V1 (white background), the completely different exon 14a in V2 (yellow background), and the exclusion of both exons 14 and 14a from V“3”. (B) Bands amplified from RT-PCRs using gene-specific primers designed to amplify full-length V1 or V2 from TRNA isolated from mixed neuron–astrocyte HC cultures (left), HC tissue from P0–P2 pups (center), and adult mouse HC tissue (right). The lane labels describe the primer set (Table 1) used to perform each PCR. Clearly visible in all preparations is the ∼5-kb band, which we isolated and cloned. The band contained cDNAs for both V1 and V“3”. In none of the three preparations did the V2 gene-specific primers produce a readily visible product of the predicted 2,598-bp size. The “HC pup tissue” gel image is spliced (marked by the vertical white line) to remove one lane that were identical replicates of the displayed V1 or V“3” lane. The “HC adult tissue” panel is from the same gel image as the “HC pup tissue” image. This “HC adult tissue” image is spliced (marked by the vertical white line) to remove four lanes that represented “HC pup tissue” data.
The variant 2 (Ptprg-V2, [NM_001347593]) transcript differs from V1 in that it does not include exons 1–13 but rather originates with the alternate exon 14a, which contains an alternative in-frame initiator methionine and then assembles with exons 15–30 to generate a transcript that lacks the coding regions for the extracellular and TM domains of V1 (Figure 1A).
In the present study, we designed gene-specific primers (GSPs; Table 1) for use in RT-PCR cloning experiments to determine which RPTPγ variants are expressed in mixed neuron–astrocyte HC cultures, P0–P2 pup hippocampi, and adult HC tissue. We designed the γEx1_Fwd and γEx30_Rev GSPs to amplify the RNA encoding the known V1 variant and γEx14a_Fwd and γEx30_Rev′ to detect the known V2. From all three preparations, γEx1_Fwd and γEx30_Rev GSPs amplified ∼5,000 bp bands, which we cloned and sequenced. Each band actually represents two transcripts, one encoding the expected V1 variant and the other encoding a novel variant that we propose to designate as V3. Throughout the article, we use double quotation marks to enclose proposed variant numbers (i.e., those not yet formalized by the NCBI or other bodies). Thus, we write proposed V3 as V“3”.
V1 transcriptsFrom mixed neuron–astrocyte HC cultures, we obtained 10 colonies, 40% of which contained the complete 4,329-bp open reading frame (ORF) for Ptprg-V1 (Figure 1B). We submitted three of these four clones to GenBank, which assigned the accession numbers [OR710276], [OR710277], and [OR710278]. From pup and adult HC tissue, we obtained 10 colonies each, 30% of which contain the same complete 4,329-bp ORF for Ptprg-V1. For both pup and adult, we submitted two samples for pup and three for the adults of these three clones to GenBank. GenBank assigned accession numbers [OR710279] and [OR710280] for the pup, and [OR710281], [OR710282], and [OR710283] for the adults.
Novel V“3” transcriptsIn addition to the 40% or 30% of the PCR cloning colonies that yielded Ptprg-V1 cDNA (see V1 transcripts section), we found that the remaining colonies represent the hypothetical murine assembly [XM_006517956]. Specifically, 60% of the colonies from mixed neuron–astrocyte HC cultures (five submitted, yielding GenBank accession numbers [OR900076]–[OR900080]) and 70% of the PCR cloning colonies from pup ([OR900081]–[OR900088]) or adult HC tissue ([OR900089]–[OR900093]; Figure 1B). This novel transcript lacks exon 14 (representing 29 amino acids), which encodes the intracellular region immediately after the TM domain in Ptprg-V1.
Interestingly, in a single pup P0–P2 culture clone (i.e., [OR900082]), sequencing on both cDNA strands revealed the existence of a single G→A nucleotide substitution, 584 nt into the Ptprg ORF. In [OR900082], this substitution changes the 583AGA585 ORF codon to 583AAA585, resulting in an R195K amino acid change in the translated RPTPγ protein. This conservative substitution, located on the external surface of the CALD, is the single amino acid linking the S186-N194 α-helix and the I197-S207 β-strand (Bouyain and Watkins, 2010). As a point of reference, R195K is located within the CALD, 20 downstream from residue Q175, which is at the position equivalent to one of the three Zn2+-coordinating histidines in active CAs.
Note that we did not amplify or clone cDNA corresponding to mouse Ptprg-V2 from any of our three mouse preparations (Figure 1B).
Figure 2A displays a schematic representation of the topology and structural domains of the three translated RPTPγ variants. RPTPγ-V1 [NP_033007] and RPTPγ-V“3” (formerly hypothetical [XP_006518019]) both possess extracellular CALD and FNIII domains, followed by a single TM domain, and the D1 and D2 phosphatase domains. They differ only by the omission of 29 juxta-membrane amino acids that, in RPTPγ-V“3”, are encoded by exon 14 (Figure 1A). In Figure 2A, we represent this omission by the dashed line. RPTPγ-V2 [NP_001334522]—undetected in the present study—lacks the CALD, FNIII, and transmembrane domains and therefore is an exclusively intracellular variant.
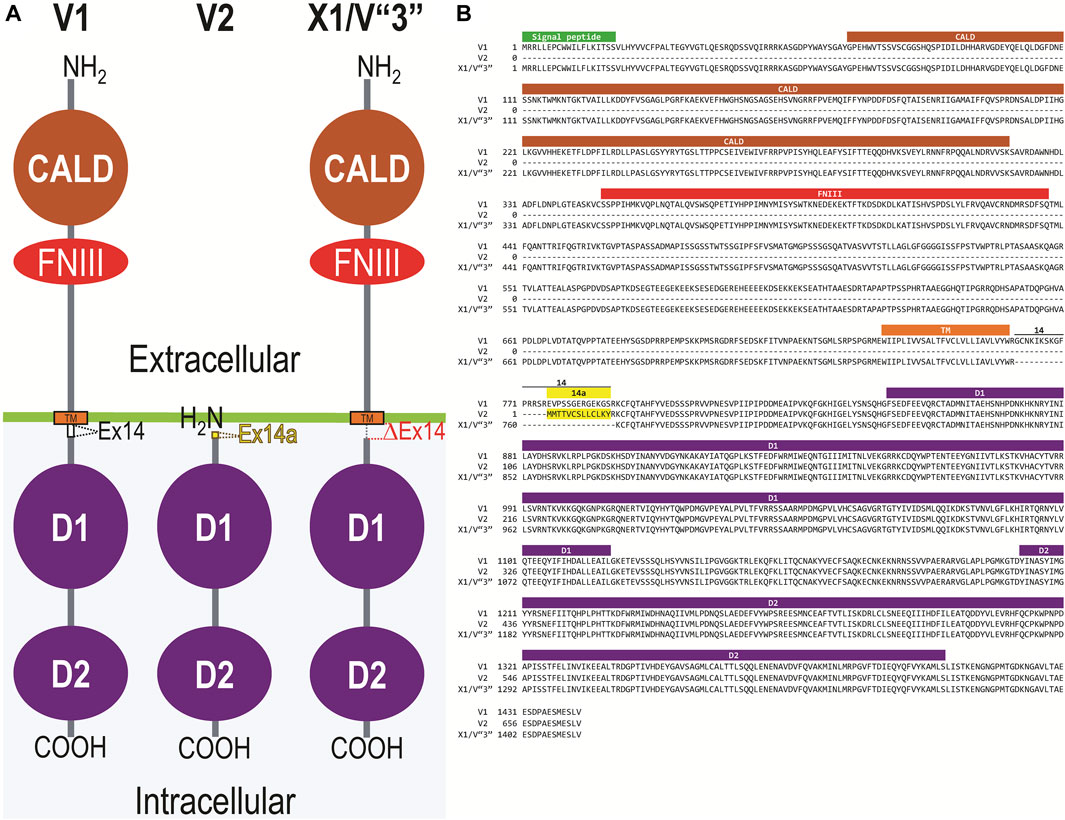
Figure 2. Functional domains and alignment of mouse RPTPγ protein variants. (A) Schematic view of the functional domains in mouse RPTPγ protein variants. V1 and V“3” are transmembrane variants that possess extracellular CALD and FNIII domains. RPTPγ-V1 and RPTPγ-V“3” are distinguished by the inclusion, in V1, of a 29-amino acid intracellular cassette (see white box labeled “Ex14”; encoded by exon 14 as shown in Figure 1), immediately after the TM domain (orange box). RPTPγ-V“3” lacks the 29 amino acids encoded by exon 14 in V1 (see gap labeled “ΔEx14” in red). Because the translation of the Ptprg-V2 transcript begins with the methionine in exon 14a, RPTPγ-V2 lacks all of the amino acids between the N-termini and transmembrane domains of V1 and V“3” and is thus a cytoplasmic variant that possesses only the 13 amino acids encoded by exon 14a (shown as a yellow box) through the C-terminus, which includes the D1 and D2 domains. The vertical height of each domain is proportional to the number of amino acid resides comprising each domain. (B) The amino acid alignment of the three mouse RPTPγ variants. RPTPγ-V1 [NP_033007], RPTPγ-V2 [NP_001334522], and RPTPγ-V“3” (that we proposed becomes the validated form of [XP_00651801]). We highlight the functional domains above each row with shading colors that match the domains in (A). We also highlight the alternative 29-amino acid sequence encoded by exon 14 (black text above alignment) or the alternative 13-amino acid sequence encoded by exon 14a (yellow highlighted text).
Figure 2B displays the amino acid sequence alignment for the three RPTPγ variants. The RPTPγ-V“3” protein corresponds to the protein previously only reported by NCBI RefSeq as a hypothetical mRNA XM_006517956 and the hypothetical translation product [XP_006518019].
RPTPγ protein expression in HC neurons and astrocytes in mixed culture, pup, and adult tissueMixed neuron–astrocyte HC culturesAbout 14 days after initiating cultures from WT P0–P2 mouse pups, we stained the primary neuron–astrocyte HC cultures with DAPI (Figure 3A, blue in leftmost column), a MAP2 mouse monoclonal antibody (green) to identify the neurons, and a RPTPγ chicken IgY antibody (red; see Mafficini et al., 2007). The rightmost column shows the merged images. We determine that RPTPγ (Figure 3A, red) is localized throughout the neuronal soma and major neuronal processes. When we stained parallel cultures, not with an MAP2 antibody but with a GFAP mouse monoclonal antibody to identify the astrocytes (Figure 3B, green), RPTPγ-stained projections (red) from adjacent neurons are clearly visible surrounding the astrocytes. However, the staining never colocalizes within the GFAP-positive cells (i.e., astrocytes).
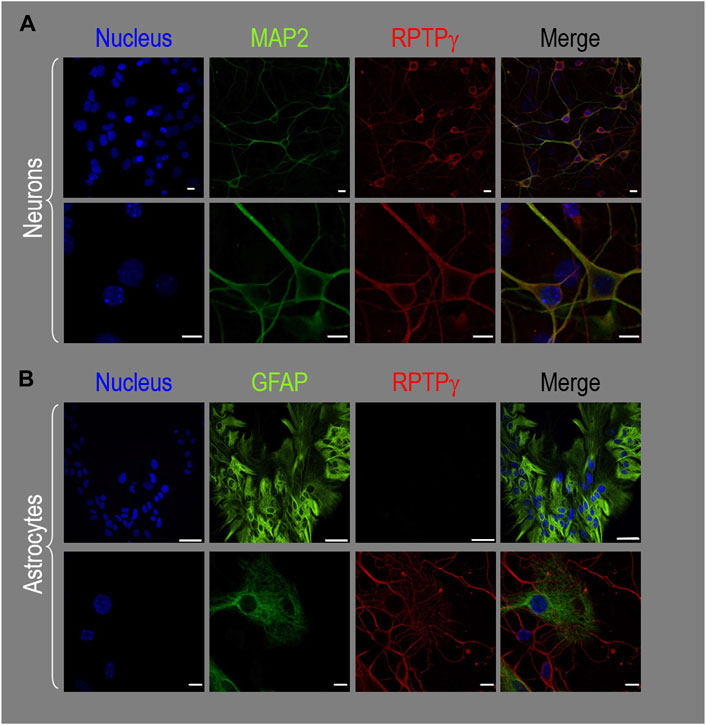
Figure 3. RPTPγ protein expression in HC neurons and astrocytes, in mixed cultures from WT mice. (A) Neurons in representative low-magnification (top row) and high-magnification (bottom row) images of mixed neuron–astrocyte HC cultures. The columns of panels (from the left) show DAPI staining (blue) of cell nuclei, MAP2 staining (green) to identify neurons, RPTPγ staining (red), and the merge. Note that both the somata and processes of the green MAP2-positive cells (i.e., neurons) stain for RPTPγ (red). (B) Astrocytes in representative low-magnification (top row) and high-magnification (bottom row) images emphasizing astrocytes in mixed neuron–astrocyte HC cultures. The protocol and presentation are the same as in (A) except that here we used GFAP staining (green) to identify astrocytes. Note that the green GFAP-positive cells (i.e., astrocytes) lack the red RPTPγ staining, which we observed only in adjacent neuronal somata and processes at high magnification (bottom row). Scale bars in all panels represent 10 μm.
P0–P2 pup HC tissueBecause we derived the mixed neuron–astrocyte HC cultures from P0–P2 pups, we also studied RPTPγ expression in native P0–P2 HC tissue. We examined stained sections from four regions of P0–P2 pup hippocampus: cornu ammonis 1 (CA1), CA2, CA3, and dentate gyrus (DG). In each row of Figure 4, the leftmost panel is at relatively low magnification, whereas the panels to the right are high-magnification images from selected regions of interest (ROIs). We observed that MAP2-stained neurons (Figure 4A, green) in all four HC regions also stained for RPTPγ (red). Throughout the CA regions, the brightest RPTPγ staining was in the SP and became more diffuse in the adjacent stratum oriens (SO) and stratum radiatum (SR). Within the DG, RPTPγ staining was concentrated in the stratum granulosum (SG) but extended more diffusely into the neuropil of the adjacent molecular layer (ML).
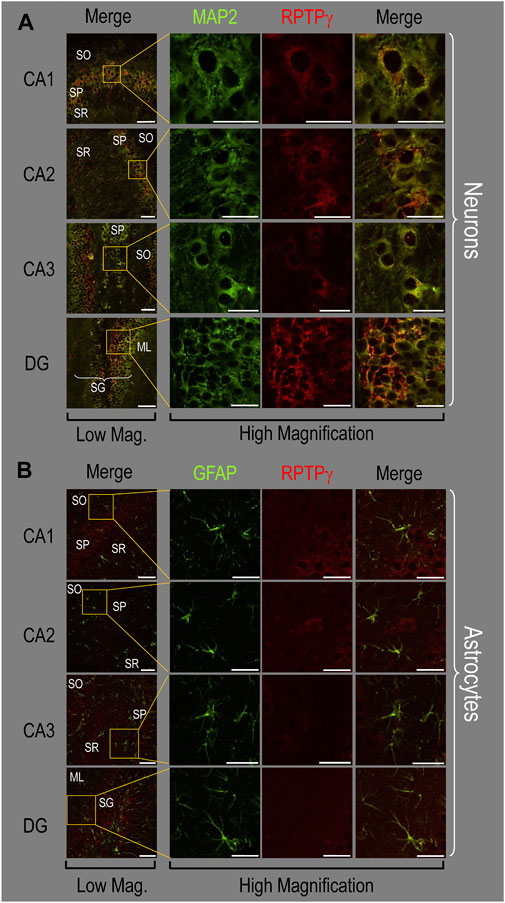
Figure 4. RPTPγ protein expression in P0–P2 pup HC tissue from WT mice. (A) Neurons in representative examples of low- and high-magnification images of RPTPγ immunostained tissue. The columns of panels (from the left) show (a) low-magnification merged images of MAP2 staining (green; individual images not shown) and RPTPγ staining (red; individual images not shown), and then three columns of high-magnification zoomed-in images representing (b) MAP staining (green), (c) RPTPγ staining (red), and (d) the merge. The rows of panels (from the top) show images of the CA1, CA2, CA3, and DG regions. In the low-magnification images, the gold squares delineate the ROIs into which we zoomed-in the three higher-resolution panels to the right. Within the CA regions, we annotate the SO, SP, and SR. Within the DG, we annotate the ML and SG. Note that the neuronal MAP2 marker (green) colocalizes with RPTPγ (red), as indicated in yellow in the merged images, acquired at both low and high magnification. (B) Astrocytes in representative examples of low- and high-magnification images of RPTPγ immunostained tissue. The protocol and presentation are the same as in (A), except that here we used GFAP staining (green) to identify astrocytes. Note that the green GFAP-positive cells and processes (i.e., astrocytes) in the CA1-3 regions and DG lack the red RPTPγ staining. The magnified ROIs further highlight that only the neuropil surrounding GFAP-positive cells (i.e., presumably neurons) faintly stains for RPTPγ. Scale bars in all panels represent 10 μm.
In parallel sections, we stained astrocytes with anti-GFAP (Figure 4B, green) and observed no colocalization of RPTPγ (red) throughout the CA1, CA2, CA3, or DG with GFAP-positive cells (i.e., astrocytes) or processes. Positive RPTPγ staining was only diffusely visible in the surrounding neuropil.
Adult HC tissueFinally, following our approach for cultures and pups, we examined RPTPγ expression in native adult (8- to 12-week-old animals) HC tissue. We found expression patterns for RPTPγ (Figure 5A) that are nearly identical to what we observed in the P0–P2 pup tissue. In particular, RPTPγ colocalizes strongly with MAP2-positive cells (i.e., neurons) in the CA1–3 SP HC regions. In the DG, RPTPγ staining localizes to the soma of the granule cell within the SG.
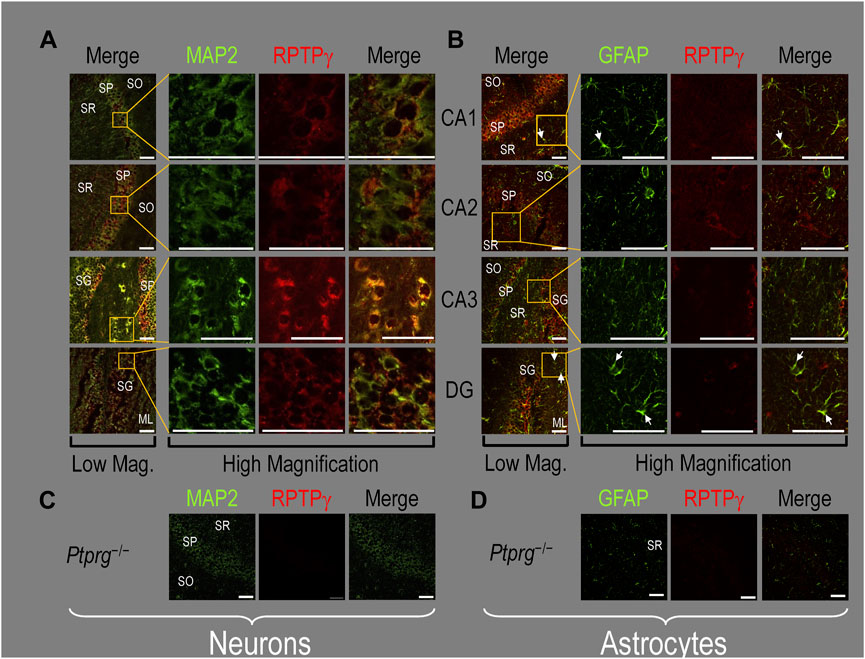
Figure 5. RPTPγ protein expression in adult HC tissue from WT and Ptprg-/- mice. (A) Neurons in representative examples of low- and high-magnification images of RPTPγ immunostained tissue from WT mice. The columns of panels (from the left) show (A) low-magnification merged images of MAP2 staining (green; individual images not shown) and RPTPγ staining (red; individual images not shown), and then three columns of high-magnification zoomed-in images representing (B) MAP staining (green), (C) RPTPγ staining (red), and (D) the merge. The rows of panels (from the top) show images of the CA1, CA2, CA3, and DG regions. In the low-magnification images, the gold squares delineate ROIs, into which we zoomed-in the three higher-resolution panels to the right. Within the CA regions, we annotate the SO, SP, and SR. Within the DG, we annotate the ML and SG. Note that the neuronal MAP2 marker (green) colocalizes with RPTPγ (red), as indicated in yellow in the merged images, acquired at both low and high magnifications. (B) Astrocytes in representative examples of low- and high-magnification images of RPTPγ immunostained tissue. The protocol and presentation are the same as in (A), except that here we used GFAP staining (green) to identify astrocytes. Note that the green GFAP-positive cells and processes (astrocytes; e.g., see white arrows) in the CA1-3 regions and DG lack the red RPTPγ staining that appears only in neighboring neuronal processes. The magnified ROIs further highlight that only the neuropil surrounding GFAP-positive cells (i.e., presumably neurons) faintly stains for RPTP. (C) Neurons in representative examples of low-magnification images of RPTPγ immunostained tissue from Ptprg-/- mice. Here, we validate the chicken IgY RPTPγ antibody. The protocol and presentation are the same as in (A). (D) Astrocytes in representative examples of low-magnification images of RPTPγ immunostained tissue from Ptprg-/- mice. The protocol and presentation are the same as in (B). Scale bars in all panels represent 10 μm.
In adult mouse HC tissue stained for GFAP (Figure 5B, green), but not for MAP2, we consistently observed GFAP-positive cells (i.e., astrocytes) to be devoid of RPTPγ staining (red). Rarely, and especially at low magnification, we observe yellow pixels in a merged image (i.e., GFAP from astrocytes plus RPTPγ). The yellow could reflect (a) a neuron and an astrocyte in the same optical section or (b) the rare astrocyte that expresses RPTPγ (see Discussion). Nevertheless, the dominant pattern is that GFAP-positive cells are RPTPγ negative. GFAP-positive astrocyte soma and, in some cases, the early branches of their processes are most clearly visible in the CA1–3 SR in the high-magnification ROIs of Figure 5B, where GFAP and RPTPγ do not appear to colocalize within individual cells or cell processes.
To validate the RPTPγ chicken IgY antibody, we immunostained adult Ptprg−/− HC sections following the same protocols as used in Figures 4A, B, 5A, B. After counterstaining with either MAP2 (Figure 5C) or GFAP (Figure 5D), we did not observe any non-specific signal from the anti-RPTPγ chicken IgY.
RPTPζIdentification of novel RPTPζ variants in mouse hippocampusAnalysis of Ptprz1 transcripts, as known at the initiation of the present studyThe mouse Ptprz1 gene (Gene ID: 19283) contains 30 exons on chromosome 6. When the present investigation commenced, the NCBI RefSeq database contained four validated murine splice variants (i.e., V1, V3, V4, and V5) that had also been described by Fujikawa et al. (2017) and five hypothetical transcript assemblies (i.e., X1 through X5).
Here, we define exon 12 as the full-length exon. We propose the names 12“a” and 12“b” for the shorter alternative exons that arise from splicing at one of two splice sites within exon 12, such that 12“a” is entirely within 12 and 12“b” is entirely within 12“a”.
Ptprz1-V1 (Exons 1–12). Variant 1 (Ptprz1-V1, [NM_011219]) is encoded by exons 1–12 (Figure 6A; Table 3). V1 is the only variant to utilize the 5479-nt exon 12 that, due to the presence of the 5456AAUAAA5461 cleavage and polyadenylation specificity factor binding site, will be cleaved and polyadenylated 18-nt downstream, preventing its splicing to any additional exons. Utilization of exon 12 in Ptprz1-V1 results in the ORF continuing only as far as an in-frame amber (TAG) stop codon, located at a position analogous to 3-nt downstream from the exon 12/13 splice site in V3. The remainder of the Ptprz1-V1 mRNA, downstream of the amber (TAG) stop codon, consists of a 1,938-nt 3′-UTR. At the protein level, V1 encodes an RPTPζ variant that has 1,211 amino acids between the end of the FNIII domain and the termination of the protein, which lacks transmembrane and phosphatase domains (Figure 6B). Thus, V1 is secreted (S) into the extracellular fluid. Fujikawa et al. (2017) originally designated V1 as PTPRZ-S to reflect the ultimate fate of the protein.
留言 (0)