Experimental animals
All experiments were conducted in accordance with the IMPROVE guidelines for animal experimentation [10] and reported based on ARRIVE guidelines [11]. The study was approved by the regional government authorities (Landesamt für Natur, Umwelt und Verbraucherschutz NRW, LANUV) and guided by the German Welfare Act (German Ministry of Agriculture, Health, and Economic Cooperation). Male C57BL/6J mice were purchased from Charles River (Sulzfeld, Germany) and housed in a temperature- and humidity-controlled, specific pathogen-free animal facility with a 12-h light-dark cycle, as well as food and water available ad libitum. Mice were randomly assigned to experimental groups by investigators not involved in the data acquisition or analysis. All efforts were made to minimize animal suffering and the number of animals used. Surgeries, treatments, and data analyses were performed by investigators blinded to the experimental animals. Experimental analyses were mainly limited to male mice for reasons of consistency with previous studies, in which we evaluated the effects of PK inhibition on ischemic injury and neurological outcome in the acute stroke phase in male mice [9].
Ischemia model and neurological assessment
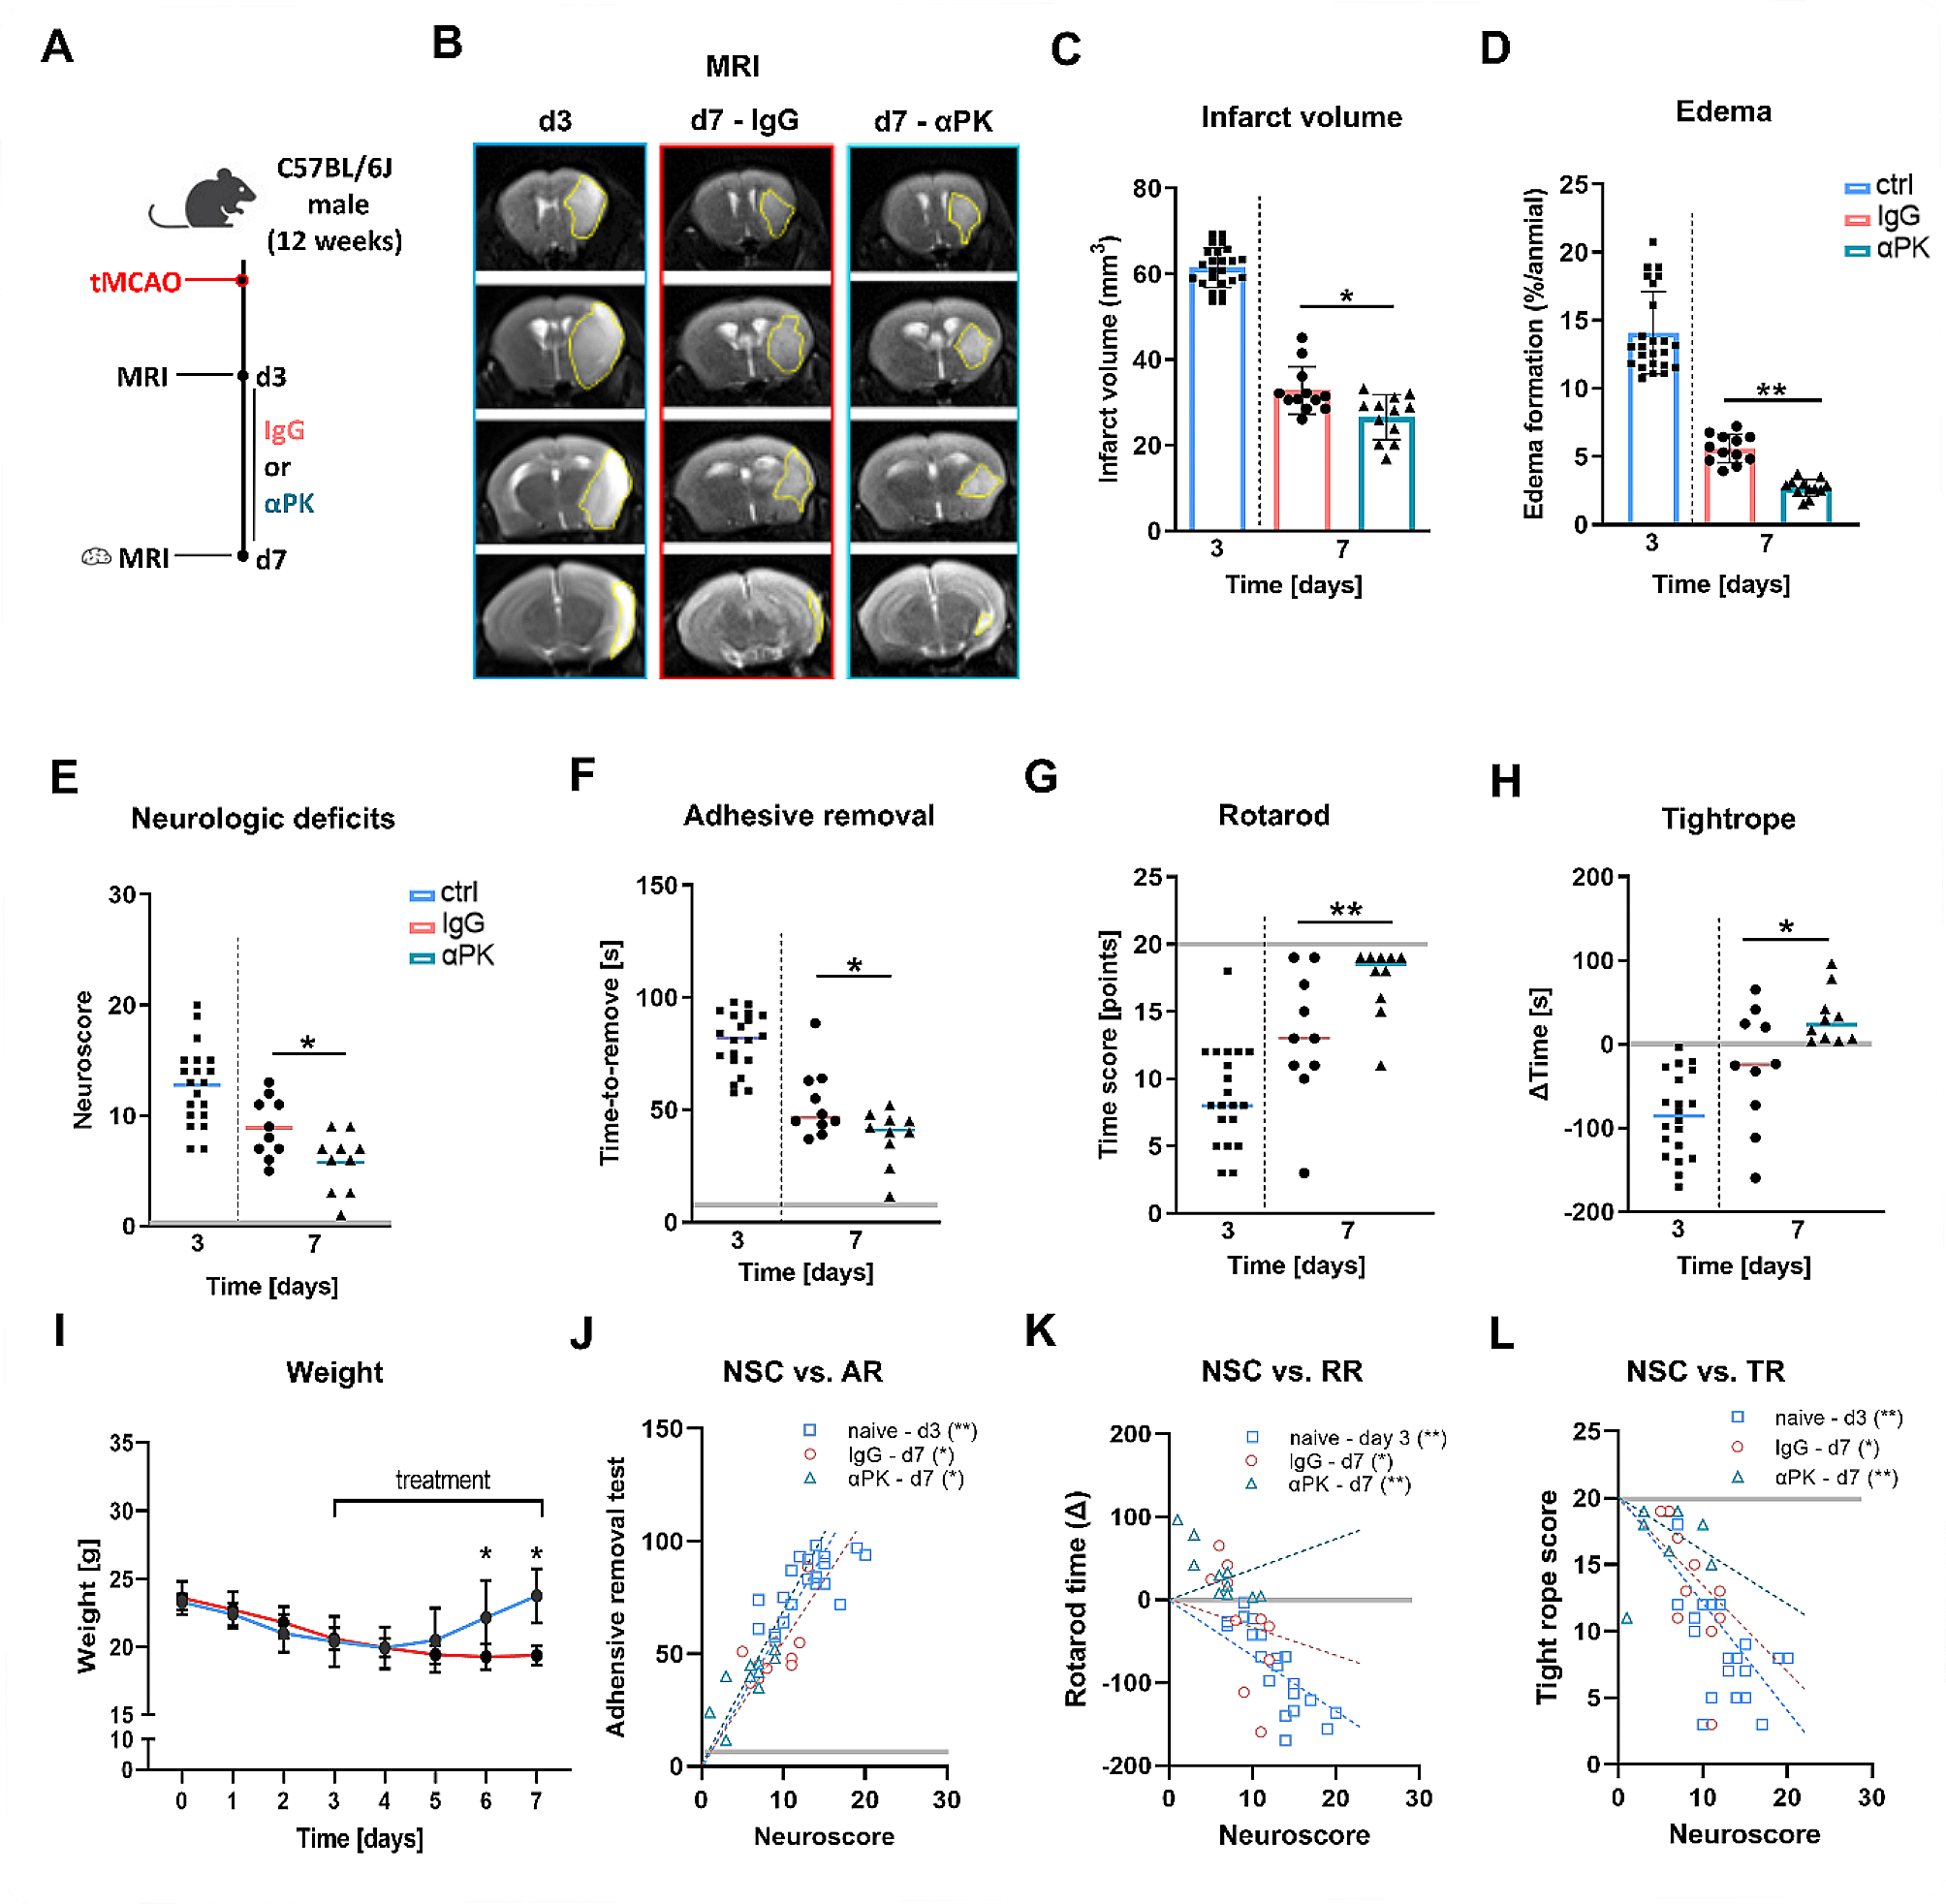
In 10-12-week-old mice, focal cerebral ischemia was induced by tMCAO for 60 min occlusion time [12]. Mice were anesthetized with 4% isoflurane (Piramal) in 100% oxygen for 3–5 min (World Precision Instruments, Small Animal Anesthesia System, EZ-7000). Anesthesia was maintained with ∼ 2% isoflurane, and body temperatures were kept at 37 °C during surgery, using a feedback-controlled warming device (World Precision Instruments, Small Animal Anesthesia System, EZ-7000). Occlusion of the middle cerebral artery (MCA) was induced as described [12]. In brief, the filament (#602112PK5Re, Doccol) was introduced to the MCA via the external carotid artery with a reopening of transient ligation at the common carotid artery to ensure full reperfusion. Cerebral blood flow was measured for successful occlusion and reperfusion using Laser Doppler flowmetry (PeriFlux 6000, Perimed, Järfälla, Sweden). Neurological deficits following tMCAO were measured utilizing a modified version of the neuroscore [13]. This score is composed of a global and focal deficit subscore. Points covered by the global score include spontaneous activity and fur abnormalities, while focal deficits encompass body symmetry, gait circling behavior, symmetry of paws and body, and whisker response. In this study, we used the combined score. Motor strength, sensorimotor coordination, and endurance were measured using the rotarod (RR) test (Rotarod Advanced for Mice, TSE Systems, Germany) [14], adhesive removal (AR) test [14], and the tightrope (TR) test [15], which were performed as recently described by our group [16]. Better behavioral results were reflected by higher point or time scores in the RR and TR tests. In the AR test and the modified neuroscore, less time or lower point scores were indicative of a better behavioral performance. All analyses were carried out in a day 3 and day 7 time frame after tMCAO.
MRI scanning and analyses
To analyze infarct volume and identify intracerebral bleeding, we performed serial stroke assessment using magnetic resonance imaging (MRI) with a 3 Tesla MRI unit (Biograph mMR, Siemens Healthineers, Erlangen/Germany) on days 3 and 7 after tMCAO. We used dual channel surface coils designed for animal experimentation (Rapid Biomedical GmbH, Rimpar/Germany). The imaging protocol included a coronal T2-weighted, turbo spin-echo (TSE) sequence (resolution 0.2 × 0.2 × 0.8 mm³, 15 slices, TE = 105 ms, TR = 1660 ms, TA = 3:47 min) to identify infarct volume, and a susceptibility-weighted, coronal T2-weighted gradient echo sequence (SWI, 0.1 × 0.1 × 0.2 mm³, 40 slices, TE = 20.6 ms, TR = 38 ms, TA = 6:01 min) to detect hemorrhage. Refined localization was done with the help of short T1-weighted TSE sequences along each axis (0.2 × 0.2 × 1 mm³, seven slices, TA = 17 s). Brain edema and infarct were measured from MRI coronal T2 images. Percentage brain edema was calculated based on the following equation: ([ipsilateral hemisphere volume – contralateral hemisphere volume]/[contralateral hemisphere volume]) × 100. Edema was calculated as follows: ([contralateral hemisphere volume] – [ipsilateral hemisphere volume]) x100. By multiplying the area of tissue loss by the distances between selected brain sections, brain infarct volume and volume of tissue loss was determined. Only mice without bleeding and comparable infarct volume between 50 and 70 mm3 on day 3 were included in the experiment. Infarct sizes were additionally visualized using triphenyl tetrazolium chloride (TTC) and hematoxylin and eosin (H&E) staining. Of 63 mice with tMCAO, 54 were included in the final analysis (n = 18 each group). 9 mice were excluded due to either hemorrhagic transformation or inconsistent infarct sizes.
Pharmacological intervention
Based on the MRI infarct volume calculation on day 3, animals with comparable infarct sizes (50–70 mm3) were included for further experimentation. Animals were randomly assigned to treatment groups from outside assistance not involved in data acquisition or analysis. Antibodies to block PK (αPK, Ab1006, Abcam) or its corresponding isotype control (immunoglobulin G (IgG); BioLegend) were administered intravenously (tail vein) as follows: 400 µg/kg on days 3 and 4 and 200 µg/kg at days 5 to 7 after stroke induction. The antibody concentration was based on our previous study of PK inhibition in the acute phase of ischemic stroke [9].
Enzyme-linked immunosorbent assay (ELISA)
To investigate activation of the KKS after tMCAO in respective treatment conditions, we measured serum levels of PK (Arigo ARG82751) and bradykinin (Phoenix Pharmaceuticals, EK-009-01) and proceeded as described in the manufacturer’s protocol. Inflammatory cytokines (IL-1β, IL-6, RANTES, MCP-1, MCP-2, GM-CSF, TNFα), degradation markers (MMP-2, MMP-9) and angiogenic markers (VEGF, PDGFb) were measured using R&D Systems customized LUMINEX plates. Samples were processed according to the manufacturer’s protocol, measured with a MAGPIX Luminex device and the data analyzed with the Luminex xPONENT software.
Flow cytometry
Animals were euthanized and perfused with cold saline. Brains were dissected into the ipsilateral (left) and contralateral (right) hemisphere. Immune cells were isolated using the Neural Tissue Dissociation Kit™ (Miltenyi Biotec) and a gentleMACS dissociator with heaters (Miltenyi Biotec), following the manufacturer’s instructions. Fluorochrome compensation was performed with BD Diva integrated compensation matrix and single-stained, mixed-tissue controls. Flow cytometric analysis was performed on the FACSAria III flow cytometer (BD Bioscience). Data analyses were performed using FlowJo software. Antibodies were used as following: anti-CD3 PacBlue (100,214, Biolegend, 1:400), anti-CD45-HorizonV500 (561,487, Biolegend, 1:400), eFluor 780 Viability dye (103,210, Thermo Fisher, 1:400), anti-CD11b-APC (101,212, Biolegend, 1:400), and anti-Ly6G-PerCP-Cy5.5 (127,615, Biolegend, 1:400).
Histological and western blot analyses
Coronal brain sections were subjected to immunofluorescence staining as described previously [16]. The following primary antibodies were used for histological stainings: anti-PK (αPK; ab1006, Abcam, 1:200), anti-zonula occludens (ZO)-1 (ab216880, Abcam, 1:200), anti-Claudin-5 (ab131259, Abcam, 1:200), anti-occludin (ab216327, Abcam, 1:200), anti-CD31 (mca2388, BioRad, 1:100), anti-GPIX (M052-0, Emfret, 1:100), anti-albumin (ab207327, Abcam, 1:200), anti-bradykinin-1 receptor (B1R; ABR-011, Alomone Labs, 1:200), anti-CD11b (MCA74G, Biorad, 1:200, unfixed tissue) and anti-NG2 (ab5320, Millipore, 1:200). All secondary antibodies were diluted 1:1000. Fluorescence stainings were visualized using a Leica DMi8 microscope, Hamamatsu C11440-22 CU camera, and Leica Application Software X (LasX 3.0.2.16120). Images were processed using Image J (National Institutes of Health). Western blot analyses using anti-GP1bα (M043-0, Emfret, 1:200) was performed as previously described [9].
Quantitative real-time PCR analyses
To analyze transcriptional changes in the brain or purified endothelial cells from tMCAO animals, real-time polymerase chain reaction (PCR) was performed. The procedure of using the SYBR green system (Promega, A6001) was as previously described [17] and processing took place on a QuantStudio 3 RT-PCR machine (Life Technologies). In brief, endothelial cells were isolated from the ipsilateral hemisphere of tMCAO mice using Kit1 for dissociation of inflamed neural tissue (Miltenyi Biotec, #130-110-201). Endothelial cells were then purified using the CD31 MicroBeads isolation kit (Miltenyi Biotec, #130-097-418). For both the whole brain sections and the purified cells, mRNA was isolated (RNeasy MicroKit, Qiagen, 74,004) and converted into cDNA (QuantiTect Reverse Transcription Kit, Qiagen, 205,311), as per the manufacturer’s protocol. The following sequence-specific sense (sen) and antisense (ase) primers were designed to measure mRNA expression levels: arginase 1 (Arg-1; Fwd CAT TCT TCG CTG CCA TTC TG; Rev GCA CAT TGC CCA TGT TGA ATC), Ras-related C3 botulinum toxin substrate 1 (Rac1; Fwd GGG GAT CCC AGG CCA TCA AGT GTG TGG TGG; Rev GGA ATT CTT ACA ACA GCA GCA GGC ATT TTC TCT TCC), vascular endothelial growth factor (VEGF; Fwd GGA GAT CCT TCG AGG AGC ACT T; Rev GGC GAT TTA GCA GCA GAT ATA AGA A), Rho-associated kinases (ROCK; Fwd AAC ATG CTG CTG GAT AAA TCT GG; Rev TGT ATC ACA TCG TAC CAT CCT), alpha-5 integrin (α5; Fwd TGT CAC CGT CCT TAA TGG; Rev CAT TGT AGC CGT CTT GGT), β-actin (Fwd CCA AGG CCA ACC GCG AGA AGA TGA C; Rev AGG GTA CAT GGT GGT GCC GCC AGA C), and glyceraldehyde-3-phosphate dehydrogenase (GAPDH; Fwd AGG TCG GTG TGA ACG GAT TTG; Rev TGT AGA CCA TGT AGT TGA GGT C). Relative target mRNA expression was normalized to the geometric expression average of the housekeeping genes β-actin and GAPDH. We applied each sample in two technical replicates for each data point. The mean cycle threshold (Ct) was used in the equation for the housekeeping genes and Ct for the genes of interest.
Statistical analysis
Sample sizes for animal studies were determined using power analyses, allowing us to detect differences with 80% power at the expected effect sizes and with the expected variance observed in that assay. The expected effect size was 0.5. Power analyses were primarily based on our previous work in preclinical stroke [6,7,8,9]. The type I error rate was limited using an α level of 5%, with Bonferroni’s adjustment for pairwise comparisons. Results are presented as mean ± standard deviation. Of note, explanatory schematics were created with biorender. GraphPad Prism software (v9.0.0) was used for statistical analyses and visualization of the results. To evaluate the normal distribution of the data sets, we performed the D’Agostino-Pearson test. The 2-tailed Student’s t-test was used for normally distributed data if applicable; otherwise, we used the Mann-Whitney U test for non-normally distributed datasets. The differences among multiple groups were analyzed using 1-way or 2-way ANOVA or non-parametric Kruskal-Wallis tests as appropriate. Differences between groups were assessed with post hoc Bonferroni (comparisons between all conditions), Dunnett (all conditions compared with a control group), or Dunn’s (following Kruskal-Wallis) tests. In all analyses, a P-value ≤ 0.05 was considered statistically significant.


留言 (0)