
記住我


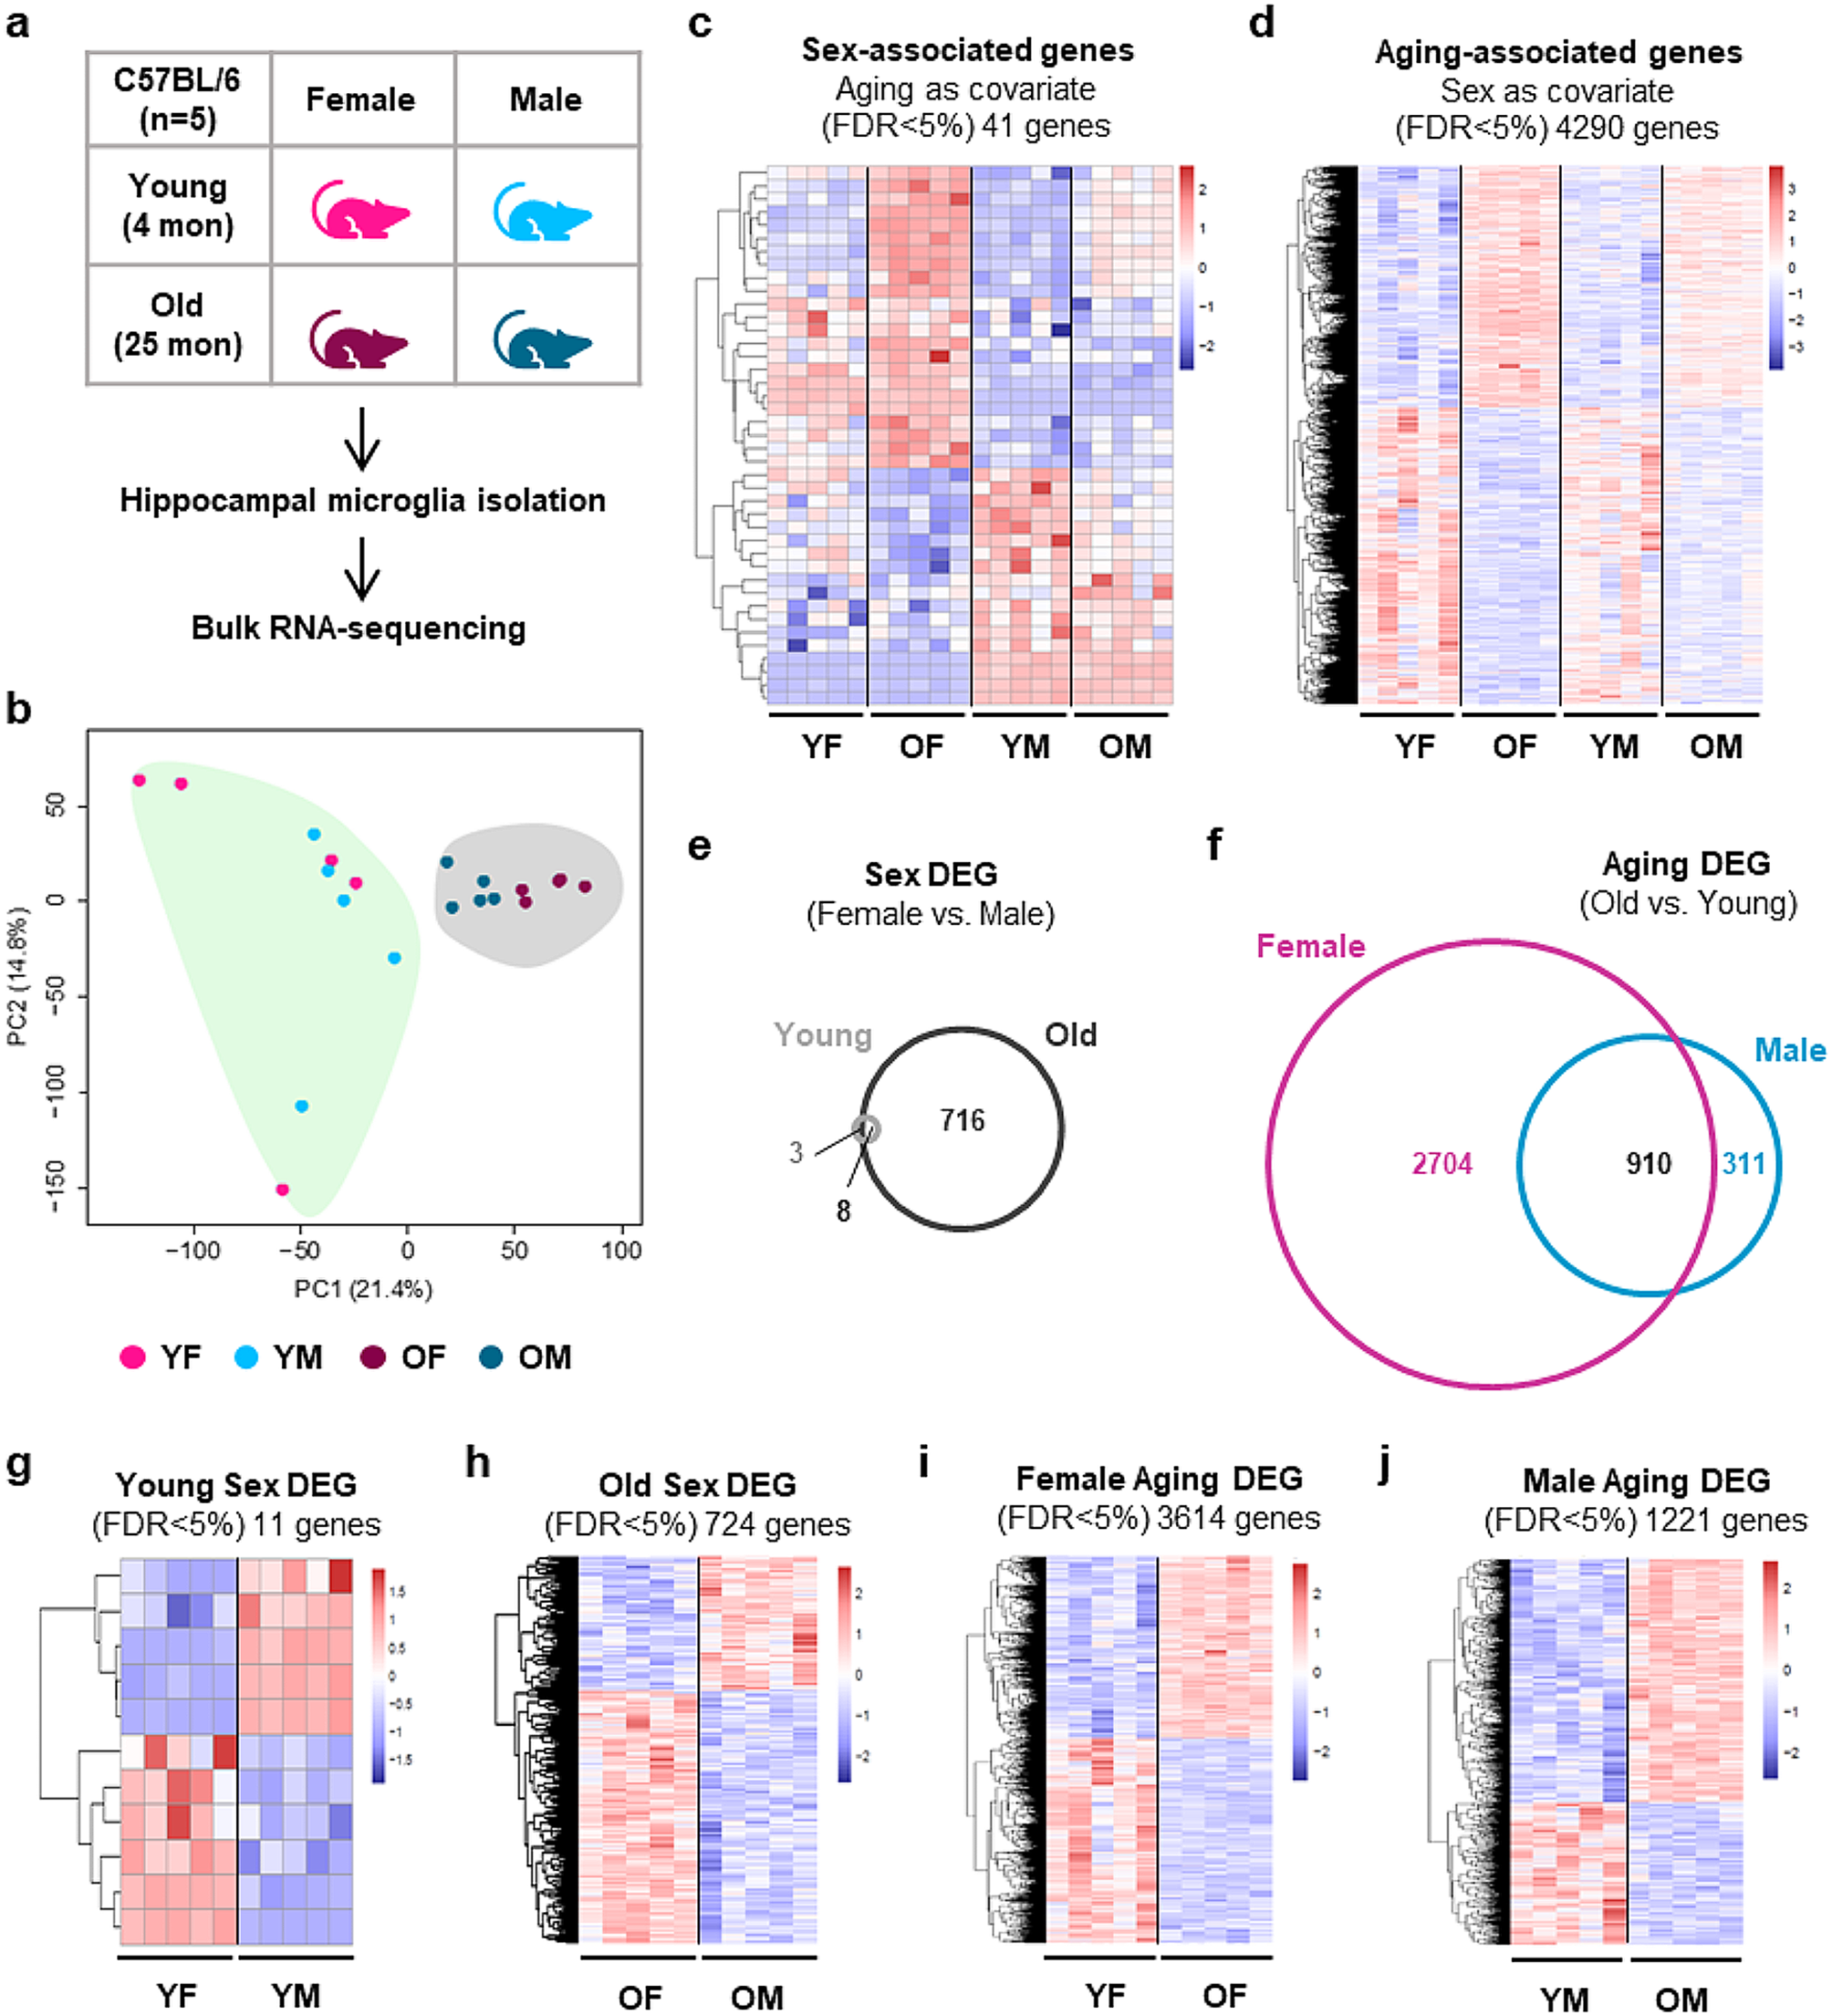
To understand how aging impacts microglial gene expression, we performed bulk RNA-sequencing of hippocampal microglia isolated from healthy young (4-month) and old (25-month) mice of both sexes, which allowed us to define differences between young and old, as well as male and female mice (Fig. 1a and Suppl. Figure 1a). Principal component and multi-dimensional scaling analyses revealed clear separation of young and old microglia, with further separation of males and females among the old mice, demonstrating that aging affects the transcriptome of microglia in both sexes, with a stronger effect in females than males (Fig. 1b and Suppl. Figure 1b). Consistent with this, analysis using multivariate linear modeling revealed that age drives stronger variation in gene expression than sex, with 41 sex-associated genes with age as a covariate (FDR < 5%; 23 upregulated and 18 downregulated in female microglia) and 4,290 aging-associated genes with sex as a covariate (FDR < 5%; 1,925 upregulated and 2,365 downregulated in old microglia) (Fig. 1c, d and Additional File 1a, b). Moreover, pairwise analyses revealed more differentially expressed genes (DEG) between old and young in female microglia than in male microglia (Aging DEG; old versus young for each sex), and more Sex DEG (female versus male for each age) in old microglia than young microglia (Fig. 1e-j, Suppl. Figure 1c and Additional File 1c-h).
Fig. 1
Aging and sex differences in the transcriptomes of hippocampal microglia. (a) Scheme of transcriptome analysis of hippocampal microglia from young (4-month) and old (25-month) mice. (b) Principal Component Analysis (PCA) of RNA expression by young and old microglia (bulk RNAseq). (c) Heatmap of significant (DESeq2, FDR < 5%) sex-associated genes (with age as a covariate). (d) Heatmap of significant (DESeq2, FDR < 5%) aging-associated genes (with sex as a covariate). (e-f) Venn diagram (plotted using BioVenn [54] of differentially expressed genes (DEG; DESeq2, FDR < 5%) showing the number of Sex DEG in old and young microglia (e) and the number of Aging DEG in female and male microglia (f). (g, h) Heatmaps of Sex DEG (FDR < 5%) comparing young female with young male (g) and old female with old male (h). (i, j) Heatmaps of Aging DEG (FDR < 5%) comparing young female with old female (i) and young male with old male (j). (Y, young; O, old; F, female; M, male)
mTOR-related pathways are more active in hippocampal microglia during aging, especially in femalesWe next performed Ingenuity Pathway Analysis (IPA) to predict the functional impact of the differential gene expression. Interestingly, mTOR-related pathways, including PI3K/AKT signaling, which promotes mTOR activation, as well as downstream signaling pathways (eIF2 signaling, and regulation of eIF4 and p70S6K signaling), were significantly different in microglia from old mice versus young mice (aging-associated genes with sex as covariate; Suppl. Figure 2a, b and Additional File 2a) and in old female and old male mice compared their young counterparts (Aging DEG; Fig. 2a, b and Additional File 2b, c). Positive z-scores indicated that these pathways are more active in old microglia than young microglia. Increased mTOR and eIF2/4 signaling is consistent with a recent report of enhanced mTOR-dependent translation of inflammatory proteins in old microglia, in which only female microglia were assessed [20]. Interestingly, our data indicate that these pathways are more active in old female microglia than old male microglia (Sex DEG in old microglia; Fig. 2c and Additional File 2d).
Fig. 2
Increased mTOR-related activity and a shift to glycolysis in old hippocampal microglia, especially in females. (a-c) Metabolic pathways revealed by Ingenuity Pathway Analysis (IPA) of Aging DEG identified by comparing old versus young female (a) and old versus young male (b), and Sex DEG in old female versus old male microglia (c). Dashed line: -log10 (p-value) cutoff of 1.3 (p < 0.05). (d) Heatmap of Hif1a and glycolysis-related gene expression by young and old, female and male microglia (n = 5/group). (e) mTOR phosphorylation in microglia (Iba-1+) in the hippocampus. Quantification of p-mTOR/Iba-1 colocalization (% of YF) is shown. n = 7/group. Data are presented as mean (SD). *p < 0.05, ****p < 0.0001 (two-way ANOVA). (f-k) Microglia from the hippocampus and cortex were pooled and their metabolic activity was assessed using Seahorse assays. Basal and compensatory glycolysis were evaluated by treating with rotenone/antimycin A and 2-DG, and calculating the glycolytic Proton Efflux Rate (glycoPER). Old female microglia were compared to young female microglia (f, g), old male microglia were compared to young male microglia (h, i), and old female microglia were compared to old male microglia (j, k). #p < 0.05, ##p < 0.01 (unpaired t-test)
IPA analysis also predicted increased HIF1α signaling and glycolysis in old microglia, with stronger activity of these pathways in old female microglia than their male counterparts (Fig. 2a-c, Suppl. Figure 2b and Additional File 2a-d). Consistent with this, expression of Hif1a, another key mTOR target, increased with aging, notably more in female microglia than male microglia (Fig. 2d and Suppl. Figure 2c). We also observed a stronger aging-associated increase in Hif1a expression in females in recently published datasets assessing CD11b+ hippocampal microglia (RNAseq) and Cx3cr1-expressing hippocampal microglia (NuTRAP analysis of translating RNA) [21] (Suppl. Figure 2d).
HIF1α is implicated in cellular metabolic adaptation by inducing glycolysis [22, 23], and metabolic reprogramming plays a crucial role in microglial effector functions [17, 24]. We therefore assessed HIF1α-dependent glycolysis genes and found significantly higher expression of most of the enzymes that catalyze glucose conversion to pyruvate in old microglia, with stronger increases in females than males (Fig. 2d and Suppl. Figure 2c, e). We also observed increased expression of lactate dehydrogenase A (encoded by Ldha), which converts pyruvate to lactate to sustain rapid flux through glycolysis, maintaining nicotinamide adenine dinucleotide (NAD+) levels in the cell (Fig. 2d and Suppl. Figure 2c). In contrast, expression of lactate dehydrogenase B (encoded by Ldhb), which catalyzes the opposite reaction [25], was lower in old female microglia than young female microglia, consistent with more active glycolysis (Fig. 2d and Suppl. Figure 2c). Taken together, our transcriptomic analyses suggested increased activity of mTOR-related pathways in hippocampal microglia during aging, especially in females.
Microglial metabolism shifts to glycolysis during aging, especially in femalesMicroglia, like other immune cells, encounter a variety of environmental conditions, requiring them to have a dynamic range of metabolic adaptation pathways. Metabolic pathways are linked to the effector functions of immune cells [26]. For instance, resting macrophages mainly rely on mitochondrial respiration to generate ATP, but during classical activation (e.g. in response to LPS stimulation), macrophage metabolism shifts from oxidative phosphorylation to aerobic glycolysis to facilitate a rapid response. Disrupted metabolic adaptation leads to microglial dysfunction in AD [17], but our understanding of microglial metabolism during healthy aging remains unclear.
Given that mTOR – HIF1α – Glycolysis-related signaling pathways are significantly enriched in old microglia, we next monitored metabolic dynamics of microglia isolated from the hippocampus and cortex of healthy young (3-4-month) and old (22-24-month) mice. We first confirmed increased mTOR phosphorylation in old microglia, especially in female mice (Fig. 2e and Suppl. Figure 3a). We next performed Seahorse XF assays to assess glycolysis and mitochondrial function by real-time measurement of changes in the glycolytic proton efflux rate (glycoPER) and the oxygen consumption rate (OCR), respectively. In female microglia, we observed increased basal and compensatory glycolysis upon aging (Fig. 2f, g and Suppl. Figure 3b). In male microglia, there was a trend towards increased basal and compensatory glycolysis in old microglia, but it was not significant (Fig. 2h, i and Suppl. Figure 3c). Since many of the glycolysis-related genes were more strongly upregulated in old female microglia (Fig. 2d and Suppl. Figure 2c), we also directly compared old female and old male microglia and observed higher basal and compensatory glycolysis in old female microglia (Fig. 2j, k and Suppl. Figure 3d).
We also monitored mitochondrial function. In female microglia, we observed reduced basal respiration and ATP production (Suppl. Figure 3e, f), and in male microglia, there was a significant reduction in ATP production with aging (Suppl. Figure 3 g, h). In line with these differences, we found that several TCA cycle genes were significantly downregulated in old microglia, particularly in females, including Idh2, Idh3a, Ogdh, and Ogdhl (Suppl. Figure 3i-k). Interestingly, the downregulated genes are mostly involved in converting isocitric acid to α-ketoglutaric acid, and α-ketoglutaric acid to succinyl CoA; these steps are responsible for generating the electron carrier NADH, which transports electrons to the electron transport chain [27]. Taken together, these data demonstrate a metabolic shift to glycolysis during microglial aging that is more pronounced in females.
Neuroprotective DAM are glycolytic and more abundant in female mice during agingIPA analysis also predicted that old microglia of both sexes are more phagocytic than their young counterparts, and that old female microglia are more phagocytic than old male microglia (Fig. 3a and Additional File 2b-d). Consistent with this, the KEGG Lysosome pathway was elevated in GSEA analysis of old female and old male microglia compared to their young counterparts, and in old female versus old male microglia (Suppl. Figure 4a-c and Additional File 2e-g). Notably, we observed stronger upregulation of Cd68, Lamp1 and Lamp2 expression in females during aging (Fig. 3b).
Fig. 3
Increased phagocytic activity and more abundant DAM among old female microglia. (a) Phagocytosis pathways identified by performing IPA analysis of old versus young female, old versus young male, and old female versus old male microglia. Dashed line: -log10 (p-value) cutoff of 1.3 (p < 0.05). (b) Expression of the lysosomal genes Cd68, Lamp1, and Lamp2. Data are presented as mean (SD) FPKM values. n = 5/group. *p < 0.05, **p < 0.01, ***p < 0.001, ****p < 0.0001 (two-way ANOVA). (c, d) Heatmaps showing expression of DAM1 and DAM2 genes [7] (c) and DAM-conserved genes [29] (d) by young and old, male and female hippocampal microglia. (e) Violin plots with median lines showing expression of Aging DEG common to both sexes, Female Aging DEG, and Male Aging DEG (defined in our bulk RNAseq analysis) by homeostatic microglia (both young and old) and DAM (only prevalent in old mice), assessed by analysis of a previously published scRNAseq dataset (female mice) [7]. (f) Lysosomal gene expression by young and old homeostatic microglia and old DAM. Dot size shows percentage of cells expressing the genes, and the color intensity scale indicates average gene expression by all cells in the cluster. (g) ‘Reactome_Glycolysis’ gene set gene expression by homeostatic microglia (young and old) and old DAM. (h-k) Lysosomal gene and ‘Reactome_Glycolysis’ gene set expression by microglia from wild-type (WT) and 5XFAD mice (reanalyzed from [7]). Comparisons of WT and 5XFAD homeostatic microglia with 5XFAD DAM from male and female mice (1 male and 2 females; h, i), and homeostatic microglia and DAM1 and DAM2 subsets (1 male and 2 females combined; j, k) are shown. (l, m) DAM were evaluated by quantifying colocalization of CD68 puncta in hippocampal microglia (Iba-1+; l); numbers of Iba-1+ hippocampal microglia are also shown (m). n = 5/group. Data are presented as mean (SD). *p < 0.05, **p < 0.01 (two-way ANOVA); #p < 0.05 (unpaired t-test)
A subset of neuroprotective microglia known as disease-associated microglia (DAM), which are more phagocytic, increases in neurodegenerative disease models (e.g. AD and ALS), as well as during healthy aging [7, 15, 28]. Both Cd68 and Hif1a are DAM genes [7], so we hypothesized that DAM are more glycolytic and that the stronger upregulation of HIF1α expression and signaling among old female microglia compared to their male counterparts, as well as their higher glycolytic rate, could reflect more abundant DAM in the female hippocampus.
DAM have been reported to form upon sequential conversion of homeostatic microglia to DAM1 and then DAM2 (Trem2-independent and -dependent steps, respectively) [7]. We observed gene expression changes consistent with the formation of DAM1 and DAM2 during aging in our bulk RNAseq dataset, and in recently published transcriptomic and translatomic datasets [21], with stronger differences in females than males (Fig. 3c and Suppl. Figure 4d, e and 5a, b). We also observed stronger upregulation of “DAM-conserved” genes (defined to distinguish neuroprotective DAM from inflammatory microglia) [29] in old female microglia compared to their male counterparts (Fig. 3d).
Assessment of homeostatic microglia (both young and old) and DAM (only prevalent in old mice) in the scRNAseq dataset that defined them [7] (Suppl. Figure 5c, d) revealed that the changes in gene expression we observed in old microglia of both sexes, including the lysosomal genes, were specifically altered in DAM in old mice (Fig. 3e, f). Similarly, glycolysis gene expression was higher in DAM than in homeostatic microglia (Fig. 3g). Evaluation of microglia from the 5XFAD model of early onset AD also revealed higher lysosome and glycolysis gene expression in DAM than homeostatic microglia (Fig. 3h, i and Suppl. Figure 5e, f). These changes were evident in both male and female mice (Fig. 3h, i), and further analysis of the DAM1 and DAM2 subsets revealed that the changes were strongest in DAM2 microglia (Fig. 3j, k).
We therefore performed immunohistochemistry using CD68 as a DAM2 marker [7] to evaluate whether the higher expression of DAM genes in old female microglia reflects a larger proportion of DAM2 in old female mice. We observed more CD68+ microglia in old female mice than old male mice (Fig. 3l, m and Suppl. Figure 5 g). Thus, our data collectively attribute the stronger aging-associated metabolic shift among female hippocampal microglia to more abundant DAM.
C3a – C3aR signaling in microglia promotes glycolysisTo gain insight into the potential mechanisms underlying altered microglial metabolism during aging, we reviewed our GSEA analysis (Additional File 2e-g) and noticed that ‘KEGG: Complement and coagulation cascades’ is one of the significantly impacted pathways in old microglia (Suppl. Figure 6a-c). IPA analysis also predicted more active complement pathways in old microglia of both sexes, with stronger activity in old female microglia compared to old male microglia (Fig. 4a and Additional File 2b-d). Complement factors, receptors and regulators were all impacted by aging (Fig. 4b and Suppl. Figure 6d, e). C1qa, C1qb and C1qc, which are involved in triggering the classical complement cascade [30], were significantly upregulated in old microglia, particularly in females (Suppl. Figure 6d, e), but most notably, C3 was dramatically elevated in old microglia of both sexes, and its expression was significantly higher in old female microglia than their male counterparts (Fig. 4b). We also observed similar female-biased aging-associated changes upon analysis of recently published [21] transcriptomic and translatomic datasets (Suppl. Figure 6f, g).
Fig. 4
Altered expression of complement pathway components by old hippocampal microglia, especially in females. (a) Complement System pathway identified by performing IPA analysis of old versus young female, old versus young male, and old female versus old male microglia. Dashed line: -log10 (p-value) cutoff of 1.3 (p < 0.05). (b) Expression of the complement pathway genes C3, C3ar1, Cd55 and Ctsl. Data are presented as mean (SD) FPKM values. n = 5/group. (c) Complement gene expression by homeostatic (young and old) microglia and old DAM [7]. Dot size shows the percentage of cells expressing the genes, and the color intensity scale indicates average gene expression by all cells in the cluster. (d, e) Complement gene expression by WT and 5XFAD homeostatic microglia and 5XFAD DAM from male and female mice (1 male and 2 females; d), and homeostatic microglia and DAM1 and DAM2 subsets (1 male and 2 females combined; e) [7]. (f, g) C3aR protein expression in the hippocampus of young and old, male and female mice. Representative immunoblot images (f; arrow: C3aR band) and quantification of C3aR expression (g) are shown. n = 5/group. Data are presented as mean (SD). (h) C3aR expression by microglia (Iba-1+) in the hippocampus. Quantification of C3aR/Iba-1 colocalization (% of YF) is shown. n = 4/group. Data are presented as mean (SD). *p < 0.05, **p < 0.01, ***p < 0.001, ****p < 0.0001 (two-way ANOVA); #p < 0.05, ##p < 0.01 (unpaired t-test)
C3 can be cleaved to C3a and C3b by the C3 convertase [31], or by cathepsin L [32]. The gene encoding cathepsin L (Ctsl) was increased in old microglia of both sexes and expression of Cd55, a C3 convertase inhibitor (also known as decay accelerating factor, DAF) [33], was significantly reduced in old female microglia, with a similar trend in male microglia (Fig. 4b). We also observed increased expression of the C3a and C5a receptors (C3ar1 and C5ar1), as well as the genes encoding CD11c (Itgax) and CD18 (Itgb2), which combine to form the iC3b receptor CR4 [34] (Fig. 4b and Suppl. Figure 6d, e). The gene encoding the regulatory protein CD59 (Cd59a), which inhibits the formation of the membrane attack complex (MAC) on target cells [35], was also significantly downregulated in old microglia, which may suggest an increased probability of MAC formation (Suppl. Figure 6d, e).
Given our observations, we hypothesized that increased C3 and Ctsl, decreased Cd55, and increased C3ar1 would collectively result in increased C3a production and autocrine signaling, so we further evaluated the C3a-C3aR pathway. We observed higher expression of C3, Ctsl and C3ar1 in DAM from old mice and 5XFAD mice than their homeostatic counterparts, with notably stronger expression in DAM2 (Fig. 4c-e). Western blotting of hippocampal lysates confirmed significantly increased C3aR protein in both female and male old mice (Fig. 4f, g and Additional File 3a). Microglia are the major cell type expressing C3aR in the mouse brain [36], and immunohistochemistry of the mouse hippocampus verified co-localization of C3aR with Iba-1+ microglia and demonstrated significantly increased microglial C3aR expression in old mice of both sexes (Fig. 4h and Suppl. Figure 6 h). Taken together, these data revealed aging-related changes in complement pathway components, consistent with elevated C3a production and C3aR signaling in old microglia, especially in females.
In addition to the canonical roles of the complement system, recent studies have suggested that complement proteins can regulate cellular metabolism. For instance, C3a signaling via C3aR activates PI3K/AKT and mTOR in T cells [32, 37] and inhibits oxidative phosphorylation and electron transport chain activity in fibroblasts [38]. To begin to define the impact of C3a on microglial signal transduction and energy metabolism, we treated young (neonatal) microglia with recombinant mouse C3a. Consistent with mTOR activation upon phosphorylation by AKT, C3a treatment increased phosphorylation of both AKT and mTOR at early time points (15 min–1 h), and this was followed by HIF1α induction (Fig. 5a-d and Additional File 3b), which is indicative of mTOR-HIF1α-induced metabolic reprogramming.
Fig. 5
Microglial C3a – C3aR signaling promotes glycolysis and phagocytosis. Young microglia (postnatal day 0–2) were treated with 10 nM recombinant mouse C3a. (a-d) p-AKT (Ser473), p-mTOR (Ser2448) and HIF1α were assessed by Western blotting at the indicated timepoints (0–24 h), and expression was normalized to total AKT, total mTOR and β-actin, respectively. n = 5 replicates. Data are presented as mean (SEM). *p < 0.05, **p < 0.01, ***p < 0.001 (one-way ANOVA). (e-g) Seahorse assays were used to evaluate real-time glycolytic rate in young microglia (postnatal day 0–2, pooled male and female) after 18 h in vitro treatment with 10 nM recombinant mouse C3a. Stimuli were added as indicated (e), and basal glycolysis (f) and compensatory glycolysis (g) were determined by calculating the glycolytic Proton Efflux Rate (e; glycoPER). n = 5/group. #p < 0.05 (unpaired t-test). (h, i) Flow cytometry analysis was performed to assess phagocytosis of FITC-fAβ1−42. Rapamycin (50 µM) or 2-DG (5 mM) were pre- (1 h) and co-treated (18 h) with C3a. Proportion of phagocytic cells (h) was assessed by evaluating FITC-positive microglia, and FITC MFI was evaluated in total live microglia (i). Data are presented as mean (SEM). *p < 0.05, **p < 0.01, ***p < 0.001, ****p < 0.0001 (one-way ANOVA)
We next performed Seahorse XF assays to determine whether C3a-induced mTOR-HIF1α signaling impacts microglial metabolism and observed increased basal glycolysis and a trend towards increased compensatory glycolysis in C3a-treated young microglia (Fig. 5e-g). Collectively, these data implicate elevated microglial C3a – C3aR signaling in the glycolytic shift observed in microglia during aging.
Glycolysis can promote phagocytosis in microglia by providing the necessary energy and metabolites required for target engulfment and digestion [39,40,41]. Indeed, inhibition of microglial glycolysis can impair their ability to perform phagocytosis effectively [17]. To determine whether C3a-induced glycolysis can also promote the phagocytotic capacity of microglia, we used flow cytometry to evaluate uptake of FITC-fAβ1−42 by C3a-treated young microglia. C3a treatment increased the proportion of FITC-fAβ1−42-containing microglia, and this effect was abolished by pre- and co-treatment with the mTOR inhibitor rapamycin or the glycolysis inhibitor 2-DG (Fig. 5h, i and Suppl. Figure 7).
Taken together, our studies implicate increased microglial C3a production and autocrine signaling via mTOR-HIF1α-induced glycolysis in the enhanced phagocytic properties of DAM during healthy aging and in an AD model (Suppl. Figure
留言 (0)