
記住我
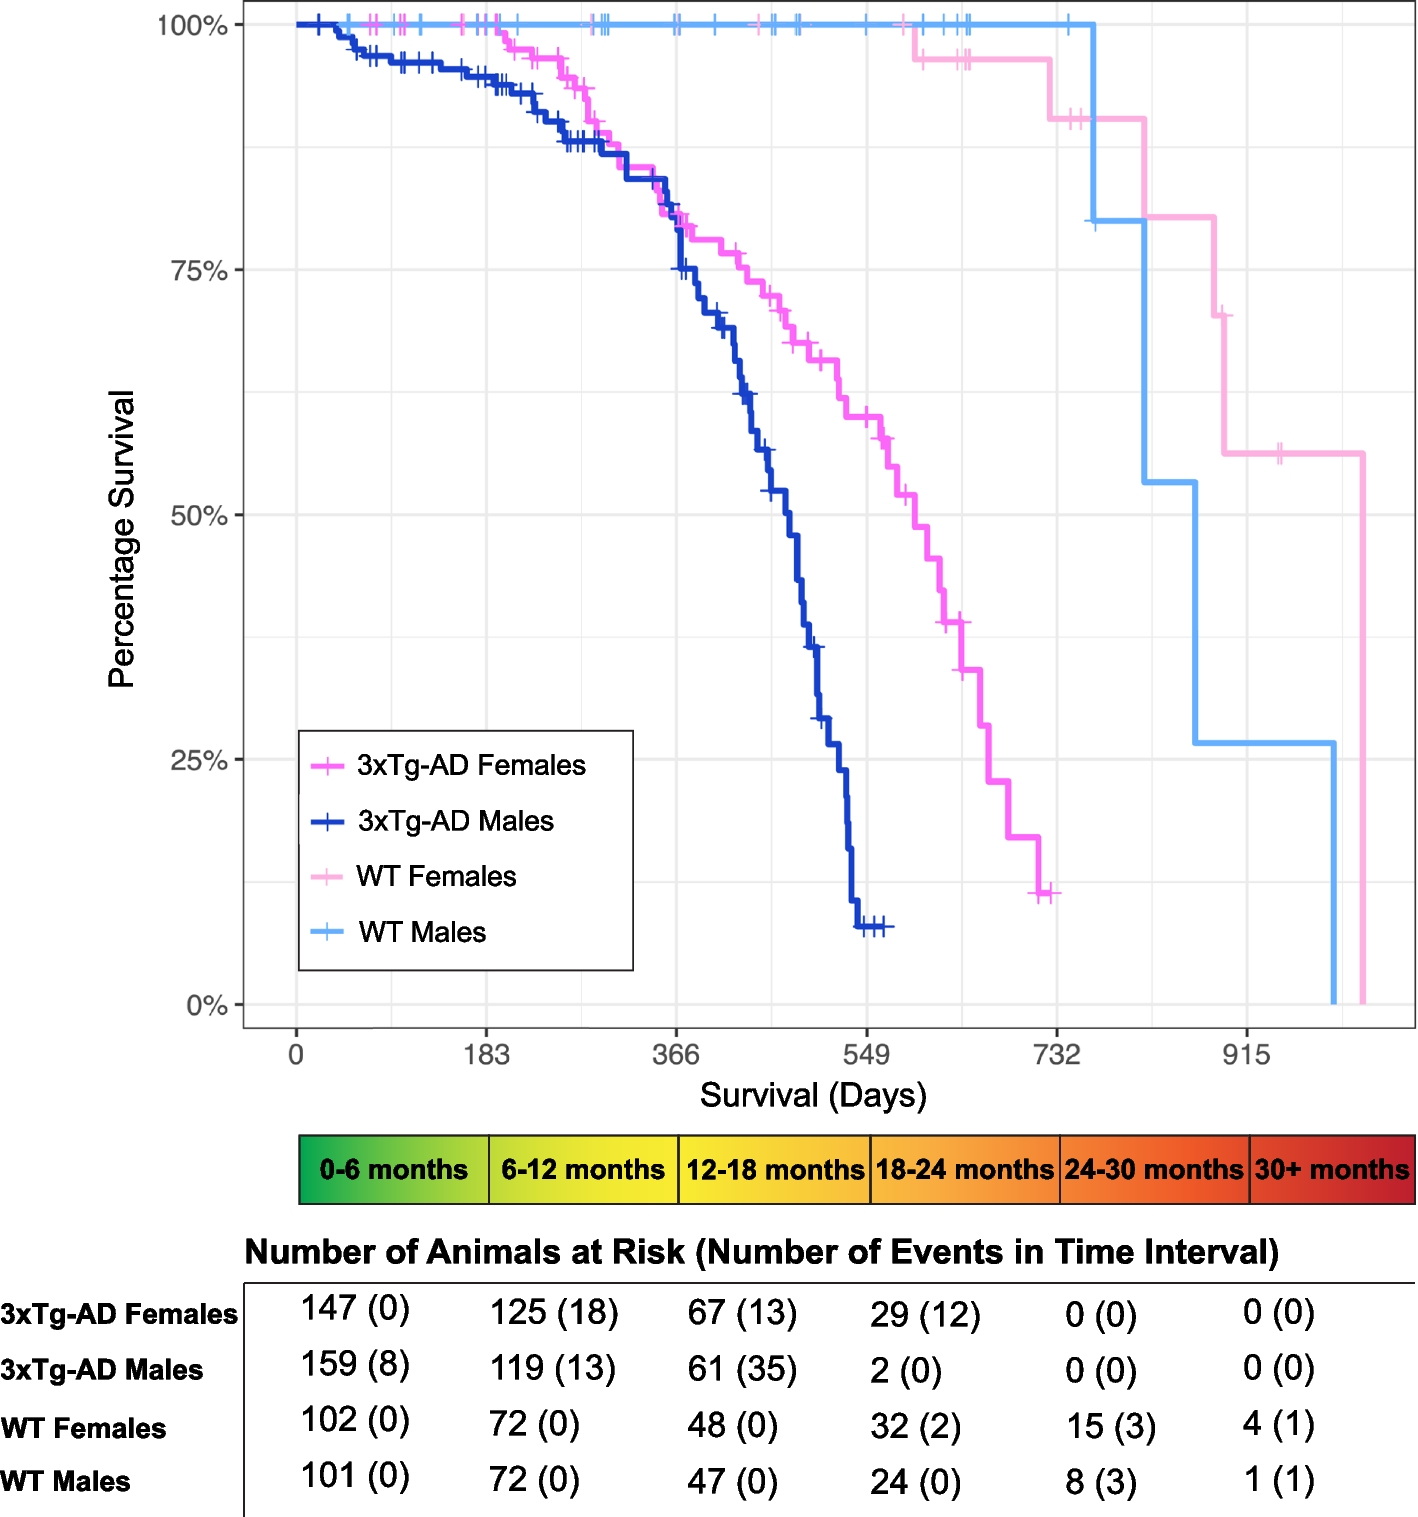


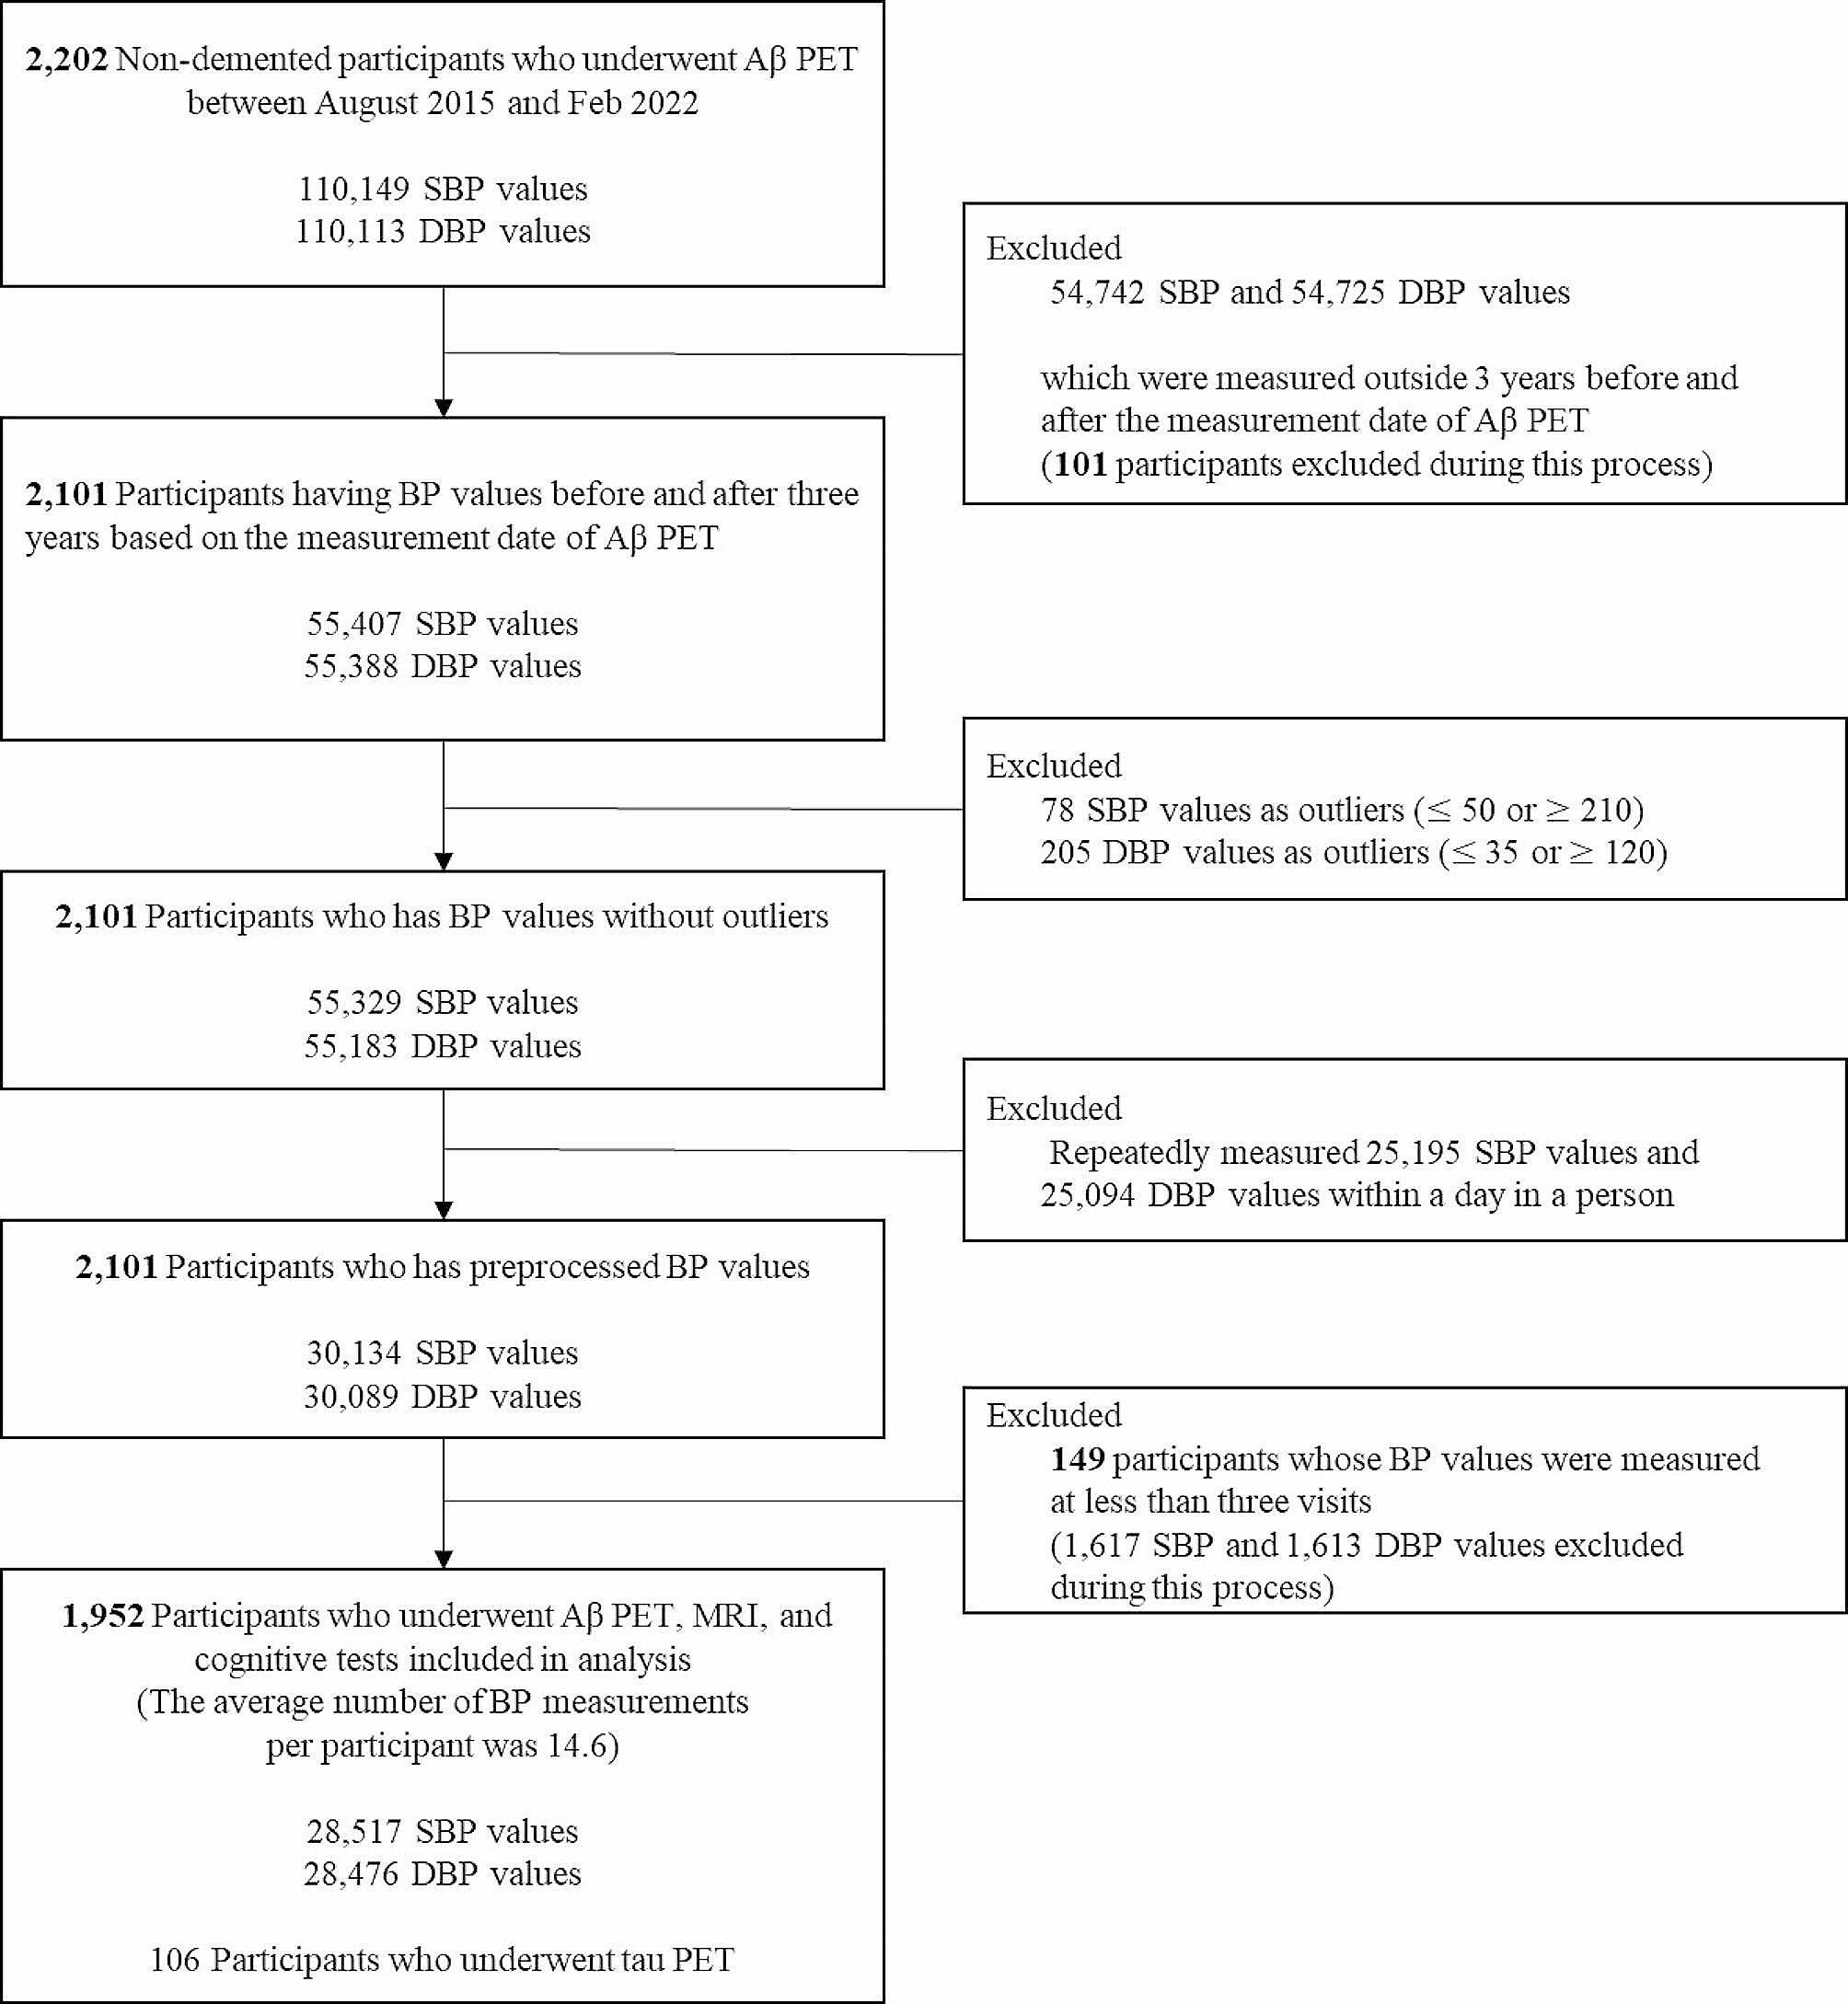
We enrolled 2,202 individuals without dementia who attended the memory clinic at Samsung Medical Center (SMC) in South Korea from August 2015 to February 2022 (Fig. 1). Health professionals conducted medical assessments utilizing standardized protocols. Every subject got a comprehensive evaluation that included a neurological examination, cognitive testing, standard blood tests, brain magnetic resonance imaging (MRI), and Aβ [18 F-florbetaben (FBB) or 18 F-flutemetamol (FMM)] PET scans. During the tests, we identified the vascular risk factors, including hypertension (defined as a self-reported medical history of hypertension or currently taking antihypertensive drugs), diabetes mellitus (defined as a self-reported history of diabetes mellitus or currently taking insulin or oral antidiabetic medications). The blood tests conducted on all individuals encompassed a complete blood count, blood chemistry analysis, vitamin B12/folate levels, syphilis serology, thyroid function panel, and apolipoprotein E (APOE) genotyping. Among them, 106 participants underwent tau [18 F-flortaucipir (FTP)] PET scans. We excluded participants with structural lesions such as brain tumor, large territorial infarct, and intracranial hemorrhage, as well as those with other causes of neurodegenerative disease including Parkinson’s disease, Lewy body dementia, progressive supranuclear palsy, cortico-basal syndrome, and frontotemporal dementia. Participants were further classified into cognitively unimpaired (CU) and mild cognitive impairment (MCI) groups. CU individuals in the study met the following criteria: (1) they had no medical history that would likely impact their cognitive function, as determined by Christensen’s health screening criteria [26], (2) they did not show any objective cognitive impairment in any cognitive domain, as measured by a comprehensive neuropsychological test battery, with scores at least − 1.0 standard deviation (SD) above age-adjusted norms, and (3) they were able to independently perform activities of daily living [27]. MCI participants met the following criteria [28]: (1) they or their caregiver reported subjective cognitive complaints; (2) they exhibited objective memory impairment below − 1·0 SD on verbal or visual memory tests; (3) they did not have significant impairment in their ability to do daily activities; and (4) they did not have dementia. When distinguishing between MCI and dementia, we used the Seoul-Instrumental Activities of Daily Living, and the cut-off score was 8 [29, 30].
Fig. 1
Study flow chart
Abbreviations: Aβ, amyloid-beta; PET, positron emission tomography; SBP, systolic blood pressure; DBP, diastolic blood pressure; BP, blood pressure
This study was approved by the Institutional Review Board of SMC (IRB No: 2019-11-177). Participants and their caregivers provided written informed consent for participating in the study and publication.
Cognitive assessmentThe participants completed a standardized neuropsychological test battery known as the Seoul Neuropsychological Screening Battery (SNSB). This battery included tests that assessed attention, language, visuospatial abilities, memory, and frontal/executive functions [31]. The scored tests included the Digit Span Forward (DSF), Korean version of the Boston Naming Test (K-BNT), Rey-Osterrieth Complex Figure Test (RCFT: copying, immediate and 20-minute delayed recall, and recognition), Seoul Verbal Learning Test (SVLT: immediate, 20-minute delayed recall and recognition), phonemic and semantic Controlled Oral Word Association Test (COWAT), and the Stroop Test (color reading). The DSF was utilized to evaluate the level of attentiveness. Verbal and nonverbal learning and memory were evaluated using SVLT and RCFT. The K-BNT and RCFT assessments were conducted to assess language and visuospatial function, respectively. The phonemic and semantic COWAT and the Stroop Test were conducted to assess frontal/executive function. In addition, all participants underwent the Mini-Mental State Examination (MMSE) in order to evaluate their overall cognitive performance [32]. Abnormal scores were defined as those that fell below − 1.0 standard deviations from the age- and education-adjusted norms. The tests were conducted by experienced staff and overseen by clinical neuropsychologists who are certified by the board.
BP parametersFor each participant, an observation period of BP was defined as a period within three years before and after inspecting Aβ PET. We extracted systolic BP (SBP) and diastolic BP (DBP) records of all participants during their observation periods from the Clinical Data Warehouse of SMC. According to the guidelines in which the hospital follows [33, 34], the BP measurement was conducted with appropriate preparation, which included resting for 5 min in a quiet room and abstaining from smoking, alcohol, and caffeine for 30 min before to the measurement. Additionally, the cuff was placed at the level of the heart to ensure optimal posture. During each clinic visit, the patient’s seated BP and pulse were measured using an automated device. If needed, manual devices were used. The measurements were taken at regular intervals of 1–2 min [33]. We excluded patients with very severe hypertension or hypotension [24, 34,35,36]. Therefore, outliers of SBP (≤ 50 or ≥ 210) and DBP (≤ 35 or ≥ 120) values were removed. There were 1.84 SBP (range = 1–38) and 1.83 DBP (range = 1–36) records per participant on average in a single visit. When a participant had multiple records in a single day, the median of those records was selected as a BP value for the day. With this process, all subjects became have only one BP record per visit but could have multiple BPs over the entire follow-up time. For the next step, we excluded participants who had less than three BP values because BPV was not computable. Finally, 1,952 participants (729 CU and 1,223 MCI) were included in the analysis (Fig. 1). The average number of visits per participant during the entire follow-up time was 14.6 (range = 3-115).
Two different BP parameters, visit-to-visit mean BP and BPV for each subject, were considered in this study. Mean BPs and BPVs were defined as the averages and SDs of all BP values within a subject, respectively. SD was selected as the measure for BPV since the SD was a common measure for visit-to-visit variability [37].
First, the within-participant mean SBP and mean DBP were assessed with the averages of SBP and DBP values, respectively. Second, the within-participant systolic and diastolic BPVs were assessed with the SDs of SBP and DBP values since the SD is a common measure for visit-to-visit variability.
Brain MRI acquisition and measurement of hippocampal volumesAll participants received three-dimensional (3D) T1 turbo field echo images and 3D fluid-attenuated inversion recovery (FLAIR) at SMC utilizing a 3.0T MRI scanner (Philips 3.0T Achieva; Philips Healthcare, Andover, MA, USA), as previously described [38].
To measure hippocampal volumes (HV), we employed an automated method that involved a graph cut algorithm paired with an atlas-based segmentation and morphological opening as described in an previous study [39]. Intracranial volume (ICV) was determined by quantifying the combined the volumes of voxels contained within the the brain mask after the removal of the skull.
Assessment of vascular burdenThe WMH visual rating scale, developed by the Clinical Research Center for Dementia of South Korea, was utilized to examine the presence of WMH in the deep subcortical and periventricular areas on FLAIR images [38,39,40]. We defined vascular positivity (V+) as severe levels of WMH visual rating scales according to our classification system for ischemia [39]. This classification system differentiates the intensity of CSVD markers, such as the volume of WMH [39]. In summary, deep WMH were categorized as D1 (< 10 mm), D2 (10–25 mm), or D3 (≥ 25 mm) according to the lesions’ longest diameter. The classification of periventricular WMH was based on their maximum length measured perpendicular to the ventricle (cap) and horizontally (band). WMH were categorized as P1 if their length was less than 5 mm, P2 if it ranged from 5 to 10 mm, and P3 if it was equal to or greater than 10 mm. There was a total of 9 cells resulting from the combination of D and P ratings. The overall severity of WMH (minimal, moderate, and severe) was determined based on the following combinations of D and P ratings: minimum (D1P1, D1P2), moderate (D1P3, D2P1, D2P2, D2P3, D3P1, D3P2), and severe (D3P3) [40]. In order to evaluate the interrater reliability of our WMH visual rating, we randomly assigned 100 FLAIR images and had 3 experienced neurologists perform a visual rating of the WMH severity. The interrater agreement for the overall severity of WMH was excellent, with a Fleiss k value of 0.84.
Amyloid PET imaging acquisition and analysisEach participant had either FBB or FMM PET at SMC using a Discovery STe PET/CT scanner (GE Medical Systems, Milwaukee, WI, USA) in 3D scanning mode. This mode examines 47 slices of 3.3 mm-thickness that cover the entire brain [41]. CT images were obtained using a 16-slice helical CT scanner with a 140 keV energy level and 80 mA current. This section width of each image was 3.75 mm, and these images were used for attenuation correction. As per the guidelines provided by the makers of the ligands, a 20-min emission PET scan was conducted using dynamic mode (consisting of 4 × 5 min frames). This scan was performed 90 min after injecting an average dose of 311.5 MBq of FBB or 185 MBq of FMM. The 3D PET images were created using the ordered-subsets expectation-maximization (OSEM) algorithm (FBB iterations = 4 and subset = 20; FMM iterations = 4 and subset = 20). The images were reconstructed in a 128 × 128 × 48 matrix with a voxel size of.
2.00 × 2.00 × 3.27 mm3. The PET data were aligned with individual 3D-T1 weighted MR images, which were then standardized to the T1-weighted MNI-152 template utilizing Statistical Parametric Mapping (SPM) 8.
In our previous study, to improve the prediction of prognosis and early detection, we developed an MRI-based regional modified Centiloid (rdcCL) method that harmonizes the overall and regional Aβ uptake among Aβ ligands [42]. The reference region used in the Centiloid pipeline was the whole cerebellum. More details of the analysis method followed are in the original Centiloid project paper and a previous paper [42, 43]. MRI and PET images underwent spatial normalization using the transformation parameters obtained from the SPM8 [44].
Tau PET imaging acquisition and analysis18F-Flortaucipir PET images were obtained using a Discovery STE PET/CT (GE Healthcare) at SMC and a Biographic mCT PET/CT scanner (Siemens Medical Solutions) at Gangnam Severance Hospital. Following the injection of intravenous bolus doses of 280 MBq 18F-flortaucipir, PET images were obtained during a 20-minute acquisition period at 80 min post-injection. Prior to the PET scan, we affixed a head holder to reduce head movement and obtained brain CT images for the purpose of attenuation correction. PET images were reconstructed in a three-dimensional matrix with dimensions of 128 × 128 × 47 with 2.00 × 2.00 × 3.27 mm voxel size at SMC and in a 256 × 256 × 223 matrix with 1.591 × 1.591 × 1 mm voxel size at Gangnam Severance Hospital using the OSEM algorithm (iteration = 6 and subset = 16).
Flortaucipir PET images were realigned and co-registered to the structural MRIs of participants using SPM12. To perform regional standardized uptake value ratio (SUVR) analysis, FreeSurfer 6.0 (http://surfer.nmr.mgh.harvard.edu/) was used to generate region of interest (ROI) masks in the native spaces. Cerebellar gray matter was used as the reference region. For partial volume correction (PVC) of ROI data on the flortaucipir PET images, we used the region-based voxel-wise correction (RBV) method according to the PETPVC toolbox [45]. Consequently, we computed the regional SUVR with the PVC in 41 cortical areas. Then, we created bilateral Braak stage ROIs that anatomically represented the Braak staging regions associated with tau pathology in AD [46,47,48,49,50]. By combining non-overlapping ROIs from FeeSurfer, we established Braak ROIs categorized as Braak I/II, Braak III/IV, and Braak V/VI [51]. Specifically, flortaucipir SUVR using PETPVC applied Braak III/IV ROI [parahippocampal, fusiform, lingual, amygdala, inferior and middle temporal, temporal pole, thalamus, caudal anterior and rostral anterior cingulate, isthmus cingulate, posterior cingulate, and insula] was used.
Statistical analysisThe baseline characteristics were summarized using the mean ± SD for continuous variables and frequency (percentage) for categorical variables. First, to investigate the relationships of each mean BP with AD markers such as Aβ uptake, tau uptake, and HV, or cognition scores from the MMSE, we used multivariable linear regression models with an adjustment for potential confounders (Model 1). However, multivariable logistic regression analyses were conducted to identify the association between mean BP and WMH because its type was binary. Variables having P-values ≤ 0.2 in univariable analyses were selected as potential confounders. While age, sex, duration of education, hypertension, diabetes mellitus, and ICV were selected for HV, the presence of the APOE4 allele was selected instead of ICV for other markers. Second, in Model 2, SDs of BP were included as independent variables to identify the relationships of BPV with AD, CSVD markers and cognitive scores respectively, further adjusting for mean SBP and mean DBP. Third, we added interaction term of BP parameters and the presence of hypertension in the multivariable regression models. It was performed to determine whether the presence of hypertension has moderated effect on the association of BP parameters with AD markers, CSVD marker, or MMSE scores.
All results were presented as the regression coefficients (βs) and odds ratios (ORs) with 95% confidence intervals (CIs) from multivariable linear and logistic regression analyses, respectively. Log transformation was used to revise the skewed distribution of Aβ uptake before analyses, and all results were reported in the original scale. Especially, the results of multivariable linear regression analyses were reported with risk ratios (RRs) that are defined as the inverse-log transformed values of regression coefficients.
Causal mediation analyses were performed to examine the mediation effects of AD and vascular disease markers on the relationships between BP parameters and MMSE scores. Among BP parameters, candidate exposures were selected as those showing potential association with MMSE scores (P-values < 0.1) in the multivariable linear regression analyses with adjustment (Model 1 or 2). Among AD and vascular disease markers, candidate mediators were chosen as those having potential association with selected exposure (P-values < 0.1) in the multivariable analyses with adjustment (Model 1 or 2). We estimated the natural direct (NDE) and indirect effects (NIE) of BP parameters on MMSE scores using the imputation strategies of Vansteelandt based on the counterfactual framework with the medflex (version 0.6-7) package in R software [52]. Bootstrap-based standard errors were applied to calculate 95% CIs and P-values of NDEs and NIEs. The total effect was defined as the summation of NIE and NDE. By dividing NIE by the total effect, we assessed the proportion mediated that indicates the portion of the indirect effect among the total effect of the BP parameters on MMSE scores. Freedman’s proportion explained was also calculated to identify the extent of surrogacy of AD and vascular disease markers when only NIE was significant [53]. Statistical significance was declared with a two-sided p-value < 0.05. All analyses were performed using R 4.1.0 (Vienna, Austria; http://www.R-project.org).
留言 (0)