
記住我
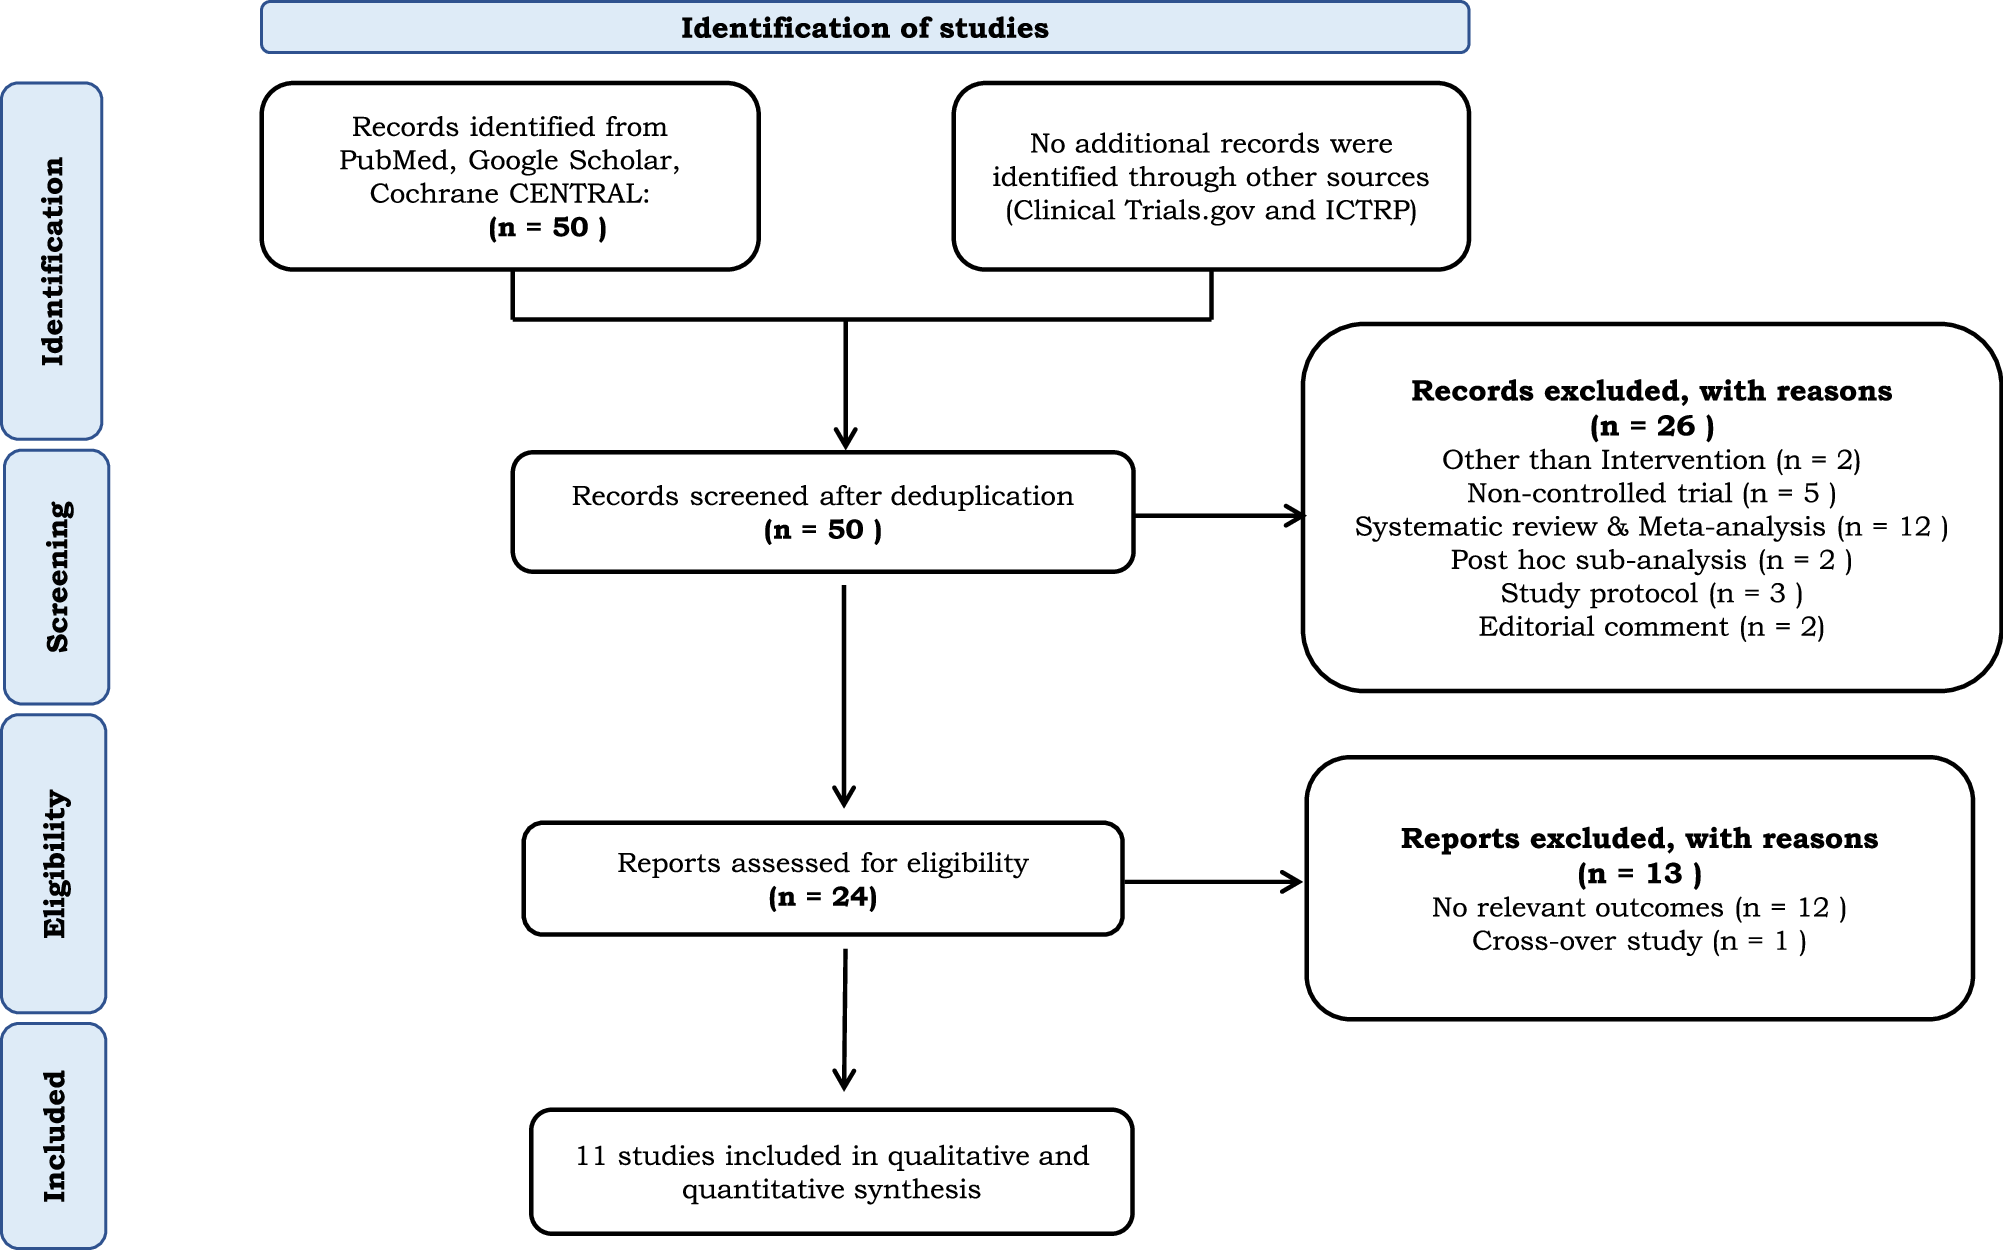
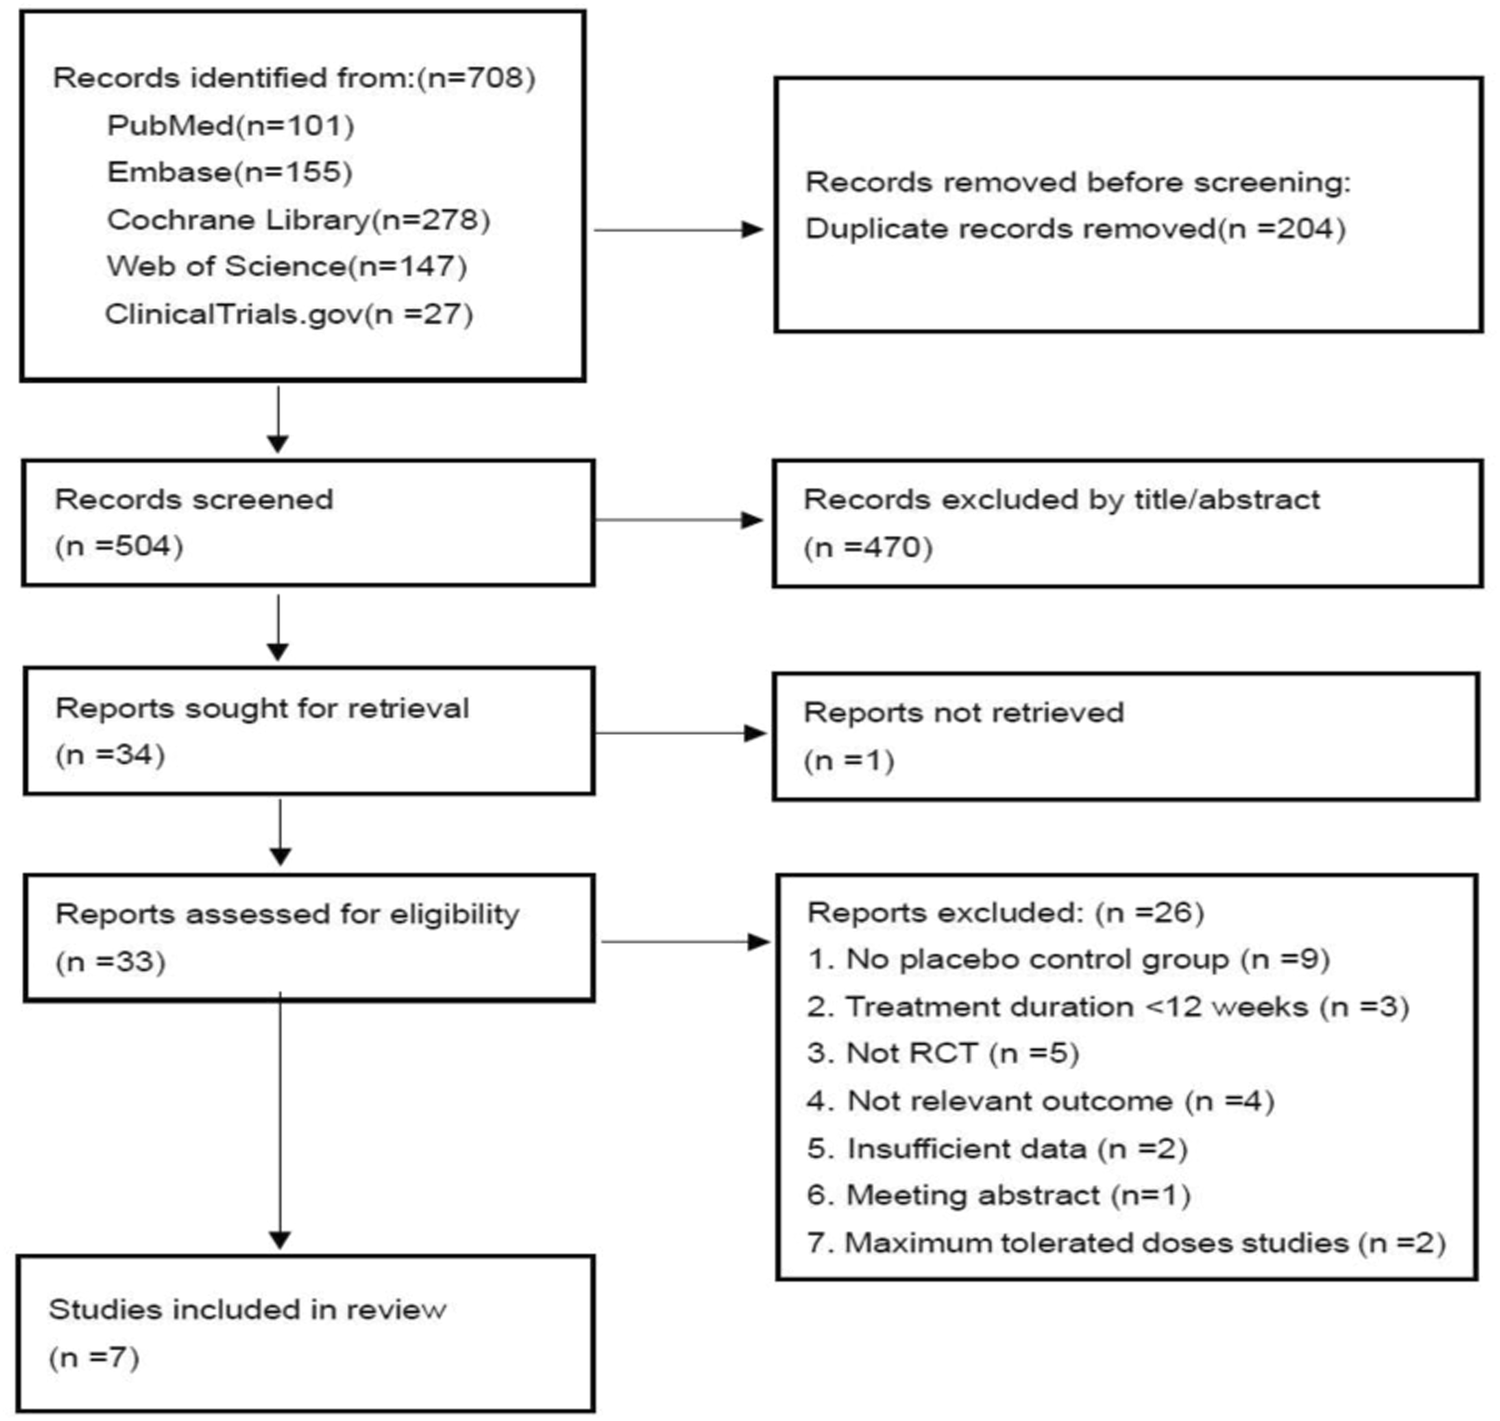


As shown in Fig. 1, our search strategy identified 708 studies from PubMed (n = 101), Embase (n = 155), Cochrane Library (n = 278), Web of Science (n = 147), and clinicaltrials.gov (n = 27). Following title and abstract screening, 204 duplicate records and 470 studies were identified and removed. A further 27 studies were excluded during the full-text review. Reasons for exclusion included: one study not retrieved (full text unavailable), nine studies lacking a placebo control group, three studies with a treatment duration of less than 12 weeks, five studies that were not RCTs, four studies without relevant outcomes, two studies with insufficient data, one meeting abstract, and two studies focused on maximum tolerated doses. Seven studies [11, 12, 16,17,18,19,20] ultimately met all selection criteria and were included in the meta-analysis.
Fig. 1
2020 PRISMA flow diagram of the study selection
Study characteristicsFour of the seven included studies examined the impact of 5 mg tirzepatide, while five studies assessed 10 mg tirzepatide. All seven studies evaluated the effectiveness of 15 mg tirzepatide. In Frias’s trial [16], two groups received the same maintenance dose of 15 mg but with different dose escalation regimens. We combined the outcome data from these two groups into a single treatment group for our analyses. The study included a total of 4795 participants, with 922 (19.2%) receiving a 5 mg dose of tirzepatide, 1239 (25.8%) receiving 10 mg, 1336 (27.9%) receiving 15 mg, and 1298 (27.1%) receiving the placebo. The intervention duration ranged from 12 to 72 weeks across these seven studies. The majority of the research analyzed the effectiveness of tirzepatide in treating T2D, with BW alteration as a secondary outcome, except for SURMOUNT-1 [12] and SURMOUNT-2 [20], which primarily tested tirzepatide for the treatment of obesity. Table 1 provides an overview of the included publications and baseline characteristics of participants.
Quality assessmentFigure S1 presents the risk of bias evaluation findings for the seven RCTs included in our meta-analysis, as assessed using the RoB-2 tool. Three studies [11, 16, 17] were classified as ‘high risk’ due to missing outcome data. One of these studies [17] was also judged to have a high risk of bias due to deviations from the intended interventions. The evaluation of the remaining four studies [12, 18,19,20] found them to have low risk in all five domains, indicating an overall low risk of bias for each individual study.
Main analysesBW changesThe pooled data analysis showed substantial weight reduction in all three tirzepatide doses compared to the placebo group. A dose-dependent relationship was observed for body weight (BW) reduction. Figure 2a and Table S3 demonstrate that the average percentage change in weight exhibited a statistically significant MD compared to the placebo for doses of 5 mg (−8.07, 95%CI [−11.01, −5.13], p < 0.00001, moderate certainty), 10 mg (−10.79, 95%CI [−13.86, −7.71], p < 0.00001, moderate certainty), and 15 mg (−11.83, 95%CI [−14.52, −9.14], p < 0.00001, moderate certainty).
Fig. 2
Comparison of three doses of tirzepatide versus placebo for percent weight change from baseline (a) and absolute weight change from baseline, in kg (b)
As shown in Fig. 2b and Table S3, the MD in absolute BW change from baseline compared to placebo was −7.5 kg (95%CI [−10.9, −4.1], p < 0.0001, moderate certainty) for 5 mg, −11.0 kg (95%CI [−16.9, −5.2], p = 0.0002, moderate certainty) for 10 mg, and −11.5 kg (95%CI [−16.2, −6.7], p < 0.00001, moderate certainty) for 15 mg of tirzepatide.
The proportion of patients achieving weight loss of ≥5, ≥10, ≥15, ≥20 or ≥25%Weight loss of ≥5% from baseline is considered a clinically significant response to AOMs [21, 22]. As presented in Fig. 3 and Table S3, a significantly greater proportion of participants in all tirzepatide dose groups achieved at least 5% weight reduction compared to placebo: 75.8% for 5 mg (vs. 26.4%, p < 0.0001, low certainty), 81.6% for 10 mg (vs. 27.9%, p < 0.00001, low certainty), and 84.3% for 15 mg (vs. 27.9%, p < 0.00001, low certainty). This suggests a dose-dependent effect. Similar findings were observed in Figure S2, which showed a higher likelihood of achieving weight loss of ≥10% compared to placebo: 54.4% for 5 mg (vs. 13.3%, p = 0.001, low certainty), 64.9% for 10 mg (vs. 12.3%, p < 0.00001, low certainty), and 69.2% for 15 mg (vs. 12.3%, p < 0.00001, low certainty).
Fig. 3
Effect of three doses of tirzepatide on achieving weight loss goals of ≥5% from baseline compared to placebo
Similar trends were observed for achieving at least 15% weight loss. In Fig. S3 and Table S3, a significantly greater proportion of participants receiving tirzepatide compared to placebo achieved this target: 35.7% for 5 mg (vs. 6.1%, p < 0.00001, moderate certainty), 49.1% for 10 mg (vs. 5.2%, p < 0.00001, moderate certainty), and 54.1% for 15 mg (vs. 5.2%, p < 0.00001, low certainty).
Additionally, two trials SURMOUNT-1 [12] and SURMOUNT-2 [20] which assessed tirzepatide primarily for obesity treatment both reported the proportion of patients achieving weight loss of ≥20 or ≥25%. As shown in Figs. S4–S5 and Table S3, respectively, there were more participants meeting targets compared to placebo for ≥20% weight loss [5 mg (30 vs 3.1%, p < 0.00001, high certainty), 10 mg (40.7 vs 2.4%, p < 0.00001, moderate certainty), 15 mg (48.1 vs 2.4%, p < 0.00001, moderate certainty)] and for ≥25% weight loss [5 mg (15.2 vs 1.6%, p < 0.00001, high certainty), 10 mg (24.6 vs 1.1%, p < 0.00001, moderate certainty), 15 mg (29.3 vs 1.1%, p < 0.00001, moderate certainty)].
BMI and WC changesSimilarly, all tirzepatide doses were superior to placebo in terms of change in BMI from baseline (Fig. 4a and Table S3). A statistically significant MD was observed for the 5 mg dose (−2.6 kg/m2, 95%CI [−3.4, −1.7], p < 0.00001, moderate certainty), 10 mg dose (−3.4 kg/m2, 95%CI [−3.7, −3.1], p < 0.00001, high certainty), and 15 mg dose (−4.0 kg/m2, 95%CI [−4.5, −3.5], p < 0.00001, moderate certainty).
Fig. 4
Comparison of three doses of tirzepatide versus placebo for BMI change from baseline, in kg/m2 (a) and WC change from baseline, in cm (b)
According to the meta-analysis findings shown in Fig. 4b and Table S3, the administration of subcutaneous tirzepatide was also linked to a notable decrease in WC compared to placebo for all three doses, which revealed an MD for 5 mg (−6.8 cm, 95%CI [−9.3, −4.3], p < 0.00001, moderate certainty), 10 mg (−8.8 cm, 95%CI [−11.9, −5.8], p < 0.00001, moderate certainty), and 15 mg (−8.9 cm, 95%CI [−12.3, −5.5], p < 0.00001, moderate certainty).
Blood pressure changesAs shown in Figure S6 and Table S3, all tirzepatide doses significantly reduced systolic blood pressure (SBP) compared to placebo. There was a statistically significant MD for the 5 mg dose (−4.86 mmHg, 95%CI [−6.34, −3.37], p<0.00001, moderate certainty), 10 mg dose (−5.3 mmHg, 95%CI [−6.89, −3.72], p<0.00001, low certainty), and 15 mg dose (−6.4 mmHg, 95%CI [−8.13, −4.68], p<0.00001, low certainty).
Compared to the placebo, all three tirzepatide doses resulted in a reduction in DBP. The MD was −1.9 mmHg (95% CI: −4.24, 0.44; P = 0.11, low certainty) for the 5 mg dose, −2.25 mmHg (95% CI: −3.80, −0.69; P = 0.005, low certainty) for the 10 mg dose, and −2.86 mmHg (95% CI: −3.46, −2.27; P < 0.00001, moderate certainty) for the 15 mg dose (Figure S7 and Table S3).
HbA1c and glucose changesAll three tirzepatide doses were associated with a significant decrease in HbA1c levels compared to placebo (Figure S8 and Table S3). Mean differences were observed for the 5 mg dose (−1.28%, 95%CI [−2.15, −0.41], p = 0.004, moderate certainty), 10 mg dose (−1.45%, 95%CI [−2.21, −0.69], p = 0.0002, moderate certainty), and 15 mg dose (−1.69%, 95%CI [−2.39, −0.99], p < 0.00001, moderate certainty).
As shown in Figure S9 and Table S3, all tirzepatide doses resulted in a significant reduction in FPG levels compared to placebo. Statistically significant mean differences were observed for the 5 mg dose (−1.89 mmol/L, 95%CI [−3.15, −0.64], p = 0.003, moderate certainty), 10 mg dose (−2.25 mmol/L, 95%CI [−3.36, −1.14], p < 0.0001, moderate certainty), and 15 mg dose (−2.44 mmol/L, 95%CI [−3.41, −1.47], p < 0.00001, moderate certainty).
Fasting lipid profile changesWeekly tirzepatide administration showed a dose-dependent relationship with changes in fasting lipid profiles compared to placebo, as summarized in Table S1 and Table S3. All three doses of tirzepatide significantly decreased TC: −0.25 mmol/L(95% CI :−0.34, −0.15; P <0.00001, high certainty) for 5 mg, −0.30 mmol/L(95% CI:−0.40, −0.20;P <0.00001, high certainty) for 10 mg, and −0.37 mmol/L(95% CI :−0.49, −0.24; P < 0.00001, moderate certainty) for 15 mg. Similar reductions were observed for LDL: −0.15 mmol/L(95% CI :−0.21,−0.09; P <0.00001, high certainty) for 5 mg, −0.19 mmol/L(95% CI:−0.27, −0.10;P <0.0001, high certainty) for 10 mg, and −0.24 mmol/L(95% CI:−0.36, −0.13;P < 0.0001, moderate certainty) for 15 mg. VLDL levels also decreased with all tirzepatide doses: −0.16 mmol/L(95% CI :−0.26, −0.06; P = 0.002, moderate certainty) for 5 mg, −0.19 mmol/L (95% CI: −0.26, −0.12; p < 0.00001, moderate certainty) for 10 mg, and −0.23 mmol/L(95% CI :−0.32, −0.13; P < 0.00001, moderate certainty) for 15 mg. Triglycerides followed the same trend:−0.31 mmol/L(95% CI:−0.46, −0.17; P < 0.0001, low certainty) for 5 mg, −0.37 mmol/L(95% CI:−0.50, −0.25;P < 0.00001, low certainty) for 10 mg, and −0.43 mmol/L(95% CI :−0.54, −0.32; P < 0.00001, low certainty) for 15 mg. The only exception to this trend was HDL, which showed a slight increase for all doses: 0.05 mmol/L (95% CI: −0.00, 0.10; P = 0.07, moderate certainty) for 5 mg,0.06 mmol/L (95% CI :0.02, 0.10; P = 0.008, moderate certainty) for 10 mg, and 0.08 mmol/L (95% CI :0.04, 0.12; P < 0.0001, moderate certainty) for 15 mg.
Adverse eventsSafety analysis, according to Figure S10, revealed a higher frequency of adverse events (AEs) in the tirzepatide groups compared to placebo. The rates of AEs for tirzepatide were 77.9 vs 69.6% (p < 0.0001, high certainty) for the 5 mg dose, 77.8 vs 71.2% (p = 0.07, moderate certainty) for the 10 mg dose, and 76.4 vs 71.0% (p = 0.03, moderate certainty) for the 15 mg dose (Figure S10 and Table S3). Similarly, a higher proportion of DAEs was observed in the tirzepatide groups compared to placebo, as shown in Figure S12 and Table S3 (5 mg:4.7 vs 2.7%, p = 0.03, moderate certainty;10 mg:6.1 vs 3.0%, p = 0.004, moderate certainty;15 mg:7.3 vs 3.2%, p = 0.002, moderate certainty). Notably, treatment with any of the three tirzepatide doses did not increase the incidence of SAEs compared with placebo, as demonstrated in Figure S11 and Table S3 (5 mg: 6.0 vs 6.4%, p = 0.76, moderate certainty;10 mg: 6.5 vs 6.6%, p = 0.92, moderate certainty; 15 mg: 5.4 vs 6.5%, p = 0.36, moderate certainty). Likewise, there was no significant difference in the occurrence of hypoglycemia between the tirzepatide and placebo groups (Figure S13 and Table S3;5 mg:11.7 vs 10.0%, p = 0.17, low certainty;10 mg: 13.1 vs 10.0%, p = 0.11, low certainty; 15 mg: 12.1 vs 9.5%, p = 0.06, low certainty).
All tirzepatide groups experienced GI AEs, including nausea, diarrhea, vomiting, constipation, dyspepsia, and decreased appetite at a higher frequency compared to placebo (Table S2 and Table S3). RR for tirzepatide compared to placebo were: nausea (5 mg: 2.63, P <0.00001, moderate certainty;10 mg:3.42, P <0.00001, moderate certainty;15 mg: 3.24, P <0.00001, low certainty); diarrhea (5 mg: 2.04, p = 0.007, low certainty;10 mg: 2.29, P <0.00001, moderate certainty;15 mg: 2.38, P <0.00001, low certainty); vomiting(5 mg: 3.95, P <0.00001, moderate certainty; 10 mg: 4.34, P <0.00001, moderate certainty;15 mg: 5.29, P <0.00001, moderate certainty); constipation(5 mg: 3.04, P <0.00001, moderate certainty; 10 mg: 2.83, P <0.00001, moderate certainty; 15 mg: 2.29, P <0.00001, moderate certainty); dyspepsia(5 mg: 2.28, P <0.0001, moderate certainty; 10 mg: 2.44, P <0.00001, moderate certainty; 15 mg: 2.45, P <0.00001, moderate certainty);and decreased appetite(5 mg: 3.21, P <0.00001, moderate certainty; 10 mg: 4.17, P <0.00001, moderate certainty;15 mg: 3.60, P <0.00001, moderate certainty).
An analysis of mortality across all seven included trials (n = 3497 tirzepatide, n = 3471 placebo) found 9 deaths in the tirzepatide group and 6 deaths in the placebo group (Figure S14). Notably, five studies reported no deaths in the tirzepatide arm [11, 16,17,18,19]. However, in SURMOUNT-1 [12], the tirzepatide groups experienced some deaths: 4 in the 5 mg group (1 hepatic failure, 2 COVID-19, 1 severe polytrauma), 2 in the 10 mg group (1 homicide, 1 suspected stroke), and 1 in the 15 mg group (COVID-19). Similarly, SURMOUNT-2 [20], reported 2 deaths in the 10 mg tirzepatide group (smoke inhalation, cardio-respiratory arrest). Importantly, investigators did not attribute any of these deaths to tirzepatide treatment.
Sensitivity analysesTo assess how each study influenced the results, we performed a leave-one-out sensitivity analysis on the percentage change (%) and absolute change (kg) in weight (Table S4-S5). The withdrawal of SURMOUNT-1 had the greatest impact on reducing heterogeneity across all dose subgroups. This is likely because SURMOUNT-1 included only obese patients without comorbid diabetes, unlike the other studies. Research has shown that individuals with both obesity and T2D tend to experience a smaller reduction in weight in response to anti-obesity drugs compared to those without diabetes [23, 24].
Subgroup analysisSubgroup analysis based on treatment duration was performed for both percentage (%) and absolute (kg) changes in BW across the three tirzepatide doses compared to placebo (Table S6). This analysis revealed a dose-dependent increase in weight loss with a longer tirzepatide treatment duration. Notably, all three doses of tirzepatide demonstrated significant weight loss compared to placebo regardless of treatment duration. To further investigate the impact of T2D on weight loss, a subgroup analysis was conducted by separating studies enrolling diabetic patients from SURMOUNT-1 (non-diabetic patients). The results showed a greater weight reduction in the SURMOUNT-1 trial (without diabetes) compared to studies that included individuals with diabetes(Table S7).
Data from Table S8 suggests that the incidence of AEs decreased with longer treatment duration, while the occurrence of SAEs did not increase. This finding indicates that most AEs associated with once-weekly subcutaneous tirzepatide are likely to be transient and mild-to-moderate in severity.
Publication biasVisual inspection of the funnel plots for the percentage change and absolute change in BW with the 15 mg tirzepatide dose (Figure S15) suggests a potential publication bias in our included trials. This asymmetry might be due to differences in participant inclusion criteria or the limited number of studies included in this meta-analysis (n < 10). Consequently, the Egger test was not employed to formally assess funnel plot asymmetry, as it is not recommended for such small numbers of studies [25].
留言 (0)