Cell lines
The human normal gastric epithelial cells (GES-1) and the human GC cells (SGC-7901) were obtained from the Cancer Research Center of Yanbian University. The DDP-resistant GC cells (SGC-7901/DDP) and THP-1 cells were purchased from Shanghai Fuheng company. All cells were cultured in RPMI-1640 medium containing 10% FBS and 1% penicillin–streptomycin and at 37 °C, 5% CO2.
Transfection
We purchased TMEM205-specific siRNA from RIBOBIO (Guangzhou, China), including si-TMEM205-1, si-TMEM205-2, si-TMEM205-3, and siRNA (si-Con). The si-TMEM205-1, si-TMEM205-2, and si-TMEM205-3 sequences are GCTGTCCTCT CTTTGCAAT, TCGGACTAGTGCAGAGCAA, and TCTGCATCTTGGCTTCACA, respectively. 1 × buffer, siRNA and dye transfer solution were mixed and incubated at RT for 20 min, and added to penicillin–streptomycin-free RPMI-1640 cultured SGC-7901/DDP cells for 48 h.
Established co-cultured system
Cells (1 × 10⁵/well) were inoculated in upper chamber of transwell device (BD Biosciences, Piscataway, NJ, USA). THP-1 cells were induced to macrophages and inoculated in lower chamber, and added 1.46 μg/mL DDP to the corresponding wells. After 48 h, THP-1 cells were detected by western blot, immunofluorescence, and flow cytometry assays.
Western blot assay
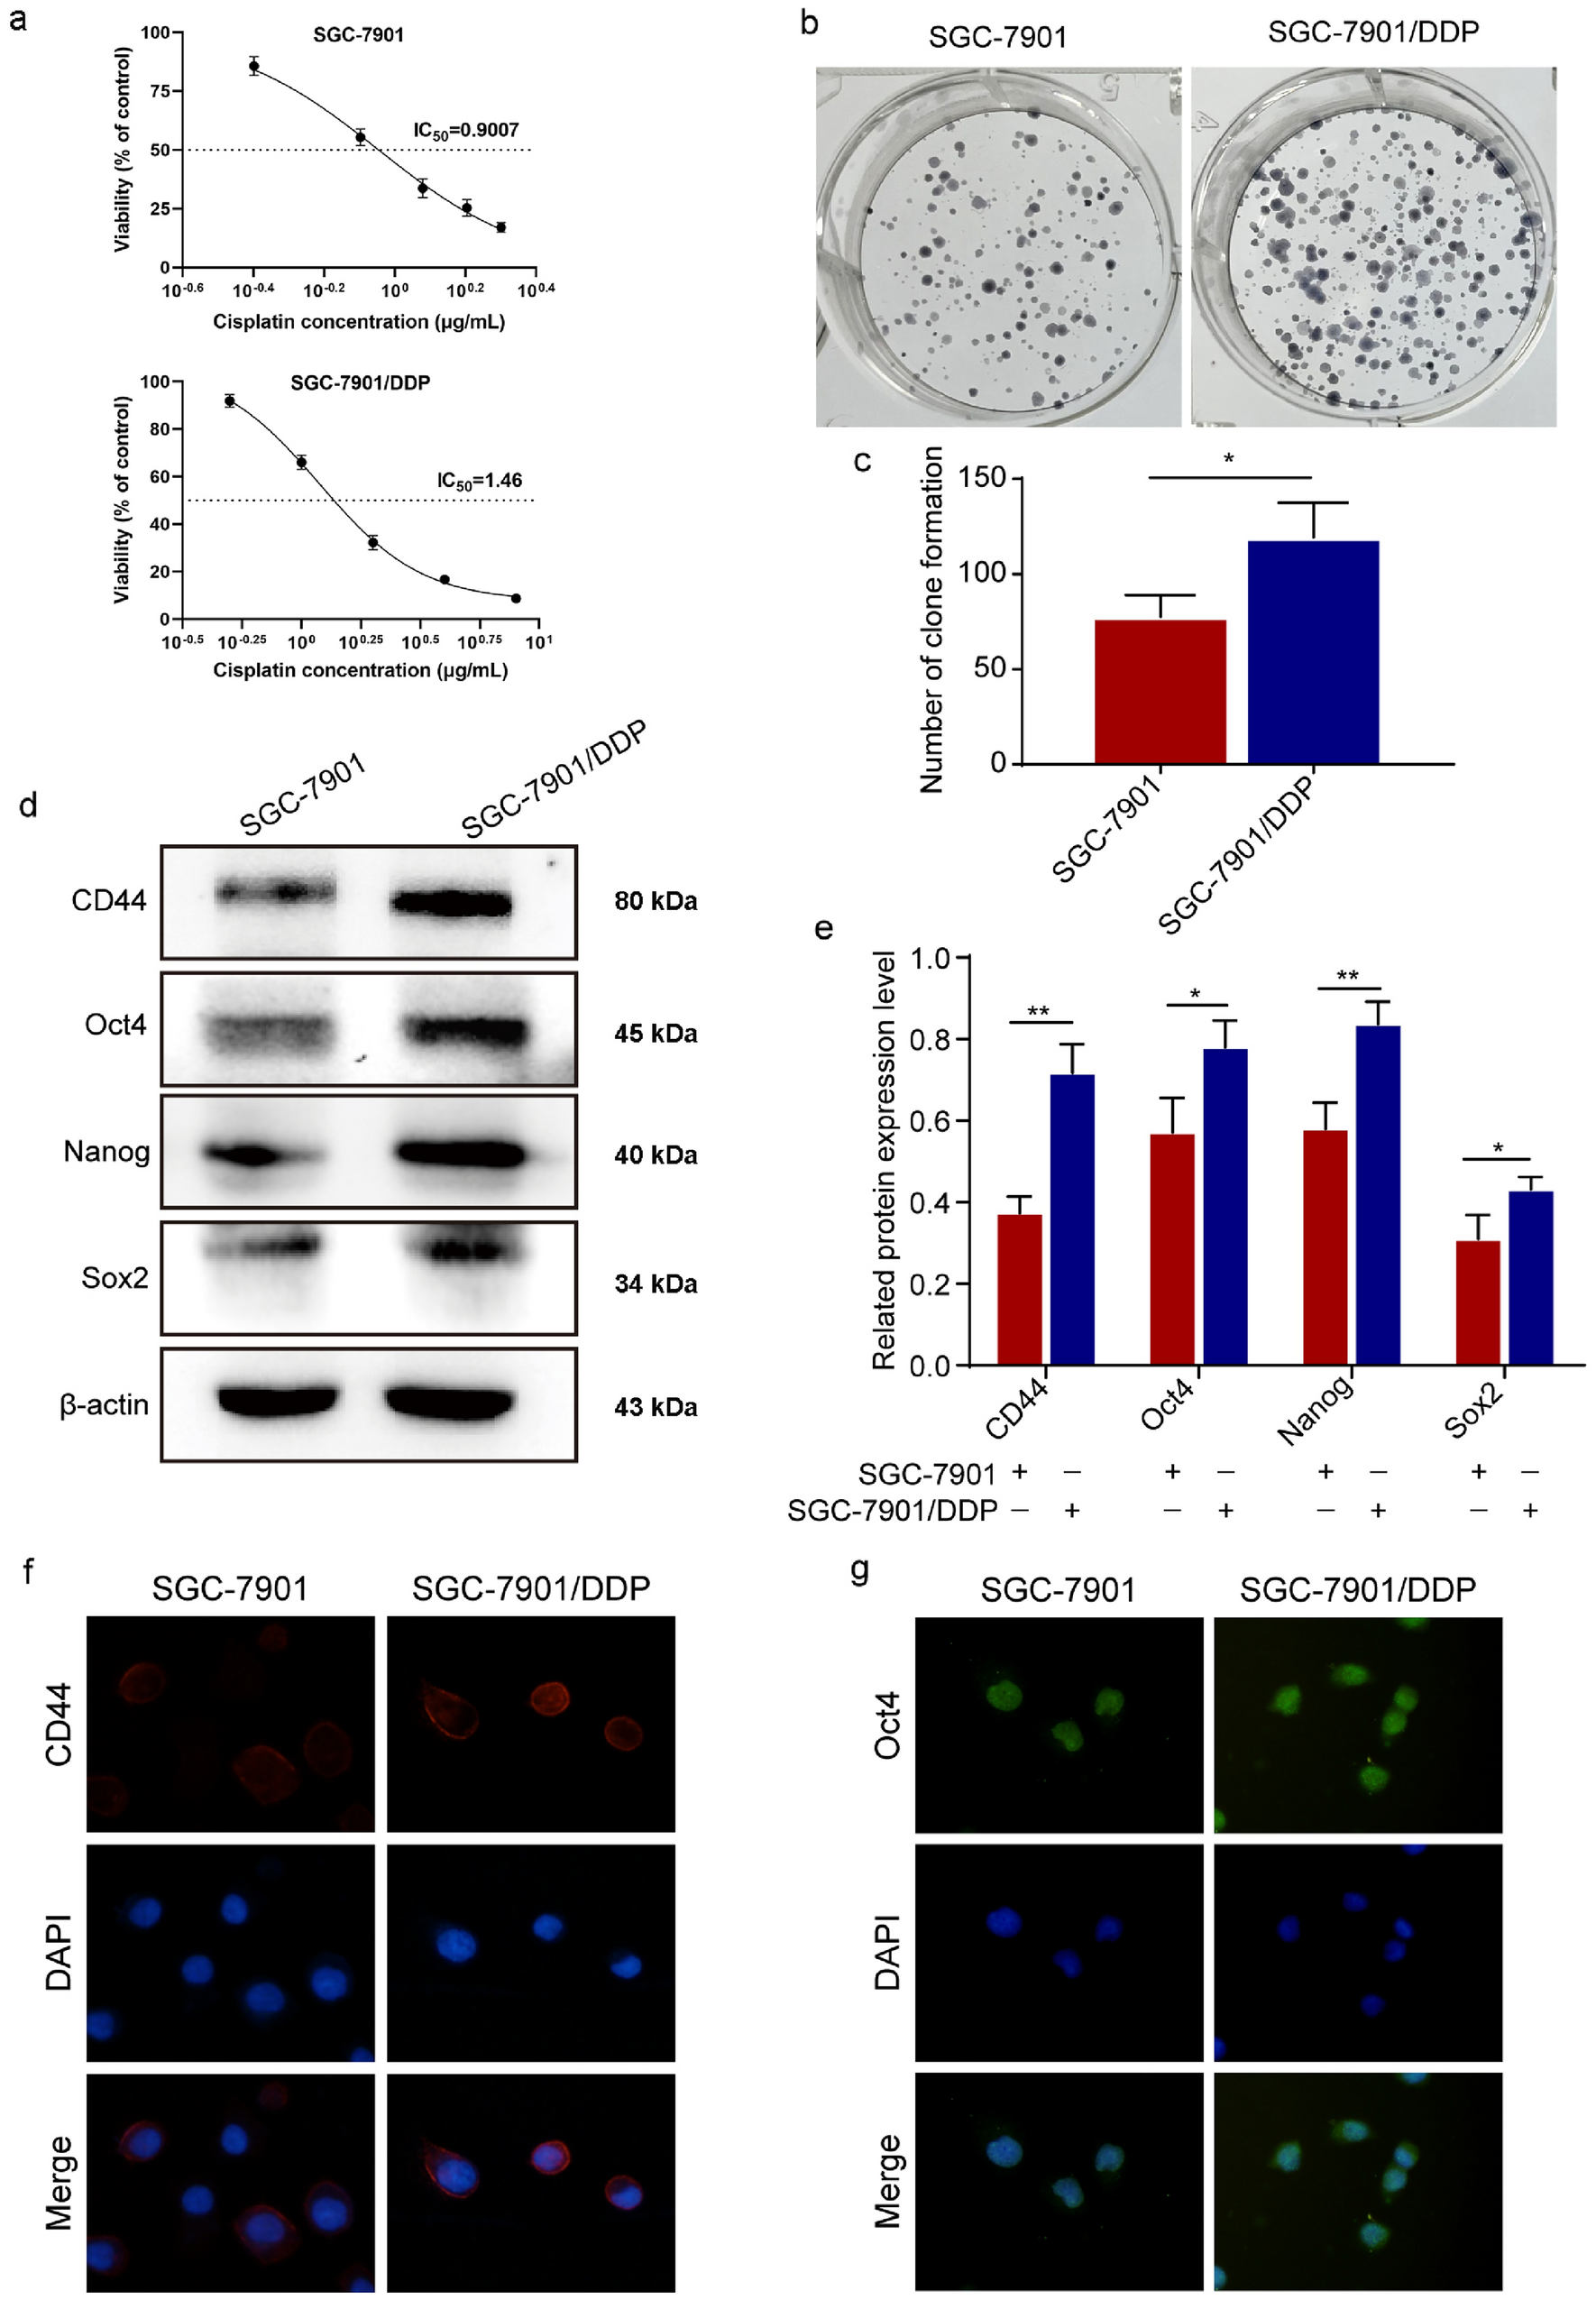
Cells were lysed with appropriate RIPA buffer containing appropriate protease and phosphatase inhibitor (CoWin Biosciences, Beijing, China). Protein concentration was measured by BSA Protein Assay Kit (Roche, Basel, Switzerland). Denatured proteins were separated by SDS-PAGE glue and transferred to PVDF membranes (Millipore, Billerica, MA, USA). PVDF membranes were incubated with corresponding primary antibody overnight at 4 °C. On the next day, PVDF membranes were incubated with corresponding secondary antibody at RT for 1 h. The bands were obtained using the Gel Imaging System (Bio-Rad, Hercules, CA, USA). Names and item numbers of all the antibodies used in the experiment: Santa Cruz Biotechnology: CD44 (DF1485); sc-7297; Oct-4 (H-134) sc-9081; Nanog (1E6C4) sc-293121; Sox2 (E-4) sc-365823; iNOS (C-11) sc-7271; TMEM205 (B-5) sc-514568; E-cadherin (G-10): sc-8426; ZO-1 (R40.76) sc-33725; twist (Twist2C1a) sc-81417; N-cadherin (13A9) sc-59987; Vimentin (V9) sc-6260; SLUG (A-7) sc-166476; SNAI 1 (G-7) sc-271977; VEGF (JH121) sc-57496; MMP2 (8B4) sc-13595; MMP9 (E-11) sc-393859; Wnt-5a (A-5) sc-365370; beta-catenin (BDI870) sc-59896; c-Myc (A-14) sc-789; MDR1/ABCB1 (G-1) sc-13131; MRP1 (QCRL-1) sc-18835; caspase-3 (3CSP01) sc-65496; caspase-8 (3C121) sc-70501; caspase-9 (96.1.23) sc-56076; Bax (B-9) sc-7480; Bcl-2 (C-2) sc-7382. Cell Signaling Technology: Oct-4 Antibody #2750; CD206/MRC1 (E6T5J) XP Rabbit mAb #24,595; CD86 (E5W6H) Rabbit mAb #19,589); 3195 E-Cadherin (24E10) Rabbit mAb.
MTT assay
SGC-7901 cells (1 × 10³/well) were inoculated in 96-well plates, and treated with different concentration of DDP (0, 0.4, 0.8, 1.2, 1.6, 2 μg/mL) for 48 h. SGC-7901/DDP cells (1 × 10³/well) were inoculated in 96-well plates, and treated with different concentration of DDP (0, 0.5, 1.0, 2.0, 4.0, 8.0 μg/mL) for 48 h. 100 μL MTT (1 mg/mL) was added to each well for 4 h at 37 °C. Absorbance value was measured at 490 nm after adding 100 μL DMSO to each well.
Clone-formation assay
Cells (500/well) were inoculated in 6-well plates for 14 days. Cells were fixed with 4% paraformaldehyde for 30 min, washed with PBS, and stained with hematoxylin at RT. The number of colony formation was analyzed.
EDU assay
SGC-7901/DDP cells (5 × 10⁴/well) were inoculated in 96-well plates, and corresponding wells were treated with 1.46 μg/mL DDP for 48 h. 100 μL EDU medium was added to each well for 2 h at 37 °C. 4% paraformaldehyde fixed cells for 30 min. 50 μL glycine (2 mg/mL) incubated cells for 5 min. 100 μL 0.5% Triton X-100 (CWBIO Biosciences) permeabilizing agent incubated cells for 5 min. Apollo staining reaction solution incubated cells at RT for 30 min, permeabilizing agent to decolorize cells and methanol to wash cells. 1 × Hoechst33342 reaction solution incubated cells for 30 min at RT, followed by using inverted microscope (NIH, Bethesda, MD, USA) to take pictures.
Wound-healing assay
SGC-7901/DDP cells were inoculated in 6-well plates. The cells were scratched with 200 μL tips until fused to 80%. 1.46 μg/mL DDP was added into corresponding wells. The images were obtained at 0 h, 24 h and 48 h using an inverted microscope.
Transwell assay
SGC-7901/DDP cells (1 × 10⁵/well) were inoculated into upper chamber of transwell device (BD Biosciences, Piscataway, NJ, USA), and RPMI-1640 complete medium was added into the lower chamber. 1.46 μg/mL DDP was added to corresponding wells. Cells were fixed with 4% paraformaldehyde and stained with hematoxylin after 48 h. Cells were counted under a microscope.
Immunofluorescence (IF) assay
Cells were inoculated in 6-well plates. 1.46 μg/mL DDP was added to corresponding wells and cultured for 48 h at 37 °C. Cells were fixed with 4% paraformaldehyde and permeabilized with 0.5% Triton X-100. Cells were blocked with 3% BSA (Solarbio, Beijing, China) for 2 h at RT. Primary antibodies incubated cells at 4 °C overnight. Primary antibodies include E-cadherin (1:200), Vimentin (1:100), β-catenin (1:100), CD44 (1:100) MDR1 (1:100) MRP1 (1:100) (Santa Cruz Biotechnology, Dallas, TX, USA); CD86 (1:100), CD206 (1:100), Oct4 (1:100) (Cell Signaling Technology, USA). On the next day, cells were incubated with secondary antibodies for 2 h at RT, then counterstained with DAPI (Solarbio, Beijing, China). Finally, this assay used LeicaSP5II confocal microscope for imaging.
Endothelial tube formation assay
50 μL of Matrigel (BD Biosciences, Piscataway, NJ, USA) mixture (serum-free RPMI-1640 medium: Matrigel = 1:1) was added into 96-well plate, and put it at 37 °C until Matrigel was completely solidified. HUVECs (1 × 10⁵/well) were inoculated into 96-well plates containing Matrigel. Lastly, this assay used microscope to collect microtubule formation pictures after 6 h.
Flow cytometry assay
THP-1 cells (5 × 10⁵/tube) were re-suspended in the cell staining buffer after inducting to macrophages. THP-1 cells were stained with APC-CD86, (Biolegend, San Diego, USA) for 20 min at 4 °C. The cells were washed with intracellular staining buffer, and added intracellular fluorescent staining with FITC-68 and PE-CD206, (Biolegend, San Diego, USA) for 20 min at 4 °C. 500 μL cell staining buffer was added to re-suspend the cells, and then analyzed with the BD Accuri flow cytometer (BD Bioscience, Piscataway, NJ, USA).
Database assay
We used The Human Protein Atlas database (http://www.proteinatlas.org/), Ualcan database (http://ualcan.path.uab.edu), CCLE database (https://portals.broadinstitute. org/ccle) and TIMER database (http://timer.comp-genomics.org) to analyze the expression of TMEM205 in cancer.
In vivo tumorigenesis assay
This study utilized 20 male BALB/c nude mice (5 weeks old) purchased from Beijing Vital River Laboratory Animal Technology Co., Ltd. The mice were bred in a pathogen-free environment at a temperature of 22 °C, humidity of 50%, and a 12-h light/dark cycle. Subcutaneous xenograft tumor models were established by subcutaneously injecting a mixture of 5 × 10⁶ SGC-7901/DDP cells and Matrigel (BD Biosciences, Franklin Lakes, NJ, USA) into the right inguinal area of 10 nude mice. Subsequently, another set of 10 nude mice received subcutaneous injections of a mixture of 5 × 10⁶ SGC-7901/DDP (si-TMEM205-2) cells and Matrigel into the right inguinal area to establish subcutaneous xenograft tumor models. When the average tumor volume of the tumor-bearing mice reached 150–200 mm3, the mice were divided into four groups (control group n = 5, si-TMEM205-2 group n = 5, DDP group n = 5, si-TMEM205-2 + DDP group n = 5). The xenograft mice in the control group and si-TMEM205-2 group received physiological saline treatment, while the DDP group and si-TMEM205-2 + DDP group received cisplatin (10 ug) treatment via intraperitoneal injection every 3 days for a total of 7 injections. Tumor volume was measured using the modified ellipsoid formula (volume = 1/2[length × width2]). After 28 days of treatment with physiological saline or DDP, the mice were euthanized. Tumor tissues, as well as liver, kidney, and spleen tissues, were collected. The tissues were fixed in 10% formalin, embedded in paraffin for further hematoxylin and eosin (HE) staining or immunohistochemical analysis (Santa Cruz Biotechnology: Ki67 (Ki-67) sc-23900, CD44 (DF1485); E-cadherin (G-10); Vimentin (V9) sc-6260; MDR1/ABCB1 (G-1) sc-13131; MRP1 (QCRL-1) sc-18835); (Cell Signaling Technology: CD206/MRC1 (E6T5J) XP Rabbit mAb #24,595; Cell Signaling Technology: CD86 (E5W6H) Rabbit mAb #19,589). All experiments were approved by the Yanbian University Animal Ethics Committee.
Immunohistochemistry staining
The tumor tissue was placed in 4% paraformaldehyde for 24 h to facilitate fixation. Subsequently, transfer appropriately sized tissue samples into embedding boxes for dehydration and embedding. The microtome was activated, securing the pre-cooled wax block in the refrigerator at 4 degrees. The blade's distance was adjusted from the wax block and set the slice thickness to 4 μm before initiating the slicing process. Tissue sections were deparaffinized and rehydrated for antigenic thermal repair, allowing natural cooling at room temperature. Endogenous peroxidase activity was countered by incubating sections in 3% hydrogen peroxide (H2O2) (ZSGB-BIO) for 30 min. Tissue sections were incubated overnight at 4 °C with the respective primary antibodies (CD206, CD86, E-Cadherin, Vimentin, Ki67, CD44). On the following day, wet cassettes were prewarmed at 37 °C for 1 h, and then immersed sections in a PBS rinse within a small dye vat. Sections were incubated with secondary antibodies, diluted with PBS (protected from light), in a molecular hybridization chamber at 37 °C for 1 h. Sections were washed with PBS three times for 5 min each. Successively stain tissue sections with 3,3′-diaminobenzidine (DAB) (ZSGB-BIO) and hematoxylin solution.
HE staining
After paraffin embedding and dehydration, tissue sections are washed with PBS. The sections are then immersed in hematoxylin dye, which binds to the nuclear DNA, presenting a purple color. Subsequently, the sections are immersed in eosin dye, which stains the cytoplasm, presenting a pink color. Following alcohol and clearing agent treatment, the sections are dehydrated and cleared. Utilizing a neutral resin mounting medium, the slides are sealed to protect the sections and enhance durability. Ultimately, observation of the HE-stained sections under a microscope allows for a clear visualization of tissue architecture and cell morphology.
Statistical assay
GraphPad Prism 8.0 software (GraphPad, La Jolla, CA, USA) was used to analyze data. Two groups of data were compared by Student’s t test. Multiple groups of data were compared by one-way ANOVA. P value < 0.05 was statistically significant (*P < 0.05, **P < 0.01, ***P < 0.001, ****P < 0.0001), P value > 0.05 has no statistically significant (ns). All experiments were repeated three times.


留言 (0)