
記住我

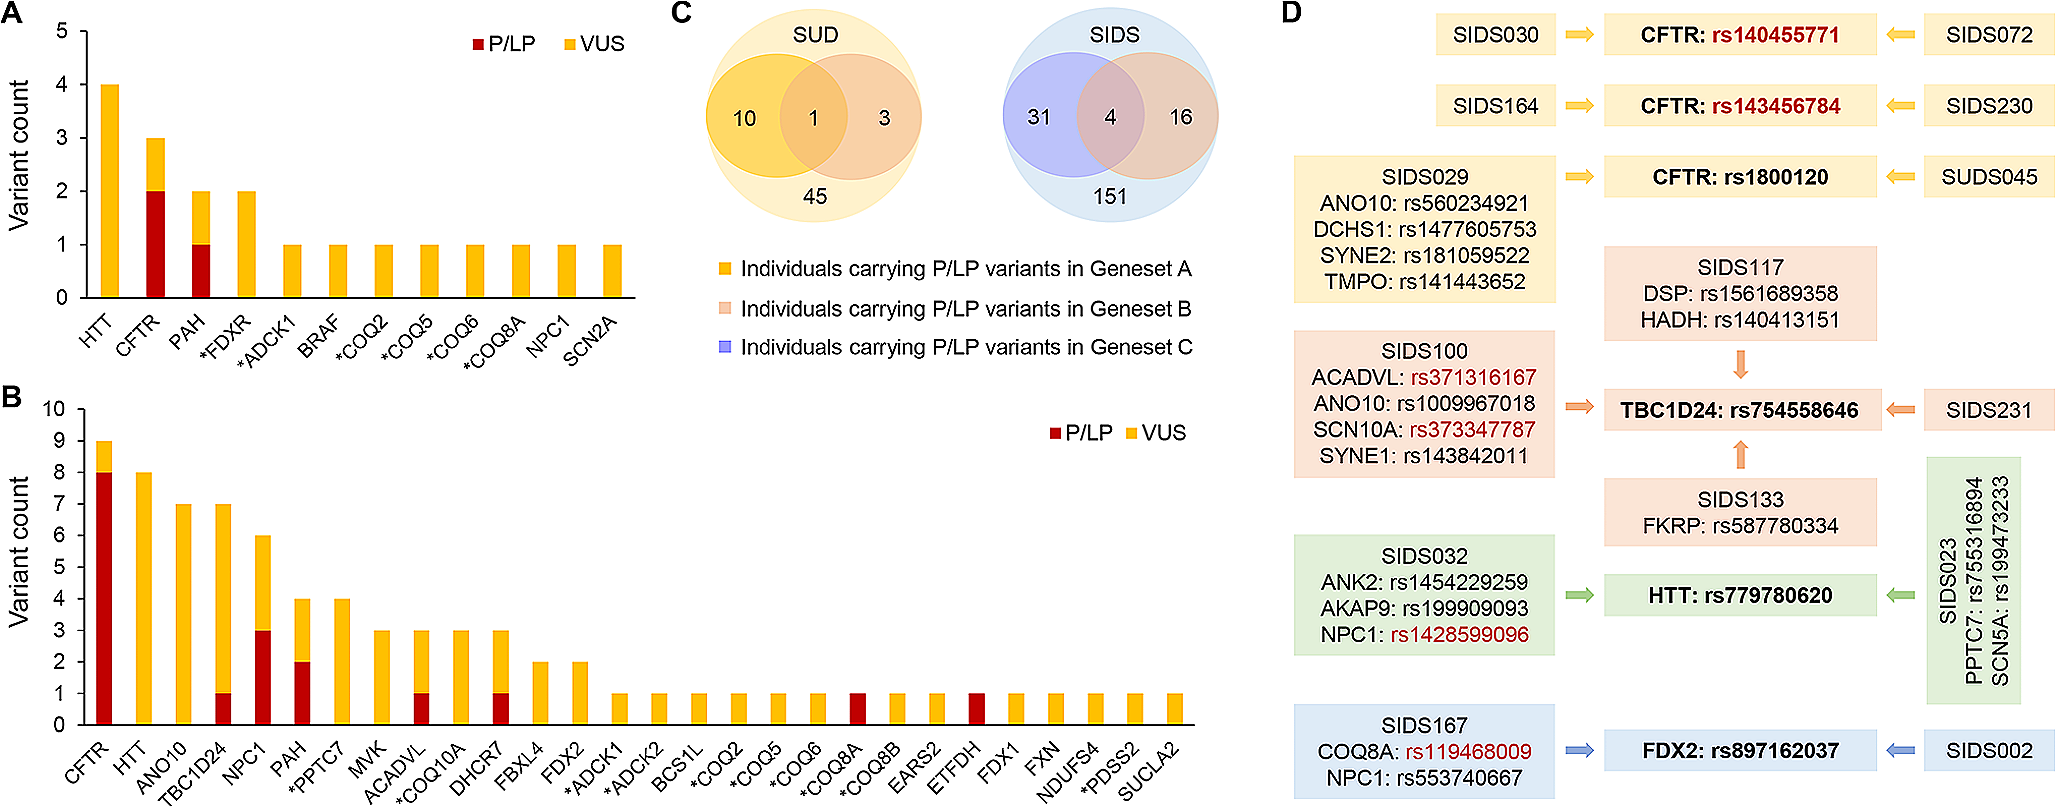
A total of 3 rare pathogenic or likely pathogenic (P/LP) variants were found in 3 different SUD cases (7%). Two of these variants were identified in the exonic region of CFTR and one in the exonic region of PAH. In addition, 16 variants of uncertain significance (VUS) in 12 genes were identified in 14 (31%) SUD cases. Among these VUS, 10 were located in the exonic region and 6 in the UTR. In total, 17 (38%) SUD cases were identified as harboring rare variants with likely functional effects (Supplementary Table S2). A total of 7 and 12 rare variants with likely functional effects were found to affect primary CoQ deficiency-related genes and secondary CoQ deficiency-related genes, respectively. Among the affected genes, HTT has the highest prevalence of variants in the SUD cohort (Fig. 1A). In terms of clinical evidence, 12 (63%) of the variants were not evaluated before, since an interpretation for these variants in the ClinVar database was not available. Additional demographic characteristics of the above mentioned 17 SUD cases can be found in Supplementary Table S3.
Fig. 1
Rare variants with likely functional effects in the case cohorts. Genes marked with an asterisk indicate primary CoQ deficiency-related genes. (A) 19 rare P/LP variants or VUS distributed in 12 known human CoQ deficiency-related genes were identified in 17 out of the 45 SUD cases (38%). (B) 76 rare P/LP variants or VUS distributed among 28 known human CoQ deficiency-related genes were identified in 56 out of the 151 SIDS cases (37%). (C) P/LP variants in genes associated with cardiovascular/metabolic diseases were previously identified in 10 SUD cases and 31 SIDS cases, respectively. Among the 3 SUD cases and 16 SIDS cases harboring at least one of the P/LP variants in Geneset B (44 human CoQ deficiency-related genes), P/LP variants in Geneset A (244 genes analyzed in the SUD study) and Geneset C (192 genes analyzed in the SIDS study) were also identified in 1 SUD case and 4 SIDS cases, respectively. (D) Among the P/LP variants or VUS identified, 6 variants occurred in two or more cases (highlighted in bold). These included 2 LP variants (rs140455771 and rs143456784) and 4 VUS (rs1800120, rs754558646, rs779780620, and rs897162037). The 4 VUS were also found to coexist with several other P/LP variants (highlighted in red) or VUS in genes associated with cardiovascular/metabolic diseases or CoQ deficiency
In the SIDS cohort, 18 rare P/LP variants were identified in 8 genes (ACADVL, CFTR, COQ8A, DHCR7, ETFDH, NPC1, PAH, and TBC1D24) in 16 cases (11%), while another 58 rare VUS were identified in 26 genes in 46 (30%) cases. Taken together, a total of 56 (37%) SIDS cases were found to harbor rare variants with likely functional effects. Of the total 76 rare variants with likely functional effects, 40 were located in the exonic region and 36 in the UTR (Supplementary Table S4). As a secondary CoQ deficiency-related gene, CFTR has the highest prevalence of variants in the SIDS cohort (Fig. 1B). In terms of clinical evidence, 40 (53%) of the variants were novel and thus not evaluated in the ClinVar database before.
Within the 3 SUD cases and the 16 SIDS cases harboring at least one of the P/LP variants in the 44 CoQ deficiency-related genes, we had previously identified several P/LP variants in cardiovascular/metabolic disease-associated genes. Since 37 out of the 44 CoQ deficiency-related genes (Geneset B) were not included in either Geneset A or Geneset C, carriers with shared variants from different genesets were further investigated. As shown in Fig. 1C, one of the SUD cases (SUDS112) was found to harbor P/LP variants in the two Genesets A and B. Specifically, one LP variant was detected in Geneset B (CFTR) and 3 P/LP variants in Geneset A (ANK2, CALR3, and MLYCD) (Supplementary Table S5). In addition, 4 SIDS cases (SIDS045, SIDS091, SIDS100, and SIDS156) were found to harbor P/LP variants in the two Genesets B and C (Fig. 1C), with a total of 7 P/LP variants in Geneset B (ACADVL, ANO10, CFTR, DHCR7, and TBC1D24) and a total of 5 P/LP variants in Geneset C (ACADVL, CASQ2, SCN1B, SCN10A, and SYNE1) (Supplementary Table S5).
Among the P/LP variants or VUS identified in our SUD and SIDS cohorts, 6 variants appeared in two or more cases (Fig. 1D and Supplementary Table S6). One of the LP variants, CFTR: rs140455771, was the only variant identified in SIDS030 and SIDS072 after a thorough review of genes associated with cardiovascular/metabolic diseases and CoQ deficiency, suggesting that this variant might be a finding that deserves further functional investigation. Similarly, another LP variant, CFTR: rs143456784, was the only positive finding in SIDS164 and SIDS230. In addition, the 4 VUS identified in this study (CFTR: rs1800120, TBC1D24: rs754558646, HTT: rs779780620, and FDX2: rs897162037) were found to coexist with several other P/LP variants or VUS in genes associated with cardiovascular/metabolic diseases or CoQ deficiency. Thus, it was not possible to associate the phenotypic information of these cases with specific variants due to their complex genetic background.
Burden testing of rare exonic and UTR variantsA gene-based burden test between the SUD cases and 60,706 controls from the gnomAD datasets revealed a significant genetic burden in 17 out of the 18 genes containing at least one rare exonic/UTR variant under the dominant model, indicating a strong association of these genes with SUD in a dominant state. Besides, HTT also reached strong association signals under the recessive model, suggesting that variants in this gene might be pathogenic even in a recessive state (Fig. 2A and Supplementary Table S7). For SIDS cases, a significant genetic burden was observed in 34 out of the 36 genes containing at least one rare exonic/UTR variant under the dominant model. Among these, 3 genes (ANO10, MVK, and NPC1) also reached strong association signals under the recessive model (Fig. 2B and Supplementary Table S8). In general, the significant burden identified in the majority of CoQ deficiency-related genes confirmed that these genes harbor an excess of rare exonic and UTR variants in the SUD and SIDS cohorts compared to the general population.
Fig. 2
Burden testing of rare exonic and UTR variants identified in human CoQ deficiency-related genes. The x-axis represents the expected –log10(P) under a uniform distribution of p-values. The y-axis shows the observed –log10(P) from the burden testing data. Each data point represents a single gene. Genes highlighted in red indicate that there is a significant burden under both the dominant and the recessive models. Genes highlighted in orange indicate that there is a significant burden under the dominant model only. Genes in gray indicate that there is no significant burden under either model. (A) Significant genetic burden was observed in 17 genes (16 dominant and one both) in the SUD cohort. (B) Significant genetic burden was observed in 34 genes (31 dominant and 3 both) in the SIDS cohort
Abnormal ECG patternsA total of 3 male and 2 female mice from the 4-NB group died unexpectedly during the night between week 6 and week 7. For the remaining mice, electrophysiological and morphological measurements were performed during week 9. To investigate the effect of CoQ deficiency on cardiac electrical activity, the ECG and echocardiographic patterns of the 4-NB and control groups were compared under equivalent HR conditions. ECG analysis showed that most parameters were not affected by the decrease in myocardial CoQ concentration. However, the PR interval was significantly prolonged in the 4-NB group compared with the control groups, irrespective of sex (Fig. 3). Moreover, during the same observation period, the 4-NB group developed more frequent isolated arrhythmic events as compared to the Ctrl-B group, including premature ventricular contraction (PVC), premature atrial contraction (PAC) and atrioventricular block (AVB) (Fig. 4).
Fig. 3
Comparative analysis of electrocardiographic observations in the 4-NB and control groups. Each data point represents the average value of 3 replicates for the same mice. For both males (A-D) and females (E-H), QRS and QT intervals were similar between groups at steady heart rate, whereas PR interval was significantly longer in the 4-NB group (N male = 6; N female = 7) compared to Ctrl-A (N both = 9) and Ctrl-B (N both = 9) (*P < 0.05; **P < 0.005)
Fig. 4
Differences in the occurrence of arrhythmic events and representative surface ECG recordings. (A) Colored cells indicate different scenarios where certain types of arrhythmic events were observed for at least once during the measurements. (B-D) The total number of subjects with different arrhythmic events observed. (E-H) The illustration of normal ECG recordings versus typical AVB, PAC, and PVC
Morphological and histological characteristicsOverall, the body weight increase of the 4-NB group was slower than that of the control groups throughout the growth phase. Significant differences in body weight and heart weight were observed between the 4-NB and control groups at week 9. However, the heart weight to body weight ratio (HW/BW) remained unchanged after 6 weeks of treatment (Supplementary Figure S1). In terms of echocardiographic patterns, the IVS, LVID and LVPW thickness were generally reduced in the 4-NB group. The difference was particularly evident in female mice, as LVPW at end systole was the only parameter with a statistically significant difference between groups (Table 1). Nevertheless, no difference in EF and FS was observed.
Table 1 Echocardiographic measurements in the 4-NB and control groupsIn general, no obvious structural defects of the heart or other organs were observed at autopsy. To assess the degree of fibrosis in the different groups, the histological characteristics of the mouse heart sections were further examined using Masson’s trichrome staining. As shown in representative histological images (Supplementary Figure S2A-C), no significant cardiomyocyte changes were observed in the 4-NB group. CoQ quantification of frozen heart tissues was then performed to validate whether the CoQ deficiency model was successfully constructed. The correlation coefficient (R2) of the regression fitting was 0.9991 for CoQ9, indicating a satisfactory quantitative relationship between MS response and CoQ9 concentration. As expected, the myocardial CoQ9 concentration was significantly lower in the 4-NB group compared to the control groups (Supplementary Figure S2D-E).
留言 (0)