
記住我

We studied 88 subjects: 70 immunodeficiency patients from the Immunology Department of Hospital Clínico San Carlos (Madrid, Spain) diagnosed with CVID (n = 27), selective IgA deficiency (SIgAD) (n = 23) and SID with active haematological malignancy (chronic lymphocytic leukemia, CLL or multiple myeloma, MM) (n = 20). Eighteen healthy controls (HC) were also studied for sBCMA levels. Due to resource limitations, were only able to obtain healthy controls to carry out the comparison of sBCMA levels, so we decided prioritize it in order to validate previous studies.
The majority of the CVID diagnoses in our study occurred between 2013 and 2023, with three earlier cases identified, providing a broad temporal perspective on disease onset and progression. The clinical and immunological profiles of our cohort are documented in Table 1. A substantial portion of our CVID patients displayed diverse manifestations associated with immune dysregulation, such as autoimmune phenomena in 61.5% (n = 16), interstitial lung disease (ILD) in 15.38% (n = 4), enteropathy in 42.3% (n = 11), and a notable history of malignancies in 44.4% (n = 12), 50% (n = 6) of them haematological. All patients with CVID and a history of haematological malignancy were diagnosed with Non-Hodkin lymphoma subsequent to CVID diagnosis and were in complete remission at the time of the study.
Table 1A Shows a summary of the clinical manifestations of the patients studied including infections and manifestations of immune dysregulationTable 1B Shows a summary of the immunological status of the patients studied, including immunoglobulins at diagnosis, vaccine response, and T and B lymphocyte levels. It should be noted that in case of SID patients, the immunoglobulins are those shown at diagnosis of immunodeficiency after many of them had previous immunosuppressive treatmentAll patients diagnosed with CVID were undergoing immunoglobulin replacement therapy (IgRT) at the time of the study, with the exception of one patient. This latter patient was pending treatment initiation due to clinical stability and stable IgG levels, thus 96.3% (n = 26) of the CVID cohort was receiving IgRT. Among these, the majority (80.77%, n = 21) were on intravenous immunoglobulin (IVIg) prophylaxis, while a smaller fraction (19.23%, n = 5) received subcutaneous immunoglobulin (SCIg) prophylaxis. Within the other patient cohorts studied, 60% (n = 12) of the SID patients were treated with IgRT, predominantly through IVIg (91.67%, n = 11), with a single patient (8.33%, n = 1) receiving SCIg, whereas none of the Selective IgA Deficiency (SDIgA) patients were undergoing IgRT.
The detection of low levels of IgG and IgA did not effectively distinguish between CVID and SID patients, also considering the possible occurrence of clonal immunoglobulin in SID cases. However, IgG and IgA levels at diagnosis were significantly lower in CVID group with respect to SID and SDIgA patients (p < 0.0001 and p = 0.0002, respectively). A smB-comparison was not conducted between PID and SID due to the influence of the monoclonal component, which could potentially skew the results.
No significant differences were found in terms of sex. Proportion of women in the different groups was as follows: 55.56% in CVID; 56.52% in SIgAD; 60.00% in SID; and 61.11% in HC. Median age was as follows: CVID 50.19 years (from 19 to 81); SIgAD, 46.70 years (from 16 to 86); SID, 70.85 years (from 53 to 87); HC, 39.79 years (from 22 to 70). Age of the SID group was significantly higher than the remaining groups (p < 0.05).
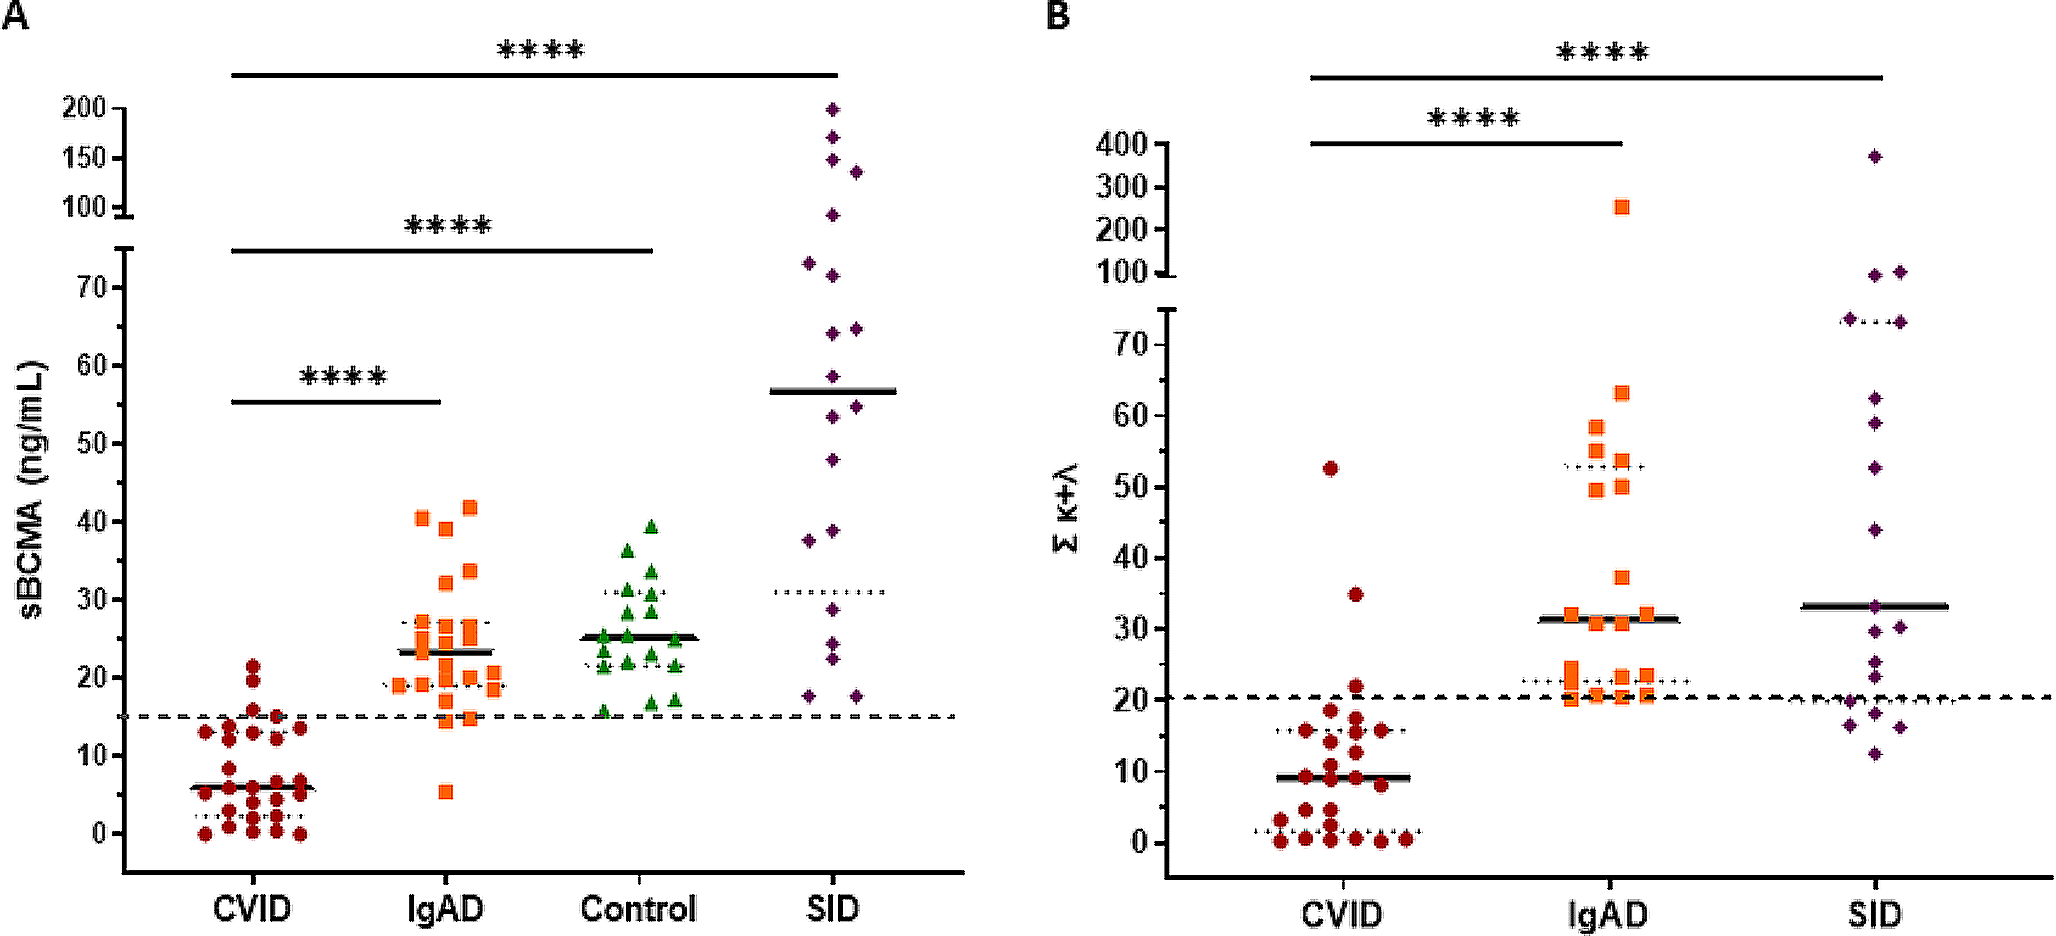
sBCMA and the Sum κ + λ Levels were Significantly Reduced in CVID Patients Compared to SIgAD, SID Patients and Healthy ControlssBCMA levels were significantly decreased in CVID patients (median 5.97) compared to SIgAD patients (median 23.30, p < 0.001), to SID patients (median 56.75, p < 0.001) and to HC (median 25.20, p < 0.001) (Fig. 1A). No differences were observed neither between SIgAD patients and controls or between SID patients and controls. The highest levels corresponded to SID patients. Specifically, two CLL patients and two patients with MM exceeded 100 ng/mL of sBCMA detected in serum (136, 199; and 148, 171 respectively); and two patients, one CLL patients and one MM patient, exceeded 100 in the sum κ + λ (101 and 373, respectively).
Fig. 1
(A) Comparison of soluble BCMA levels between patients with humoral deficiencies (CVID and SIgAD), healthy controls without any deficiency and patients with active hematological malignancy (and (SID); (B) Comparison between the sFLC sum between patients with humoral deficiency (CVID and IgAD) and patients with active hematological disease (SID)
Similarly, the sum κ + λ was significantly decreased in CVID patients (median 9.10) compared to SIgAD patients (median 31.45, p < 0.001) and to SID patients (median 33.20, p < 0.001) (Fig. 1B).
Although IgG measurement would be the first step to follow for the diagnosis of CVID, we decided to focus on vaccine response on behalf of traditional biomarkers, due to the correlation between these markers and the fact that IgG measurements, while necessary, are not uniquely indicative of CVID but are common across most classical humoral immunodeficiencies. In our cohort, the sensitivity (Se) and specificity (Sp) values for IgG below 500 mg/dL at diagnosis are 89.47% and 100% respectively compared to sIgAD. Indeed, it has been described that measuring IgG levels alone are not provide a definitive diagnosis and are necessary additional test for evaluating the functionality of immune humoral cells.
Subsequent analysis focused on assessing the diagnostic performance of these novel biomarkers through ROC curve analysis, juxtaposed against gold-standard antibody responses as well as prognostic biomarkers, specifically the proportion of smB cells and the VISUAL score, within our cohort of CVID and SIgAD patients. The evaluation of vaccine-induced antibody responses utilized Pearson’s chi-square test, yielding statistically significant results (p < 0.001) as detailed in Table 2. As shown, all examined parameters showed adequate diagnostic performance. Importantly, the two most effective classifiers within our study cohort were the specific antibody response and the sum κ + λ chains.
Table 2 Summary table of each of the biomarkers used for the diagnosis of CVID and their potential utility in our patient’s cohort. Sensitivity and specificity for each variable was calculated with previously set cut-off values for smB, Sbcma,, VISUAL score in CVIDsBCMA Levels Correlate with Other Diagnostic and Prognostic Markers of CVIDFurther, we investigated the associations among smB phenotype, sBCMA, the sum κ + λ and VISUAL score, in relation to the diagnosis of CVID by applying Pearson’s correlation coefficient. The outcomes, presented in Table 3, indicated statistically significant correlation coefficients (r) across four examined parameters. As shown, sBCMA positively correlated with both the sum κ + λ (r = 0.63) and smB phenotype (r = 0.407); while inversely with VISUAL score (r = -0.58). Moreover, smB strongly correlated with VISUAL (r = 0.60). The sum κ + λ did not correlate either with smB cells or VISUAL score.
Table 3 Correlation matrix between different biomarkers and CVID and SIgAD patientsCharacteristics of Outliers and Their Relationship to Prognostic BiomarkersWe then evaluated whether outliers for sBCMA > 15.00ng/mL and the sum κ + λ ≥ 20.20 in 5 patients could predict severe clinical evolution, as shown in Table 4. In particular, 3 of the 5 patients had hematological cancer. The mean age of CVID-outliers was 58.8 years and the mean age in SDIgA was 43.33 years. Female patients were the most in both cases (60%, n = 3 in CVID; 66.67%, n = 2 in SDIgA).
Table 4 Further clinical evaluation of patients with outliers, including those in the IgAD patient cohortSerum IgA values at diagnosis were significantly higher in CVID patients with sBCMA and sum κ + λ outliers compared with the remaining CVID patients (p = 0.0162; p = 0.0250, respectively). By contrast, the 3 SIgAD patients showed significantly lower IgM at diagnosis than the remaining SIgAD cohort (p = 0.0457). No differences in IgG levels were found.
As expected, all CVID patients with VISUAL > 10 (n = 16; 72.72%) had severe complications according to clinical severity scores of Ameratunga [11] and Grimbacher [12]. CVID patients with smB ≤ 2% (n = 8, 30.77%) presented with autoimmune disease, enteropathy and/or lymphoproliferative disease. Three SIgAD patients disclosed sBCMA values below the cut-off of 15, which might suggest progression to CVID, to be confirmed in prospective follow-up.
Multiple Regression and B Predicting Decision AlgorithmAs a final step, we confronted all the studied biomarkers in our cohort of CVID and SIgAD patients to assess the relevance of their contribution in the definition of the disease and to develop the best-fit algorithm for CVID diagnosis without pre-selection. Multivariate regression was tested through decision- tree model, and then validated using Leave-One-Out Cross-Validation (LOOCV).
The parameters that optimized the diagnostic performance of the C5.0 decision tree, according to LOOCV, were as follows: method = tree, window = false, and trials = 10. The resulting model had an AUC of 0.946, sensitivity of 0.85, and specificity of 0.95. The decision tree obtained in the first trial of the C5.0 algorithm included the global response to vaccines and the sum κ + λ, as shown in Fig. 2. A decision tree composed of global response to vaccines, smB percentage, and sBCMA yielded slightly improved results, albeit with a significant increase in complexity.
Fig. 2
Decision tree model split the 50 non-selected patients according to specific antibody responses (node 1) as the strongest predictor into normal responses (node 2), or altered responses. The second most relevant variable was sum κ + λ (node 3), which divided the remaining patients with sum κ + λ ≤ 24.5, which were all CVID patients; and in node 4, above 24.5, with mostly SIgAD
留言 (0)