
記住我


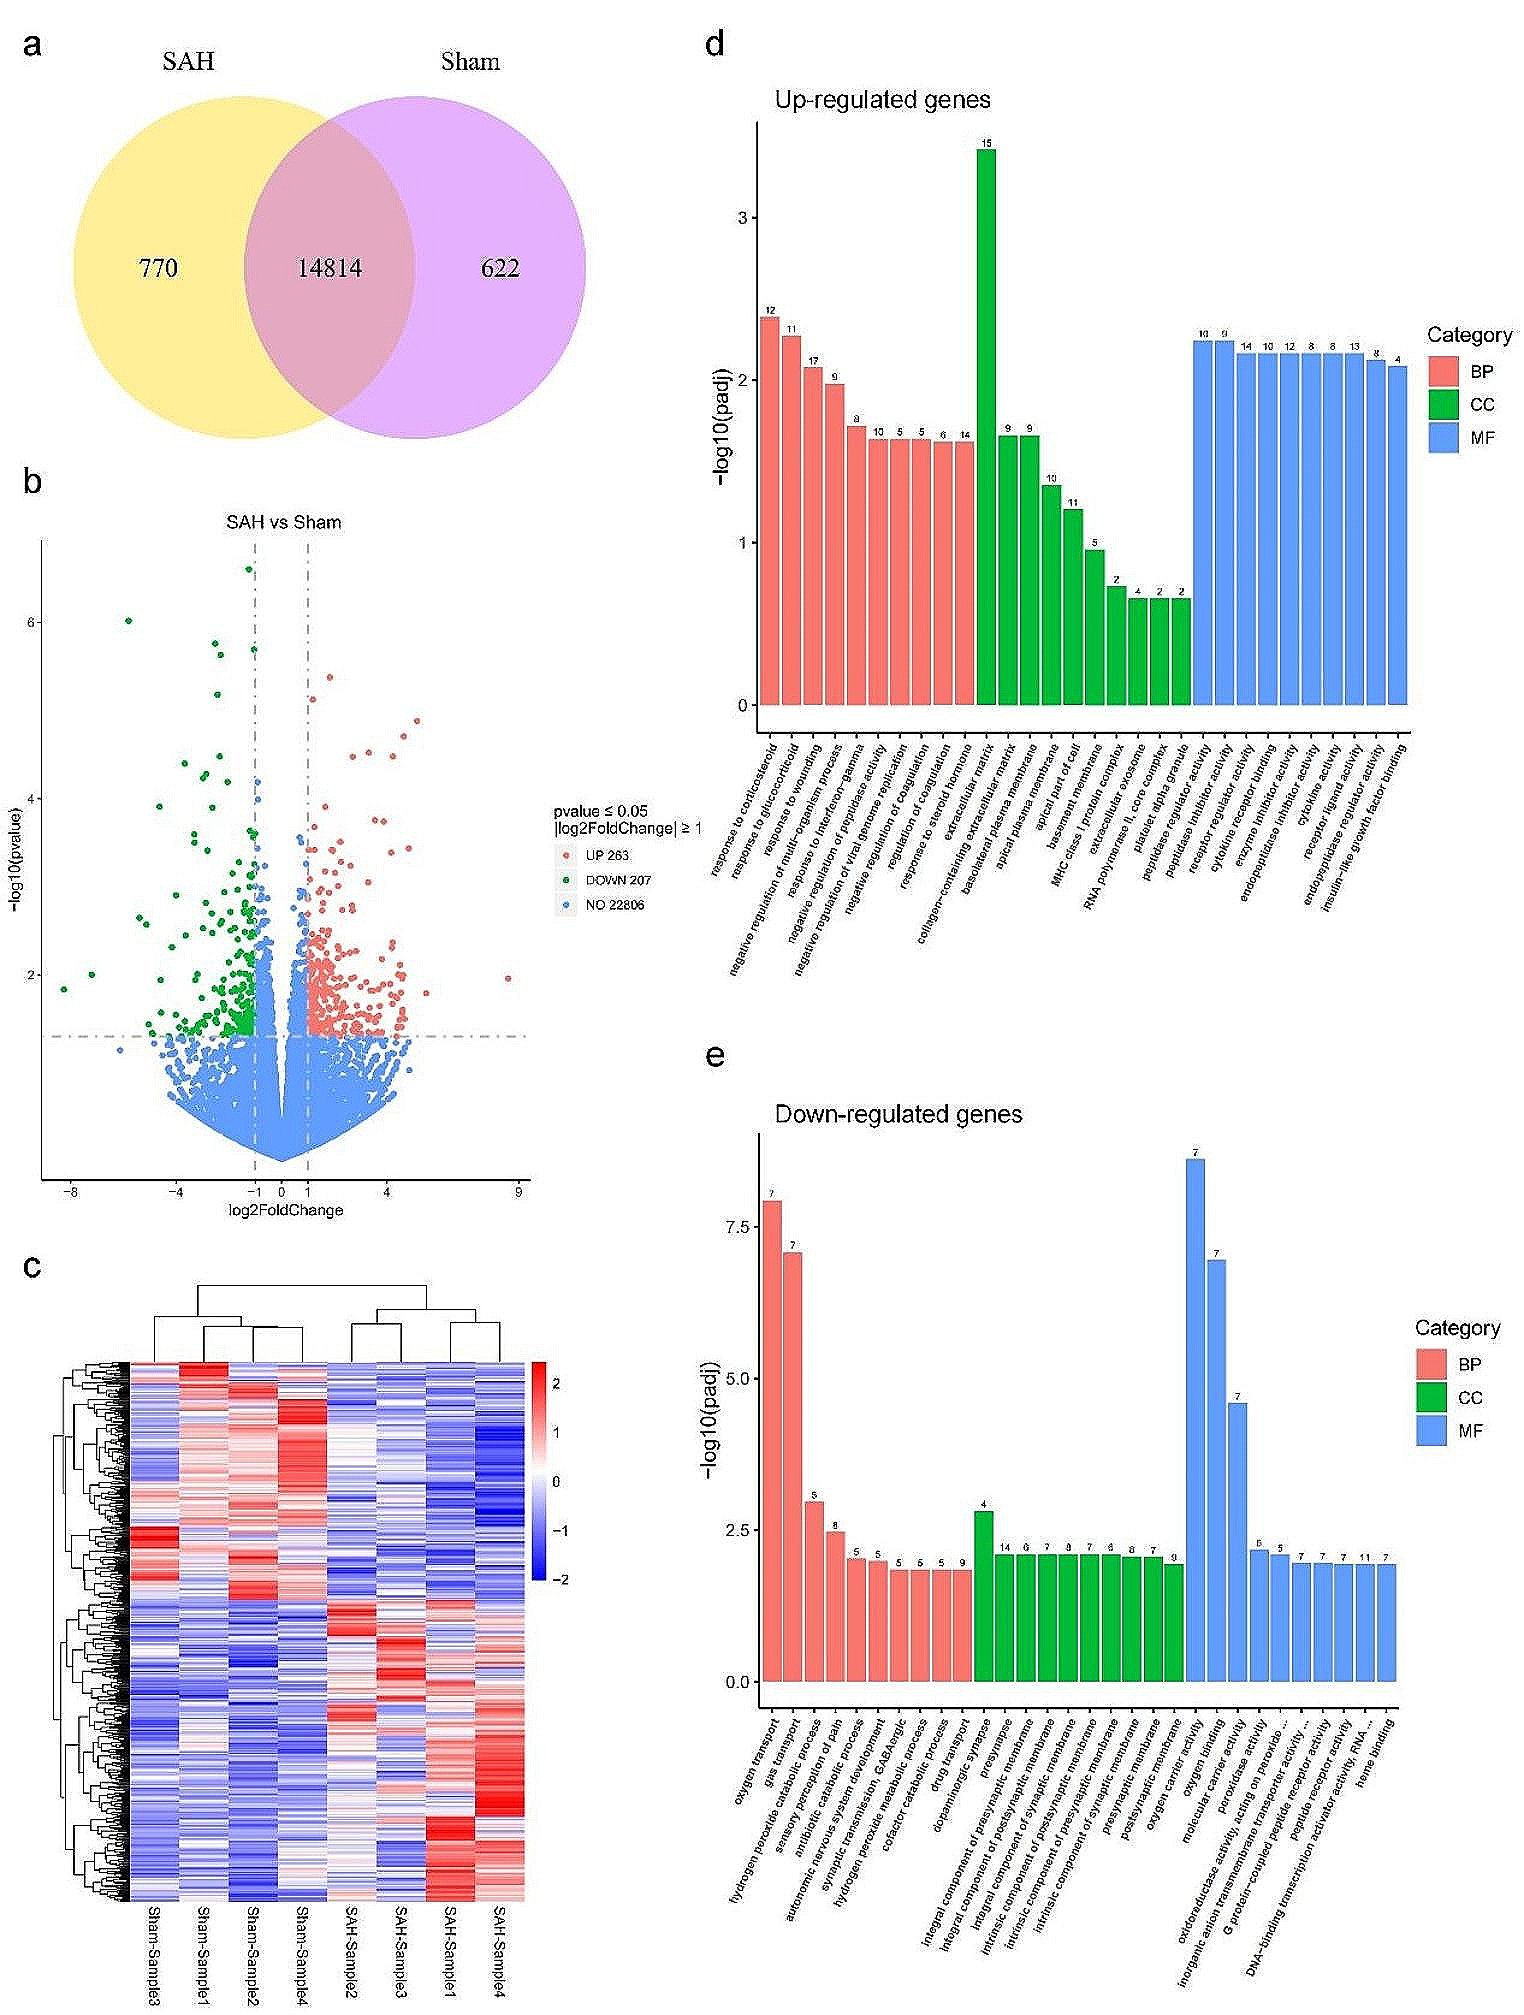
Genes with FPKM value greater than 1 in the transcriptomics data were considered as expressed genes. Venn diagram demonstrated the distribution of the number of genes annotated only in SAH group (770), only in Sham group (622), or in both groups (14,814) (Fig. 1a). Transcriptional changes in SAH were determined and the screening conditions for differentially expressed genes (DEGs) were |Log2FoldChange| ≥ 1 and Padj ≤ 0.05. Therefore, the distribution of 263 up-regulated differential expressed genes and 207 down-regulated differential expressed genes was visualized more by volcano plots (Fig. 1b). DEGs were clustered in a heatmap to highlight transcriptomic differences between SAH groups and Sham groups (Fig. 1c). To determine relevant biological processes after SAH, we analyzed the top 20 differential genes by GO enrichment analysis (Supplementary Fig. 1). We found that the differential genes in biological processes (BP) were mainly involved in “gas transport” and “oxygen transport”. Cellular Component (CC) showed that differential genes are heavily clustered in the extracellular matrix and exert functions such as oxygen carrier activity, oxygen binding, and molecular carrier activity. We further performed GO analysis on up-regulated genes and down-regulated genes separately (Fig. 1d, e). Based on the results we found that the up-regulated genes were more concentrated in “response to corticosteroid”, “response to glucocorticoid”, and “response to wounding”, and were significantly enriched in the extracellular matrix, while the down-regulated genes were mainly enriched in “gas transport” and “oxygen transport”. The top 5 genes related to the above specific GO terms were shown in Supplementary Table 1.
Fig. 1
Profiling of different expression genes (DEGs) in rats between SAH groups and Sham groups. a Venn diagram showing the number of genes in SAH groups and Sham groups. b Volcano plot of RNA-seq results showing statistics of up-regulated and down-regulated genes (log2FC ≥ 1; p-value ≤ 0.05). c Heatmap of DEGs in SAH groups compared with Sham groups. d Go enrichment analysis of up-regulated genes e Go enrichment analysis of down-regulated genes. BP: Biological process; CC: Cellular component; MF: Molecular function
KEGG pathway analysis reveals neuro-related signaling and metabolism-related signalingKEGG enrichment analysis was carried out for the above DEGs, and the top 20 significantly enriched pathways were shown on bubble charts (Fig. 2a, b). We found that up-regulated genes were associated with complement and coagulation cascades, IL − 17 signaling pathway, PI3K-Akt signaling pathway, and bile secretion, while down-regulated genes were associated with African trypanosomiasis, malaria, neuro-related signaling (Neuroactive ligand-receptor interaction and Axon guidance), and metabolism-related signaling (Fatty acid elongation). Additional validation of the expression of these pathways was performed using GSEA (Fig. 2c to h and Supplementary Table 2). The top five most up-regulated genes related to immunity include: Kng1, Procr, LOC100911545, coagulation factor III (F3), and coagulation factor II (F2). The top five most up-regulated genes related to the IL-17 signaling pathway include: Mmp13, Mmp3, Nfkbia, Hsp90aa1, and Ikbkb. The top five most up-regulated genes related to primary bile acid biosynthesis include: Baat, Cyp27a1, Cyp39a1, Acox2, and Hsd3b7. The top five most down-regulated genes associated with Neuroactive ligand-receptor interaction include: Adora2a, Gria3, Ptger4, Tacr3, and Thra. The top five most down-regulated genes associated with fatty acid metabolism include: Cpt1a, Elovl5, RGD1560015, Ehhadh, and AABR07039037.1. The top five most down-regulated genes associated with axon guidance include: Ntng1, Arhgef12, Fyn, LOC100910732, and Efna3.Then we further analyzed the expression levels of the top expressed genes in different groups by scatter bar chart (Fig. 3a to f). We found that Kng1 and Mmp13 were significantly different in the SAH and Sham groups.
Fig. 2
The functional enrichment analysis of DEGs. a and b Scatter plot of the top 20 KEGG pathways enriched among the up-regulated and down-regulated genes, respectively. c to h. Gene set enrichment analysis (GSEA) showing neuro-related signaling, immune-related signaling, and metabolism-related signaling
Fig. 3
Comparison of the gene expression of RNA-seq. The data represent the relative gene expression using FPKM value of a Kng1, P = 0.016, b Mmp13, P = 0.009, c Baat, P = 0.110, d Adora2a, P = 0.290, e Cpt1a, P = 0.327, f Ntng1, P = 0.458. *P < 0.05; **P < 0.01; ***P < 0.0001. N = 8, with n = 4 for SAH, n = 4 for Sham
Metabolites profiling of SAH showed significant difference compared with sham groupBased on the transcriptome results, we performed metabolomic characterization against sera from SAH rats and Sham rats. The PCA results of all samples in positive and negative ion mode were demonstrated in Fig. 4a, b. The samples from the SAH and Sham groups were clearly separated, exhibiting significant differences between the two groups. Partial Least Squares Discrimination Analysis (PLS-DA) was a supervised statistical method for discriminant analysis, and the relationship between metabolite expression and SAH samples was modeled using partial least squares regression. PLS-DA analysis showed that the samples were significantly separated into the SAH and Sham groups (Supplemental Fig. 2, a and b). Moreover, the relative levels of the metabolites were measured at the same level based on z-scores (Supplementary Fig. 2, c and d), Via LC-MS metabolomics analysis, 779 annotated metabolites, including 526 positive ion mode metabolites and 253 negative ion mode metabolites, were identified. Among the above 779 annotated metabolites, 48 metabolites were differentially expressed metabolites (DEMs). Further screening of 48 DEMs, we identified 11 up-regulated and 26 down-regulated metabolites in positive ion model, and 1 up-regulated and 10 down-regulated metabolites in negative ion model (Fig. 4c, d). According to the results of the quantitative analysis, to visualize the differential metabolites, we further demonstrated the up- and down-regulation of differential metabolites and metabolites with large fold-change in differences (Fig. 4e, f). We found that 3,3’,5-Triiodo-L-thyronine was the most up-regulated metabolite and N-Oleoyl Glycine was the most down-regulated metabolite in the positive ion model. While in the negative ion model, dCDP was the only up-regulated metabolite and chenodeoxycholic acid, indolelactic acid and docosanoic acid showed significant down-regulation. Up- and down-regulated differential metabolites were clustered in a heat map used to highlight metabolomic differences between the SAH and Sham groups (Supplemental Fig. 3, a and b), and the results showed that the two groups varied largely. Pearson correlation analysis revealed significant associations between the TOP 20 differential metabolites (Fig. 4g, h). Among the positive ion model, 12(S)-HETE had a significant positive correlation with N-Oleoyl Glycine (r = 0.950, P < 0.001) and Lysopa 18:0 was strongly positive correlated with N-Oleoyl Glycine (r = 0.953, P < 0.001) and 12(S)-HETE (r = 0.938, P < 0.001), respectively. Among the negative ion model, strong positive correlations existed for Glutathione (oxidized) and 2-Oxoglutaric acid (r = 0.797, P < 0.001), and 9-HOTrE was positively correlated with 11(Z),14(Z)-Eicosadienoic Acid (r = 0.848, P < 0.001), Lysope 18:1 (r = 0.808, P < 0.001), and FAHFA (22:5/18:1) (r = 0.793, P < 0.001), respectively.
Fig. 4
Analysis of differentially expressed metabolites (DEMs) between SAH groups and Sham groups. a and b PCA was performed for dimension reduction analysis of metabolites in rats. Axes showed the percentage of variance of the first two components (PC1, PC2). The ellipse was the 95% confidence interval. c and d Volcano plot of the significant differences in the DEMs. The horizontal and vertical axes represent the fold-change (FC) and P-value, respectively. VIP: Variable important in projection. e and f Matchstick chart showed the top 20 up- and down-regulated metabolites. The color of the point represented up- and down-regulation. Red represented up-regulation, and blue represented down-regulation; the length of the bar represented the value of log2 (FoldChange); the size of the point represented the VIP value. g and h Pearson correlation coefficient to analyze the correlation between various metabolites. The positive correlation tended to be 1 and the negative correlation tended to be -1. All left figures: positive ion model; All right figures: negative ion model
Potential metabolic pathways associated with bile acid in SAHAs shown in Fig. 5a and b, KEGG pathway analysis showed that DEMs in positive ion model were mainly enriched in pathways such as biosynthesis of unsaturated fatty acids, bile secretion, and ABC transporters. While DEMs in negative ion model were mainly enriched in the pathways of primary bile acid biosynthesis, pyrimidine metabolism, bile secretion, and biosynthesis of unsaturated fatty acids. These results were consistent with what we observed in the transcriptome analysis. Specifically, we performed pathway searches and regulatory network interaction analyses for Top 20 differential metabolites (Fig. 5c, d). Comparing the two groups, we found 17 pathway differences and 16 substance differences in the positive ion model; whereas 10 pathway differences and 15 substance differences in the negative ion model. In addition, we classified metabolite pathway types in multiple dimensions based on HDBM, KEGG, and LIPIDMAPS databases (Supplementary Fig. 4, a to f).
Fig. 5
Metabolic pathway analysis of differentially expressed metabolites (DEMs). KEGG enrichment bubble charts of differential metabolites in positive ion model (a) and negative ion model (b). Network diagram of KEGG enrichment analysis of the top 20 differential metabolites in positive ion model (c) and negative ion model (d)
留言 (0)