
記住我

Eight undergraduate students, three men and five women, between 18 and 20 years old were recruited from a class of General Psychology at a University in the State of México. Given the restrictions of the university to access physical infrastructure owing to the COVID-19 pandemic, participants performed the experiment from their homes using Zoom® videoconferencing software. The information from the experiment, as well as the procedure to participate in the experiment, were posted on the institutional university webpage.
To participate in the experiment, students had to complete an online questionnaire that requested information about their academic background and any visual perception disabilities. This information was required to determine if participants could participate in the experiment (see below). They also had to submit a screenshot of the results of an online internet velocity test applied to their internet connection (https://www.speedtest.net/). Inclusion criteria to participate in the experiment were being a first-year undergraduate student enrolled in the Psychology program at the university. This was done to avoid participants knowing about behavior analysis or theory regarding schedules of reinforcement. Exclusion criteria were being diagnosed with color vision deficiency and/or reporting an internet connection lower than 10 Mbps (download) – 10 Mbps (upload). Participants provided written informed consent and were told that their participation was voluntary and that they could withdraw from the experiment at any time without any consequence. The research protocol and the informed consent form were reviewed and approved by the Ethics Committee of the university.
ApparatusAll experimental sessions were conducted online with an HP 240G4 Notebook PC running Windows 10. The experimental task was presented to participants using Zoom® Videoconference software via the “Remote control” function. This function allowed participants to control the experimenter’s computer remotely and interact with the task in real time. The experimenter used an internet connection of 50 Mbps (download) – 50 Mbps (upload) with a ping of 25 ms for the experiment. The programming of the experimental task and the data collection system were accomplished by the author using Visual Studio 2019® for Windows.
SettingAll participants performed the experiment from their homes using Zoom® videoconferencing software. When participants entered the Zoom session, they had to demonstrate that they were alone in a quiet room by showing the experimenter the room they were in through their cameras. All participants met this requirement. Participants’ microphone and camera were requested to be turned on during the whole session. None of the participants experienced technical problems with their microphones or cameras. The experimenter had the camera turned on while the experiment took place but left the room after reading the instructions to eliminate the effects of his presence. The angle of the experimenter’s camera was arranged so that participants could see the experimenter leaving or entering the room. When the session finished, the task produced a sound that alerted the experimenter, so he could enter the room and debrief the participant. The experiment was conducted in a single session and lasted for about an hour for all participants. At the end of the experiment, the computer program showed the participant how much money they had earned. Participants earned an average of 90 pesos (5 US dollars) by the end of the session. Participants received money through an electronic bank deposit at the end of the session. Then, the experimenter debriefed and dismissed participants.
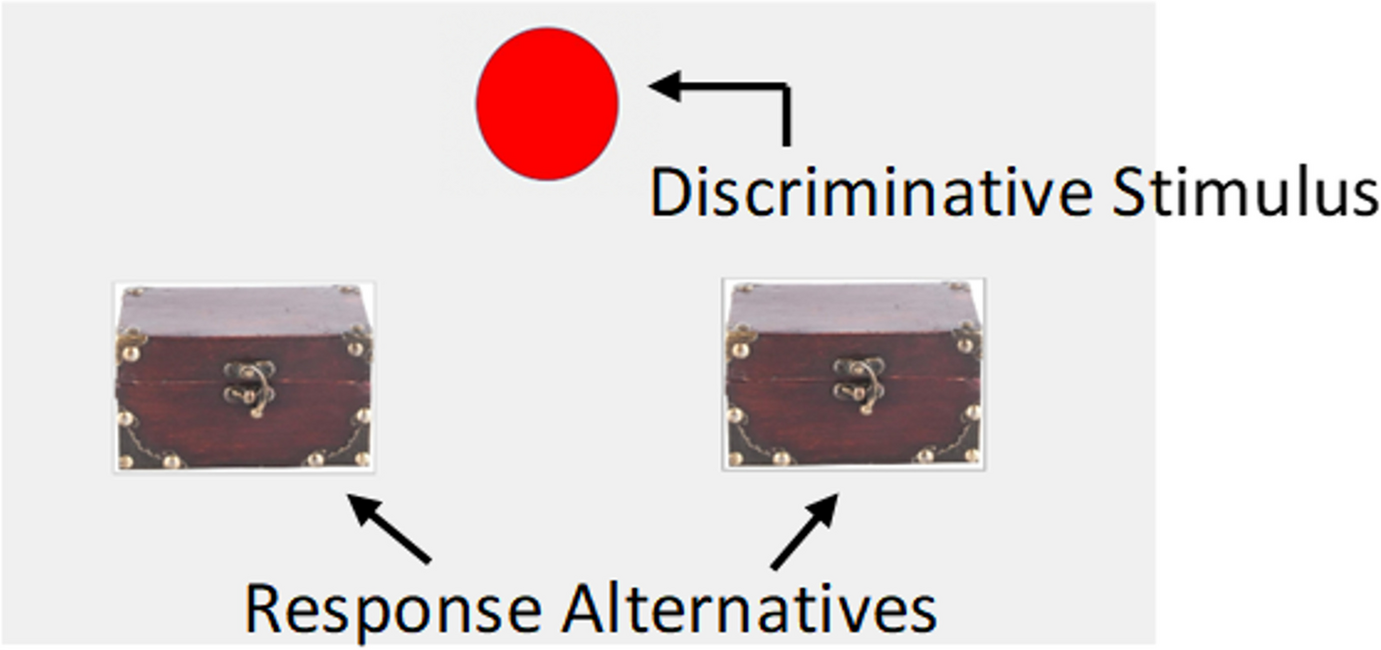
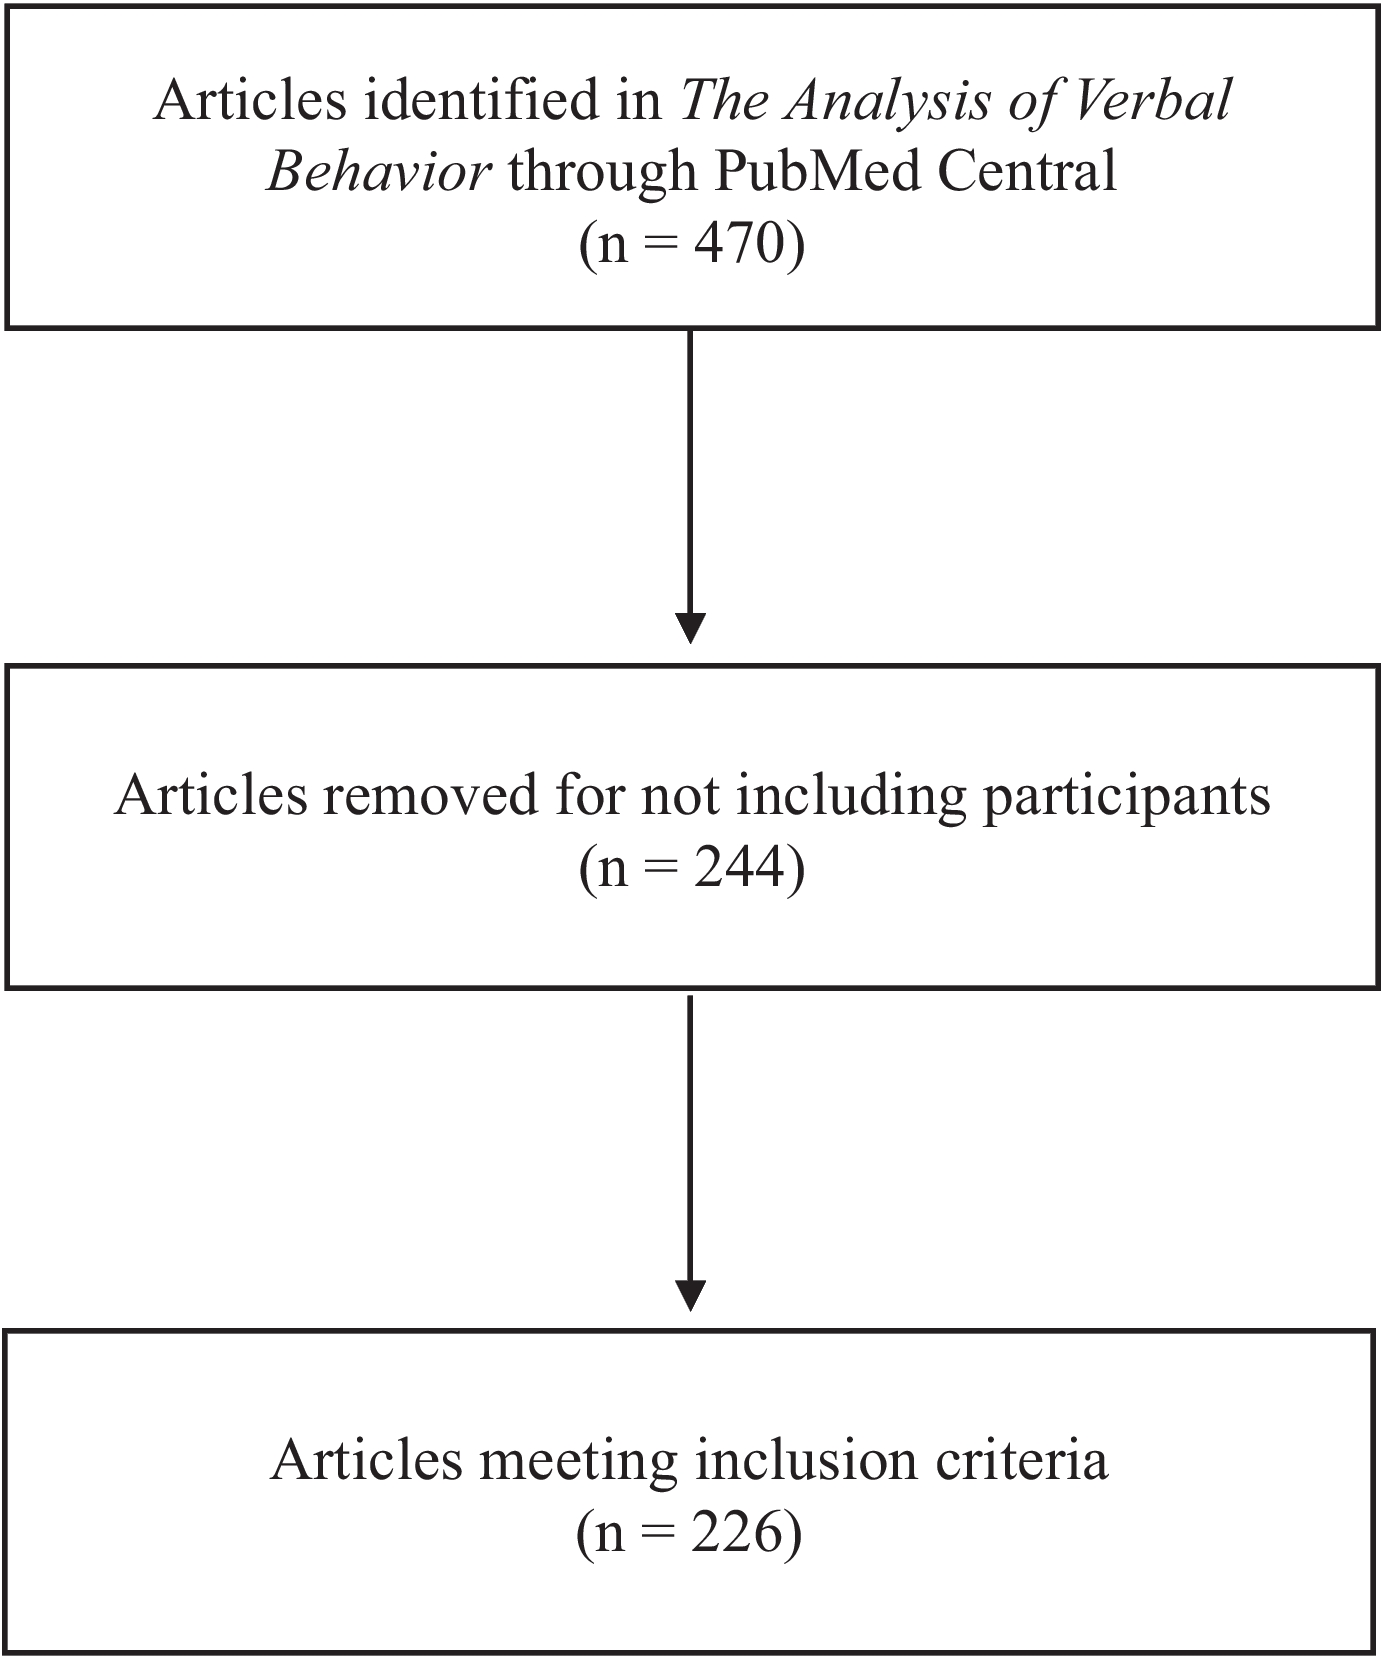
ProcedureThe experiment consisted of three experimental phases: training, the rule-test phase, and the choice-test phase. Experimental phases were presented in that order for all participants in all conditions. The training phase was designed to create a differential history of reinforcement to follow two rules in a clearly discriminable context that precisely signaled which rule had to be followed. During this phase, the experimental task involved a game where participants had to press one of two buttons, located on each side of the screen (Fig. 1). A 4.5 cm circle at the center top of the screen functioned as a discriminative stimulus (Fig. 1). The color of this circle changed from red to blue depending on the component in operation. The response alternatives were two identical 471 x 358 pixel buttons located on each side of the screen. Each button had an image of a chest (Fig. 1). Hereafter, the buttons will be referred to as the alternatives.
Fig. 1
An example of the screen of the experimental task during a component presentation
Training PhaseThe training phase consisted of the presentation of three blocks of six cycles of a two-component multiple schedule. Each six-cycle block was separated by a 30 s resting period. A cycle consisted of the presentation of the two components of the multiple schedule, each separated by a 10 s inter-component interval. The discriminative stimulus in each of the components was either a red or a blue circle. During a component, the colored circle constantly flashed at a rate of one flash per 235 ms to enhance its salience. Each of the components of the multiple schedule was 60 s, making 140 s the total duration of a cycle. Each component presentation was considered as an individual observation period. The inter-component interval was implemented to reduce carry over from previous components (Baron & Perone, 1998; Davison & Baum, 2002). The order of component presentation within a cycle was randomly determined at the cycle onset by the program.
During a component, participants could freely respond to the two response alternatives located on each side of the screen (Fig. 1). The alternatives were governed by two concurrent variable interval–extinction (VI–EXT) schedules. The operation of each concurrent schedule depended on the component in operation (Table 1). The two concurrent schedules had different VI schedules: a VI 60 s and a VI 10 s. The VI schedule of each concurrent schedule operated on either the left or the right alternative depending on the component in operation. The rules always instructed participants to respond to the VI in the presence of the different discriminative stimuli (see Table 1), making rule-compatible behavior the only behavior associated with reinforcement within a component. Schedule parameters were counterbalanced across participants in relation to the side of the VI and the color of the discriminative stimulus (see Table 1).
Table 1 Experimental parameters for each participant in Experiment 1Each VI schedule contained 20 intervals generated according to the method proposed by Fleshler and Hoffman (1962). This method allowed the creation of individual intervals that followed an exponential memoryless function, resulting in constant-probability VI schedules. Each time a component started, a list of intervals was generated for the VI schedule. An interval from that list was randomly assigned to the operandum with the VI. A reinforcer consisted of the delivery of a point on the screen equivalent to 0.7 cents of a Mexican peso (0.034 US dollars at the time of the experiment). Each time a reinforcer was delivered, the computer program selected a new interval without replacement from the list and was assigned to the operandum that delivered the reinforcer. Having different concurrent VI–EXT schedules programmed for each of the components in combination with the rules guaranteed a marked difference in the programmed rate of reinforcement associated with following each of the rules. On the other hand, rule-incompatible behavior was put on extinction in both components, so that this behavior could not be a confounding factor later in the choice test.
During each of the components, a 3 s changeover delay (COD) was in effect. This contingency was added to discourage rapid alternation between the alternatives during a component. The COD consisted of the removal of the operanda from the screen each time a participant switched between alternatives, so no responses could be emitted during this 3 s period. While the operanda was removed from the screen, a 9 x 11.5 cm rectangle appeared with the text “Wait.” The rectangle was displayed for 3 s after which the response alternatives reappeared. The selection of the first response during component onset was recorded so that the contingency could be activated with the first response to the other alternative. Each time a COD occurred, the first response to the switched alternative was reinforced while a response to the pre-COD alternative produced another COD.
Instructions (described in more detail later) consisted of two rules that directed participants to always respond to the VI alternative according to the different discriminative stimuli (Table 1). Given the different programmed reinforcer rates associated with each VI schedule operating for each of the components, responding in accordance with the rules produced a globally rich and a globally lean component, hereafter referred to as the Rich and Lean components. This arrangement had the following advantages: First, it presented a clearly discriminable context (red or blue circle) that precisely signaled which of the two rules had to be followed while manipulating the reinforcer rate associated with following each of the rules. Second, the difference in the rates of reinforcement associated with following each of the rules was pronounced (six to one programed reinforcers per minute, on average), increasing the probability of contingency discrimination. Third, following the rule in the Lean component sometimes resulted in no reinforcement when an interval sampled from the list of possible intervals (M = 60 s) was greater than the duration of the component (60 s). This effectively turned the actual program into a concurrent EXT–EXT schedule. This schedule was programmed for a component randomly in six of the 18 components of the training phase. The non-reinforced components were used as additional tests to see if rule-consistent behavior was observed, even when it was not reinforced.
To advance to the next phase, 95% or more of participants’ responses in the last six observation periods had to allocate to the instructed alternative in both components. If both criteria were not met by a participant, then their data were excluded from the study, since component discrimination in accordance with the rules was a fundamental prerequisite for the next phase. No data were excluded, since all participants met the criterion.
Rule-test PhaseThis phase tested if participants could recall the rules provided at the beginning of the task before the last phase started. In this phase, participants were presented with four incomplete sentences that described the instructional content stated by the rules. Participants had to complete the four sentences without any errors by writing the word that correctly completed each sentence in accordance with the rules. If participants failed, then rule compliance during the first phase was questioned, indicating that no further testing could be conducted.
There were two types of sentences. The first sentence group was called “color sentences.” An example of a sentence of this group was, “When the circle is _ [text input box]_ , the [left/right] treasure chest must be pressed.” Participants had to write in the text input box the color of the circle according to the content of the sentence. The second sentence group was called “side sentences.” When a sentence of this group appeared, participants had to write in the text input box the side of the alternative according to the content of the sentence. The structure of this type of sentence was, “When the circle is red/blue, the _ [text input box] treasure chest must be pressed.” The two sides and the two colors were tested. The correct answer depended on the specific rules each participant was given (Table 1).
To check if their answer was correct, participants had to validate their answer by writing their answers inside the input box and then clicking on a button at the bottom of the screen labeled “validate.” The following text appeared at the top of all sentences, “Always answer using lowercase letters and omit any spaces between letters.” This was programmed to prevent participants from making any errors owing to the use of spaces or uppercase letters, since exact responses with lowercase letters were required. Once participants validated their answers, feedback in the form of a window showing the legend “Correct” or “Incorrect” was provided. Additionally, each time the “validate” button was clicked and feedback was provided, the original response to that sentence was recorded and could not be changed. After that, the next sentence appeared, so if participants provided an incorrect or inaccurate response (spaces or uppercase letters), then it counted as an error.
The four sentences were presented in random order to participants to avoid any bias toward one of the rules. The order was decided at the phase onset by the program. The presentation of the four sentences was considered a cycle. Participants had to complete all four sentences correctly within the first cycle (100% of correct responses) to advance to the last experimental phase. If they failed, the experiment ended, and their data were excluded. All participants completed this test successfully within their first cycle without any errors. As a result, no participants were excluded from the experiment at the end of this phase.
Choice-test phaseThe last phase was termed the choice-test phase and was the central part of the experiment. It was designed to test the relative effects of the two incompatible rules by inducing choice. In this phase, a four-component multiple schedule was in operation. In addition to presenting the Rich and Lean components, two more components were added: a component termed “Both Stimuli” (BS) and a component termed “No Stimulus” (NS). The test phase consisted of the presentation of two cycles of the four-component multiple schedule. During the BS component, the component stimulus was the same previously used circle but changed constantly from red to blue. The time interval for a color to be displayed before it changed was 400 ms. This parameter was arranged in combination with the COD as to make it impossible for participants to rapidly alternate between buttons and keep up with the change in colors. Whether the circle was red or blue at the beginning of this component was randomly determined at the component onset as well as the order of the components. In the NS condition, the circle at the center top of the screen was removed. Both the BS and NS components were 60 s and no reinforcement was programed for both alternatives (Extinction).
InstructionsGeneral instructions for all participants were as follows:
Welcome to “find the treasure.”
You are going to see two treasure chests on the screen. One on the left and one on the right. You must click on them to try to open them and get money. Each time you open a treasure chest, you will receive 0.7 cents of a peso (0.05 US dollars).
You will find a circle that flashes at the top of the screen. This circle constantly changes its color. Pay attention to the following indications:
--------------------------------------------------------------------------------------------
--------------------------------------------------------------------------------------------
Try to earn as much money as possible. Sometimes, questions will appear on the screen. Always answer using lowercase letters and omit any spaces between letters.
At the end of the experiment, the amount of money you gained will appear on the screen. If you do not have any doubts, click on the button “Continue.”
The two “indications” that appeared in the place of the dashed lines were the two performance rules that stated which button to press in the presence of a different color according to the parameter combination each participant had (see Table 1). Once instructions appeared, it was randomly decided which one of the two rules was in the first row.
Dependent Variables and Data AnalysisThe experimenter first calculated the total emitted responses to each of the alternatives during each component in Experiment 1 and 2. With the obtained response counts, preference measures were calculated in the form of response proportions to each of the alternatives. The primary dependent variable was the percentage of responses allocated to the instructed alternative within a component. In the training phase, the experimenter estimated this percentage as a function of each successive observation period. A value closer to 100% indicated preference for the instructed alternative, a percentage of 50% indicated indifference, and a percentage closer to 0% indicated preference for the uninstructed alternative. This data representation strategy provided a common quantitative scale to assess how much participants’ behavior conformed to what was stated by the rules. Additionally, mean response counts to each of the alternatives (considering the last six observation periods in accordance with our stability criterion) in each of the components were also reported.
Similar response percentages were estimated in the choice-test phase. For the Rich and Lean components, the percentage of responses allocated to the instructed and uninstructed alternatives was used. For the BS and NS components, the experimenter estimated the percentage of responses allocated to the alternative that was instructed by the rule applicable to the Rich component (Rich) and the percentage of responses to the alternative that was instructed by the rule applicable to the Lean component (Lean). Since there were only two alternatives in the task (left–right), the two rules instructed incompatible behavior when both discriminative stimuli were present. Therefore, if participants correctly recalled the two rules before the choice-test phase, this percentage was interpreted as a potential measure of the effect each rule exerted over participants’ behavior when both could be followed (BS component). For example, if the percentage of responses to the Rich alternative in the BS and NS components was higher than for the Lean alternative, then this could indicate greater control by the rule associated with the highest reinforcer rate if rule-following behavior occurred.
Given that the interest in the training and the choice-test phase was to assess the differences in response allocation between the alternatives during a component, multiple pairwise comparisons using two-tailed Fisher–Pitman exact permutation tests for related samples were conducted. This non-parametric permutation approach compares differences in means for dependent data (Hollander & Wolfe, 1999). Permutation tests build an empirical null distribution by rearranging data according to all possible permutations between the conditions (Belmonte & Yurgelun-Todd, 2001; Wilcox, 2017). This makes them useful for multiple comparisons because they do not make the common population assumptions and because potential irregularities in data are maintained when the distribution is estimated (Camargo et al., 2008; Cheverud, 2001). Each time a comparison was conducted, the experimenter reported the test statistic (T), the mean difference between the alternatives (Mdif), and the associated p value. A p value less than 0.05 indicated a systematic difference in the means the conditions compared. All data analyses were performed using R (R Core Team, 2020) and Microsoft Excel. Permutation tests were carried out using the twoSamplePermutationTestLocation function available in the EnvStats package (Millard, 2013).
ResultsFigure 2 shows the different analyses conducted for the training phase. Panels in section A show response counts for each alternative in each of the components. Each data point represents the estimated response count for each participant in each of the alternatives (instructed and uninstructed), calculated as the mean data from the last six observation periods in accordance with the stability criteria of this experiment. The bars represent the median value of all the data in each condition. Data from this phase for participant GP301 were lost owing to a programming error during the data analysis process and therefore are not shown. However, this participant met all the criteria to advance to the next phases, so her data were included in the following analyses. For all participants, at the end of the phase, all responses were always allocated to the instructed alternative regardless of the component (Rich T 363.23, Mdif 51.89, p = 0.01; Lean T 353.4, Mdif 50.48, p = 0.01). Moreover, levels of responding for the instructed alternative were about the same for most participants in the Rich (1st quartile 27.4, Mdn 35.83, 3rd quartile 71.6) and Lean (1st quartile 27.95, Mdn 37.5, 3rd quartile 54.6) alternatives at the end of the phase. The only exceptions were participants GP302 and GP402. Participant GP302 responded more to the instructed alternative during the Lean component, while GP402 responded more to the instructed alternative during the Rich component.
Fig. 2
Choice analyses for the training phase. Note. Panel A. Response counts for each alternative in each of the components. Each data point represents the estimated response count for each participant in each of the alternatives, calculated as the mean data from the last six observation periods. Bars represent the median of all the data points. IA (Instructed alternative) and UA (Uninstructed alternative). Panel B. Percentage of responses to the instructed alternative as a function of successive observation periods. The black circles with a red border indicate observation periods where following the rule was not reinforced during the Lean component. Data from participant GP301 in the training phase was lost owing to a programming error during data analysis
Panels in section B show the percentage of responses to the instructed alternative as a function of successive observation periods for each participant in the training phase. The empty circles represent preference to the instructed alternative in the Rich component and the filled circles represent preference to the instructed alternative in the Lean component. The filled circles with a gray border indicate observation periods during the Lean component when responding to the instructed alternative was not reinforced. Participants always favored the instructed alternative in both the Rich and Lean components. They also sampled the alternative under extinction, but this behavior was infrequent and was not exclusive of a component. For example, participant GP401 sampled the alternative under extinction in the Rich component, whereas participant GP102 did it in the Lean component. Participants GP201 and GP302 (in the first component) sampled the extinction alternative in both components. Most participants ceased to sample the uninstructed alternative during the last six observation periods, even when rule-following was not reinforced in the Lean component. The differences in reinforcer rate between components did not affect responding to the instructed alternative: preference for the instructed alternative was the same level for both components for most participants through the phase and for the last six observation periods (stability criteria).
All participants successfully completed the four sentences in the rule-test phase (100% of correct responses) on their first try. Therefore, all advanced to the last phase. Figure 3 shows the percentage of responses to each of the alternatives in each of the components during the choice-test phase. Given that in this phase each component was presented twice, in each component the experimenter pooled the two obtained response counts for each alternative, for each participant. Using the total counts obtained, the percentage of responses for each of the alternatives in all components was estimated. The top panels of Fig. 3 show the response percentages in the Rich and Lean components. As in the last observation periods during training, all participants allocated 100% of their responses to the instructed alternative (Rich T 800, Mdif 100, p < 0.01; Lean T 800, Mdif 100, p < 0.01).
Fig. 3
Choice analyses for the choice-test phase. Note. Percentage of responses to each alternative during each of the components of the choice-test phase. Bars represent the group median: IA (Instructed alternative), UA (Uninstructed Alternative), Rich (alternative instructed by the Rich Rule), Lean (alternative instructed by the Lean Rule)
The bottom panels of Fig. 3 show the percentage of responses to each of the alternatives in the test components. The bottom left panel shows the results for the BS component. Participants generally favored the alternative instructed by the Rich rule when both discriminative stimuli were present (T 321.54, Mdif 40.19, p = 0.03). Specifically, 6 of 8 participants allocated the majority of their responses to the alternative instructed by the Rich rule (Rich 1st quartile 66.7%, Mdn71.4%, 3rd quartile77.8%; Lean 1st quartile 22.2%, Mdn 28.6%, 3rd quartile 33.3%). The only exceptions were participants GP202 (Rich 45.5 %) and GP402 (Rich 46.2 %), who responded slightly more to the alternative instructed by the Lean rule. However, their preferences were closer to indifference.
Results in the NS component show a different picture. In this component, differences in responding between alternatives were unsystematic for individual participants (T 16.63, Mdif 2.07, p = 0.99; Rich 1st quartile 0%, Mdn 44%, 3rd quartile 70.4%; Lean 1st quartile 0%, Mdn 35.1%, 3rd quartile 71.4%). Four participants favored the alternative instructed by the Rich rule (GP101, GP102, GP302, and GP402) and three participants favored the alternative instructed by the Lean rule (GP201, GP401, and GP202). Participant GP301 was indifferent (Lean 0%, Rich 0 %).
DiscussionThe aim of this experiment was to test the competing effects of two different rules, each associated with different reinforcer rates and instructing incompatible behavior, in a choice situation. In the first phase (training), responding to the alternatives instructed by the rules was differentially reinforced. All participants immediately conformed to what was stated by each of the rules (Fig. 2 section B). Participants responded almost exclusively to the instructed alternative and this pattern of responding continued until the end of the phase. The response counts for the instructed alternatives were the same for both components, suggesting that the differential reinforcement programmed for following the two rules during this phase did not cause greater absolute responding to a particular alternative in a component. In the components where no reinforcement was provided for responding to the instructed alternative participants still responded to it. Some participants occasionally sampled the uninstructed alternative, but those episodes were brief, infrequent, and took place in both components. Given that during training (a) participants’ responding matched the content of the rules, (b) this matching was observed throughout the whole phase, (c) the responses were almost exclusive to the instructed alternative, (d) response counts in each of the components were the same, (e) and this pattern of responding was maintained even when no reinforcement was provided, the results suggest that participants’ behavior was mainly under the control of the rules (Catania et al., 1982; Hayes et al., 1989).
However, the patterns of responding instructed by the rules were reinforced during the first phase. Therefore, it is also possible that the observed differential responding may have been exclusively owing to the programmed contingencies without any influence of the rules provided. For this reason, the rule-test phase was programmed. During the rule-test phase, all participants correctly recalled both rules when requested on their first try. This result provided more evidence of the control exerted by the rules.
In the critical part of the experiment, three outcomes were observed. First, participants exclusively responded to the instructed alternative when the context clearly signaled the opportunity to follow one and only one of the two rules (Rich and Lean components), replicating the results observed during the first phase. Second, when the context indicated that both rules could be followed (BS component), 6 out of 8 participants globally preferred the alternative that was instructed by the rule with the highest reinforcer rate. Third, when the context did not specify which rule had to be followed (NS component), preference for any of the alternatives was non-systematic, between-subject variability was the highest and participants favored either of the two alternatives, suggesting stimulus control as the main determiner of participants’ preferences.
Although the present results seem to support the hypothesis outlined in this study, a critical assumption of this hypothesis is that our results are due to participants discriminating between the two programmed reinforcer rates in the components, even when (a) their responding immediately conformed to what was stated by the two rules during the training phase with no differences in responding between components, and (b) their responding was about the same for the two VI alternatives during training, even when there were differences in reinforcement rate between the components. Therefore, a critical step is to demonstrate sensitivity to reinforcement under the present procedure without providing rules. If differential responding in each of the components is not demonstrated in the absence of performance rules, then this could imply that the programmed contingencies were, in fact, not discriminable, putting at odds the role of reinforcer rate in the experimental results. On the other hand, observing the development of orderly changes in the behavior of individual participants as a function of the programmed contingencies will support the role of rate of reinforcement as the main controlling variable, even when rules are involved. Additionally, qualitative differences in participants’ responding between experiments should be observed, since in the absence of rules, behavior should adapt more slowly to the programmed contingencies. Importantly, the results in the choice-test phase should be similar to the ones obtained in Experiment 1 since our underlying assumption is that the variable controlling behavior in choice situations, both when behavior is rule-governed or contingency shaped, is rate of reinforcement. Therefore, the aim of Experiment 2 was to test the effects of reinforcer rate under the present procedure without providing any performance rules.
留言 (0)