Human subjects
All human endplate samples and imaging data were obtained from the surgical patients, and the informed consent of the patients had been obtained in advance, which was reviewed and approved by the Ethics Committee of the First Affiliated Hospital of Soochow Unviersity.
Mice
Heterozygous Col2a1-CreER mice were crossed with Yap1flox/flox mice. The offspring were intercrossed to generate Col2a1-CreER::YAPflox/flox (conditional deletion of Yap1 in Col2a1 lineage cells, referred to as Yap1fl/fl,Col2a1 herein).
The Col2a1-CreER mouse strain needs tamoxifen injection. Briefly, as we did in our previous paper,58 mice were intraperitoneally injected with tamoxifen (T5648, Sigma-Aldrich) at a concentration of 10 mg/mL for five consecutive days.
The genotypes of the mice were determined by PCR analyses of genomic DNA, which was extracted from mouse tails with the following primers: Col2a1-CreER: forward: 5ʹ- GATCTCCGGTATTGAAACTCCAGC -3ʹ, reverse: 5ʹ- GCTAAACATGCTTCATCGTCGG-3ʹ; Ctsk-cre: forward: 5ʹ- GATCTCCGGTATTGAAACTCCAGC -3ʹ, reverse: 5ʹ- GCTAAACATGCTTCATCGTCGG -3ʹ; YAP loxP allele forward: 5ʹ- GGCACTGTCAATTAATGGGC-3ʹ, reverse: 5ʹ-AGTCTGTAACAACCAGTCAGGGA -3ʹ, WT: 5ʹ- TCCATTTGTCCTCATCTCTTACTAAC-3ʹ; TdTomato loxP allele tdt1: forward: 5ʹ-AAGGGAGCTGCAGTGGAGTA-3ʹ, tdt1: forward: 5ʹ-AAGGGAGCTGCAGTGGAGTA-3ʹ, tdt2: forward: 5ʹ-CCGAAAATCTGTGGGAAGTC-3ʹ, tdt3: forward: 5ʹ- GGCATTAAAGCAGCGTATCC-3ʹ, tdt4: forward: 5ʹ- CTGTTCCTGTACGGCATGG-3ʹ.
LSI surgery was performed using 8-week-old male mice. Briefly, in order to create lumbar instability, the spinous processes, supraspinous and interspinous ligaments of the L3-L5 were all excised.1,59 In sham operation, only L3-5 paraspinal muscles were dissected. Samples were collected eight weeks after surgery. In the drug treatment portion, Lats-IN-1 mice received daily intraperitoneal injections of 3 mg/kg.33,60 The control group used the same amount of dimethyl sulfoxide (DMSO). Samples were collected after eight consecutive weeks. The performance of the animals in this study was approved by the Ethics Committee of the First Affiliated Hospital of Soochow Unviersity.
Micro-CT
The whole lumbar spine was dissected and evaluated with micro-CT (SkyScan 1176, SkyScan, Aartselaar, Belgium) with the following settings, namely, 65 kV, 385 mA, and 0.5 mm Al filter. Three-dimensional (3D) reconstruction was performed with system software. Coronal images of the L4–L5 unit were used to perform three dimensional histomorphometric analyses of the caudal endplate. Three-dimensional structural parameters analyzed were total porosity and Tb.Sp for the endplates. Five consecutive coronal-oriented images were used for showing 3-dimensional reconstruction of the endplates.
Histomorphological and immunohistochemical analysis
The harvested specimens were fixed for 24-48 h and then decalcified for 2 weeks at room temperature. Following that, the spine was embedded in paraffin waxor optimal cutting temperature (OCT) compound (Sakura Finetek, Torrance, CA). Five-μm-thick coronal sections of the L4–L5 lumbar spine were processed for SOFG, TRAP (Sigma-Aldrich), and immunohistochemistry (IHC) staining. Ten-μm-thick coronal frozen sections were prepared for immunofluorescent staining.
The primary antibodies used for staining included Collagen II (1:200, ab34712, Abcam), Collagen X (1:200, ab260040, Abcam), YAP1 (1:200, ab205270, Abcam), CCL3 (1:400, ab179638, Abcam), Nestin (1:100, ab221660, Abcam), TNF-α (1:200, ab183218, Abcam), CD31 (1:200, ab76533, Abcam), CGRP (1:50, ab81887, Abcam), Osteocalcin (1:200, M173, TAKARA), CCL3 (10 μg/mL, AF-450-NA, R&D system). Images were obtained using a microscope (Zeiss Axiovert 200; Carl Zeiss Inc., Thornwood, NY). ImageJ (NIH) software was used for quantitative analysis. We calculated endplate scores as described previously.61,62
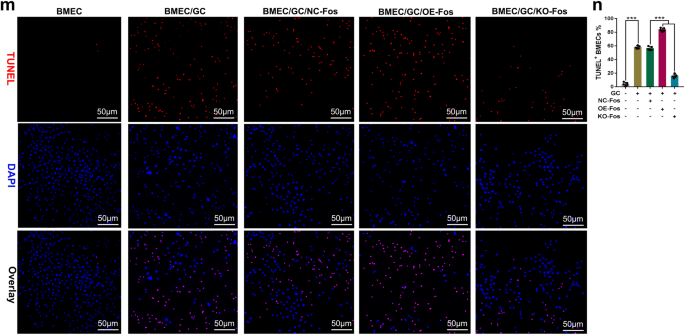
TUNEL assay
Frozen sections were stained with a One Step TUNEL Apoptosis Assay Kit (C1086, Beyotime) according to manufacturer’s protocol. The images were captured with a fluorescence microscope (Zeiss Axiovert 200).
Finite element analysis
Lumbar finite element model (L4‑L5). In an FEM, a geometrical complex spine segment can be divided into different regions according to its anatomical structure, and then meshed with various types of elements. Each region can be assigned an appropriate material model to reflect its biomechanical characteristics. In the present study, lumbar Micro-CT scan images of a normal 8 weeks-male-C57BL6/J mouse were used. Then the solid model was constructed in HyperMesh (Altair Engineering, Inc., Troy, MI, USA) and the material properties of each part of the model were assigned according to the description in the literature.29,30,31 (Table S1). Finally, biomechanical finite element analysis of the L4‑L5 segment was carried out in ABAQUS/Standard (Dassault Systemes, Velizy ‑Villacoublay, France). The model included the vertebrae, intervertebral discs, endplates and ligaments.
Isolation of cartilage endplate chondrocytes
Primary CEPCs were isolated from the 4-6 week mouse. Specifically, CEP tissues of mouse lumbar spine were trimmed with sharp knife tips. After collecting lumbar endplate cartilage from 10 to 15 mice at a time, the cartilage was washed more than three times using sterile PBS. After 20 min of Trypsin (Gibco) digestion, the plates were again washed three times with sterile PBS, The CEP tissues were then changed to Collagenase (C6885, Sigma-Aldrich 0.2 mg/mL) solution in serum-free medium. The CEP tissue was cut as finely as possible in solution and blown every half hour during digestion. After 5–6 h, the cell suspension was resuspended by centrifugation and with F12 medium (10% FBS) in a dish culture completely, once every two days in liquid. The extracted cells were identified by immunofluorescence staining, and the results confirmed that the extracted cells expressed a large amount of Collagen II protein.
Mechanical loading
A Loaded Cell Culture System (Celload-300) was used to apply mechanical stimulation on CEPCs. CEPCs were seeded on a stretched die of polydimethylsiloxane (PDMS, Dow Corning) at an initial density of 10 000 cells/cm2 In the stretching group, CEPCs were subjected at a tensile strength of 5% or 12% at 0.5 Hz for 8 h per day for 7 consecutive days. YAP agonists Lats-IN-1 (10 μmol/L, MCE) and inhibitor Verteporfin (2 μmol/L, Sigma-Aldrich) was supplemented in culture medium during the entire course of mechanical loading.33,63,64
Immunofluorescence staining of CEPCs
Cells were fixed with 4% PFA for 20 min after mechanical treatment, followed by staining according to conventional methods. Briefly, the sections were incubated with primary antibodies to Collagen II (1:200, ab34712, Abcam), Collagen X (1:200, ab260040, Abcam), YAP1 (1:200, ab205270, Abcam), phosphor-YAP1 (1:200, ab76252, Abcam), Osteocalcin (1:200, M173, TAKARA), CCL3 (1:200, ab179638, Abcam). The images were observed and captured by a fluorescence microscope (Zeiss Axiovert 200) or confocal microscope (Zeiss LSM 780). ImageJ (NIH) software was used for quantitative analysis.
Western blot (WB)
WB analysis was conducted on the protein lysates from the mechanically and drug-treated cells. Specific antibodies were applied for incubation, and the proteins were detected by using an ECL Western Blotting Substrate Kit (ab65623, Abcam). The antibodies used for WB were Collagen II (1:1 000, AF0135, Affinity), Collagen X (1:1 000, ab182563, Abcam), Osteocalcin (1:500, sc-365797, Santa Cruz), YAP (1:1 000, 14074, Cell Signaling Technology), Phospho-YAP (1:1 000, 13008, Cell Signaling Technology), CCL3 (1:1 000, ab179638, Abcam), and GAPDH (1:5 000, ab8245, Abcam).
RT-qPCR
The total RNA was extracted from lumbar spinal endplate tissue samples using TRIzol reagent (Invitrogen). RNA was reverse transcribed into complementary DNA using the All-In-One System (Abm). RT-qPCR was performed with Supermix (Bio-Rad Laboratories) on a C1000 Thermal Cycler (Bio-Rad Laboratories). Relative expression was calculated for each gene by the 2−ΔΔCT method, with glyceraldehyde 3-phosphate dehydrogenase (GAPDH) for normalization. The primers used for RT-qPCR are listed in Table S2.
Transcriptome analysis
CEPCs treated with different CTS were analyzed. The transcriptome sequencing was conducted by OE biotech Co. Ltd. (Shanghai) Cleaning reads were obtained using Trimmomatic and mapped to reference genome using hisat2. FPKM (fragments per kilobase of exon per million reads mapped) value of each gene was calculated using cufflinks. The DEGs, GESA (Gene Set Enrichment Analysis), and KEGG (Kyoto Encyclopedia of Genes and Genomes) enrichment analysis were performed using R software. P < 0.05 and FoldChange > 2 or FoldChange < 0.5 was set as the threshold for significantly differential expression or differential enrichment.The venn and volcano plot analysis of DEGs were performed using the OE suite of online tools (https://cloud.oebiotech.cn/task/). The clustered heatmap in Fig. 7A was plotted using R package ‘pheatmap’ (ver. 1.0.12).
Osteoclast induction
Primary mouse bone marrow monocytes (BMMs) were isolated from tibia and femur of 6-week-old mice. Briefly, BMMs were cultured in a-MEM medium containing 30 ng/mL M-CSF (R&D Systems). RANKL (50 ng/mL, R&D Systems) was used to induce osteoclast differentiation. In this experiment, supernatant from mechanically treated cells was used instead of a-MEM media. In the neutralization test, goat anti-CCL3 antibody (AF-450-NA, R&D system) or goat serum (Sigma-Aldrich) diluted in saline was used at the same IgG concentration. TRAP staining (Sigma-Aldrich) was conducted according to the manufacturer’s instructions.
ELISA
The concentration of CCL3 was determined by using the Mouse MIP-1α (Macrophage Inflammatory Protein 1 Alpha) ELISA Kit (Elabscience) according to the manufacturer’s instructions.
Transwell assay
A total of 2 × 10⁴ BMMs were placed in the upper chamber of a 24-well transwell (Corning, NY). Then, CCL3 Protein (MedChemExpress) was dissolved in a-MEM media with different concentrations in the lower chamber. After 48 h, the cells were stained with 0.1% crystal violet solution (Beyotime) for observation and quantification.
Dual-luciferase assay
The amplified promoter of Yap1 was subcloned into the firefly plasmids in the pGL3BASIC luciferase vector. At last, a Dual-Luciferase Reporter Assay System (Promega) was used to evaluate luciferase activity. Each procedure of these experiments was repeated three times independently.
AAV injection
8-week-old male C57BL/6 J mice were used to perform LSI or sham surgery (8 per group). AAV5-Yap1 was purchased from Genomeditech. We fully exposed the caudal endplate of L4–L5 with a ventral approach. Then, 1 × 10⁸ AAV particles in a 10 μL volume was injected into the left part of caudal endplate of L4–L5 using borosilicate glass capillaries after drilling a hole at left part of endplate.1 Ten-μm-thick frozen sections were used, and the GFP signals were inspected under a fluorescence microscope (Zeiss Axiovert 200).
Statistical analysis
The comparisons between multiple groups were performed using multiple comparisons by one-way ANOVA. For RT-qPCR data expressed as relative fold changes, Student’s t test and one-way ANOVA with Dunnett’s test were used for pairwise comparisons and multi-group comparison, respectively. Results are represented as mean ± s.d. P values < 0.05 were considered to be significant. Equal variances were assumed. All analyses were performed with GraphPad Prism software (Version 7.0). No statistical methods were used to predetermine sample size. The experiments were not randomized and the investigators were not blinded to allocation during experiments and outcome assessments.

留言 (0)