
記住我
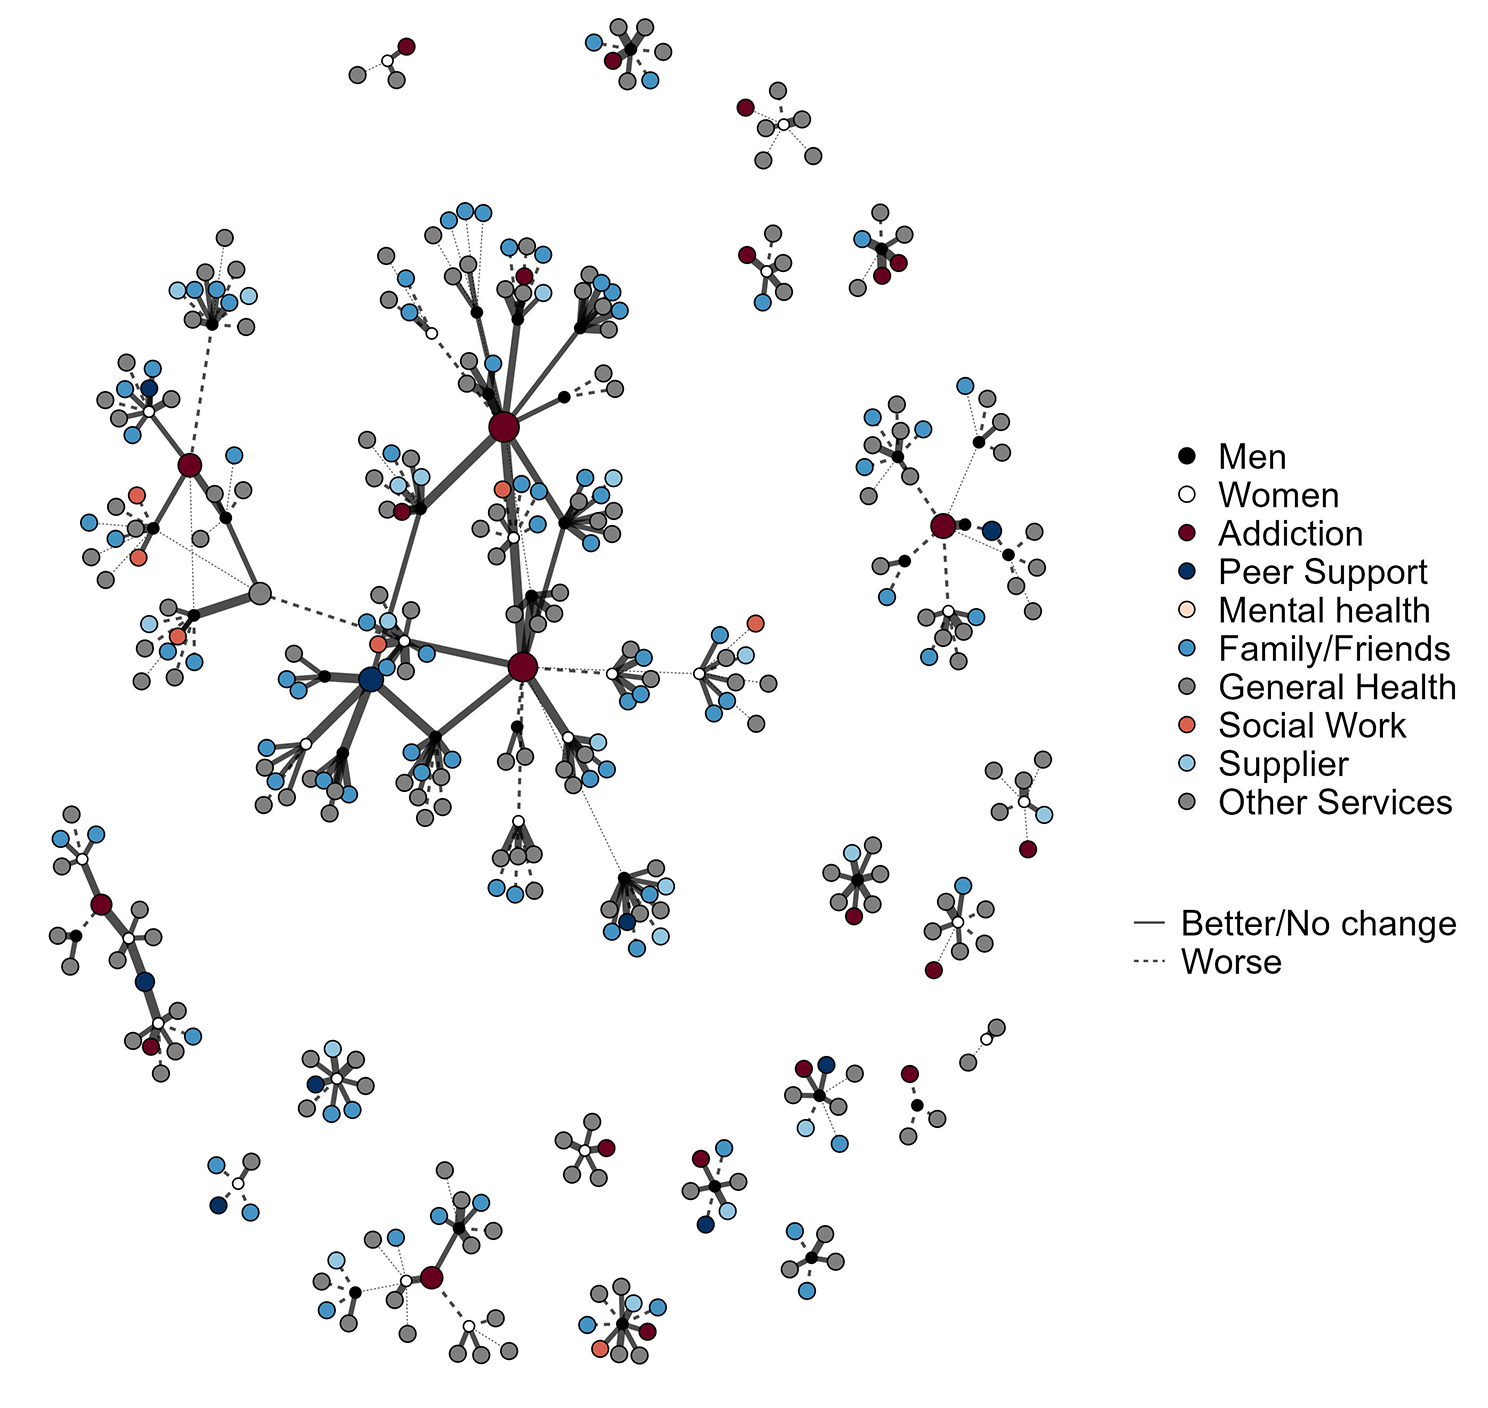
Table 1 provides a description of the participants in the study. There were 82 participants in total, we present a complete case analysis based on the 57 (72%) of participants without missing data. The interpretation of the models did not change including those with missing data, but ego level VPC was slightly higher (see appendix for details). Of the 57 participants, 24 (42%) were women, and 23 (40%) rated their health as not good or poor.
Table 1 Characteristics of the study participantsThe participants reported a total of 369 alters with whom they interacted (see Table 2). The most common alter type (22.5%) was interactions with friends and family, followed by addiction services (15.7%), food shopping or food banks (13.3%), and leisure activities (11.7%).
Table 2 Alter types, number of ratings and scores for worsening or improvement in alter interactions since COVID19 lockdownThere were also ten alters representing organisations who received ratings from more than one participant; receiving between two and 12 ratings (see Table 3). The mean ratings for alters that received more than one rating were slightly more positive (mean 3.13) than for the full alter dataset (2.93).
Table 3 Overlapping alter types, the number of unique services, ratings and average ratingsFigure 1 shows a visual representation of the dataset used for analysis as nodes (participant egos or their interaction alters) and ties (the reported rating with those alters). The black (men) and white (women) nodes represent participants, while alters are coloured according to alter type. The node size relates to the number of ratings, with the larger nodes showing the alters receiving multiple ratings, predominantly addiction services and peer support organisations. The lines show a relationship between the participants and their alters, along with positive (wider and solid lines) or negative (thinner and dashed) ratings of that relationship. The bottom right of the figure shows many disconnected egonets, representing individual participants and the number and variety of alters they reported interacting with. To the top left of the figure, there is a group of nodes from a woman reporting only three contacts who reported a negative interaction with one of the three. The centre of the figure shows a group of two addiction services and a peer support service all of which have multiple participants in common. Elsewhere in the figure there are further subcomponents showing services with multiple participants in common. Closer inspection of the figure to identify the light blue alters shows that interactions with non-prescribed substance use suppliers was common, and inspection of the dark red alters shows that almost all of the participants were currently in contact with an addiction service.
Fig. 1
Graph visualisation of participants (black and white), their formal and informal interactions (colours), and interaction rating (wider lines are more positive)
This visualisation helps to represent the complex structure of multiple service utilisation, the variety of positive and negative experiences, and how some individuals have a very limited set of formal and informal social interactions. It is worth noting that many of the disconnected components relating to individuals may not be truly disconnected from others in the dataset, there may have been common services, but we were unable to link these in the data collected. While the visualisation gives an overall impression of structure and some potential variation in positive and negative ratings, statistical models give a more useful summary of the complex patterns and variations.
Table 4 shows models of how relationship ratings varied according to fixed effect characteristics of individuals, alters and area, as well as variance partition coefficients (VPCs) describing rating variation between participants and alters. Model 1 includes a random effect for between participant variation in ratings, while model 2 allows for between-participant and between-alter variation in ratings. The VPC for Model 1 suggests that around 10% of the variation in rating relates to between participant differences. That is, some participants were consistently reporting more negative changes to due COVID than the sample average, while others gave more positive ratings. The alter VPC estimate for Model 2 suggests there was around 1% between-alter variation in ratings, meaning that – for the 10 services receiving multiple ratings - there were no services that were consistently receiving better or worse ratings than average. The negligible variation was confirmed by comparing the model fit statistics, which showed no improvement comparing Model 1 (ego variation only) and 2 (ego and alter variation). The conceptual implication is that the system structure is optimally described when accounting for individual differences among those interacting with services, but organisational variation was less variable at the level of individual organisations. Variation between types of organisation was explored in the subsequent models, retaining the random effect terms. Models 3 to 7 show results after the stepwise inclusion of fixed effects for area, ego and alter characteristics. The coefficients for area differences in rating changed markedly after the inclusion of the terms for the type of alters, while there was less change in the association between alter type and rating after the inclusion of ego level characteristics.
Table 4 Ordinal logistic multilevel models odds ratio for more positive interaction rating, with participant and overlapping alters cross classified at level twoFigure 2 gives a visual representation of the between participant, and between alter variation in ratings. Each vertical line represents one participant, with the position of the dot showing that individual’s average rating and the line showing the variation in ratings. Model 7 found around 7% of the rating variation could be explained as between participant ratings. This can be seen visually in the left panel, with some individuals having ratings higher or lower than the sample average. Looking at the right hand panel, there was virtually no between alter variation with no single service having a much higher or lower than average rating. This was also reflected in the VPC of 1%.
Fig. 2
Random effects plots show the distribution of rating scores per ego (participant) and per alter (treatment services receiving multiple ratings). Note: Left panel shows the ego-level variance partition coefficient of 0.07. Right panel shows the alter-level VPC of 0.01
In terms of participant characteristics, there was no evidence that women reported more or less positively than men, but those who reported better general health tended to provide more positive ratings than those in poorer health (1.52, 95% CI 1.22, 1.93). There were more substantial variations according to alter type. Model 4 shows that the ratings of COVID-related change for pharmacies were most positive, and the 95% confidence intervals suggest that the ratings hadwere consistently more positive than the average rating among the samplehigher odds ratio (Ordinal logistic log odds odds ratio 3.63, 95% CI 1.82, 6.55, ). At the other end of the scale, mental health services were rated more negatively since COVID than average (models 5 to 7, odds ratio in model 5: 0.44 95% CI 0.21, 0.93, ), along with interactions not related to treatment such as family (model 4: 0.52, 95% CI 0.29, 0.87, ), and leisure activities (0.54, 95% CI 0.29, 0.99, ). Pharmacies had more than three times (3.03 95% CI 1.36, 5.93) the odds of getting a 1-point better rating than Addiction services, while there was a lower odds of a more positive rating than an Addiction service for Mental health ( OR 0.39 95% CI 0.17, 0.90), and family/friends ( OR 0.43 95% CI 0.23, 0.90) Fig. 3 gives a visual depiction of the variation in ratings by alter type. Note that the visual is based on a linear unadjusted model rather than the main analytical model in Table 4.
Fig. 3
Estimates from an unadjusted linear cross classified multilevel model showing mean (95% Confidence Intervals) for five point rating by alter type. Higher = more positive change in interaction since COVID19.
There were notable differences between the areas surveyed, with area 3 being three times as likely to receive a 1-point better rating than Area 1 (OR 3.00 95% CI 1.48, 5.70) after accounting for differences by participant and alter characteristics.
Qualitative findingsAll participants reported that services had changed during COVID19 and in line with restrictions. This meant most support happened over the phone or online and there were mixed views and experiences across all five areas. Some participants said they were talking to workers more often than before COVID19 and found it easy to maintain this. However, many participants reported less contact.
“Since March 2020, I have had one appointment with a worker at the service. Apart from this there has been no support and very little communication. My script is dropped off at the pharmacy and that’s it. There’s no drug testing and only phone appointments available. I prefer face-to-face contact and struggling with lack of this support.” (Area 3).
“I am meant to still speak to them once a month, but it’s been very hard to get in touch with them since Covid. I have struggled to get through.” (Area 2).
Many participants reported not hearing back from workers when they had tried to reach out for help. There were concerns about missing phone calls from workers, and the impact of this on their ongoing care. Others reported not being able to afford phone credit to initiate contact with services and having to wait a call. Overall, the lack of contact and change in delivery had a negative impact on many of the participants:
“I’ve not seen my worker during this. It’s terrible as I can’t just go down to the service to see them if needed. My worker is also my trauma counsellor, and we are close. It’s had a bad effect on me.” (Area 4).
Participants in all areas commented that OST reduction plans had been interrupted or halted, which was often frustrating. There was a general feeling that reasoning and implementation of this were not communicated well:
“I don’t have a phone at the moment, and I’ve not seen my drug worker in a while. I want to get put down on my script but don’t know how to get in touch with them and I’ve heard no one is getting cut down at the moment.” (Area 4).
Further demonstrating the varied experiences, some participants felt positively about the remote support offered, with individuals describing how it had increased their ability to engage with support:
“I’ve enjoyed lockdown and my mental health and emotional health has improved. Normally I’m in the house for long periods of time due to my physical disability and am happy that services are now turning to online platforms. I can access them more and get more support when needed. I hope that things do not go back to face-to-face meetings as I would miss the daily interactions with people. I feel I’m seeing more people now and this is improving my mood.” (Area 3).
A few participants mentioned they felt it was easier to be dishonest with workers about how they were feeling when support was remote:
“I think it is easier to lie over the phone and you are less likely to be honest if you aren’t doing okay. You can just say you’re fine even if you’re not. The service was quick to adapt, though, and I have a good worker who links me in with other services.” (Area 4).
As highlighted here, some participants in each area acknowledged that they felt services had done well to adapt, especially peer support and voluntary services.
Substance useQualitative reports about changes in substance use, quality, availability, and prices varied across the five areas (see Table 5).
Table 5 Summary of thematic findings around changes in substance quality and availability after lockdownRelapse or increased use due to impacts of COVID19 was more common in participants overall than a decrease in use:
“I’ve found the uncertainty of Covid and lockdown hard. This has really affected me mentally and at the start of April I felt extremely low and drank heavily for a week before stopping. I had not drunk alcohol in two years before this.” (Area 3).
“I’ve been in oblivion since Covid. I was moved to a hostel which badly affected my social anxiety and there were drugs everywhere. I isolated myself throughout and only went out to the chemist. My drug use increased with heroin and Valium and now I’m in the Crisis Centre. I’m really glad to be here.” (Area 4).
Themes for negatively rated alter type: family and friendsParticipants in all areas mentioned missing seeing their friends and families due to restrictions limiting contact. Some had not been able to see their children if they did not live with them full time and were finding it difficult to find things to do with them when they did see them.
Some participants described that having children and/or pets helped to motivate them to go outside for walks which could help their well-being:
“I try to go out for 30 minutes each day, either to a shop or if it is too busy, I just walk around near my house. My daughter has a small dog which I have been walking with a few days a week since the schools went back, which is enjoyable.” (Area 2).
However, most participants were finding it difficult to pass the time and were overall less active, with impacts on physical health, such as weight gain, described. People mentioned various ways they tried to spend time but, largely, there was a feeling that this was difficult and boredom common:
“It’s been too cold for walks and the government are telling us to stay at home. I feel numb, every day is the same but I know everyone is going through it. I don’t have internet as couldn’t afford it when I was using it. I mostly just watch telly and am alone with my thoughts so often have flashbacks.” (Area 4).
Themes for negatively rated alter type: mental health servicesThere were inconsistent reports of level of support received from mental health services. Some participants had started engaging successfully with mental health services and there were reports of high levels of daily or frequent support offered to some of those in crisis:
“Before Covid I was going to counselling once a week. This has been upped by the service to three times a week as I felt like I needed extra support. I am extremely happy with the service and feel extremely supported by them.” (Area 3).
However, there was more evidence of people struggling to get in touch with mental health services for support, with some feeling they were being passed around and not able to access help they needed:
“I now have to get a phone appointment and can’t go in to see them face-to-face. I feel they don’t really want to see me to discuss things and just keep giving me more pills” (Area 2).
“I’ve had no contact with mental health services since March 2020. I received a letter from the mental health team stating that someone would be in touch. However, I have not heard anything to date. I’m aware that other people I know are getting phone consultations from the same team, but this has not been offered and I’ve found it extremely upsetting. It’s affected my mental health and increased my anxiety.” (Area 3).
Themes for positively rated alter type: pharmaciesAlmost all of the participants in each area who received Opiate Substitution Therapy (OST) stated that their dispensing arrangements had changed due to COVID-19. For the majority, this meant they were attending the pharmacy to collect their prescription less frequently than before and were able to take it at home between these days. Most participants preferred this new dispensing arrangement:
“A positive note of the prescribing change was changing from daily dispensing to once per week. I prefer this from having to attend daily and hope this will continue after lockdown.” (Area 3).
“I prefer only going once a week. Workers should trust some people more than they do. It’s good for me only going once a week but it won’t be for everyone. It does mean I don’t see people every morning for a chat, though.” (Area 4).
A few participants did say they prefer going more frequently to the pharmacy and there were mentions of individuals being changed back to going daily/more often. This was for reasons such as relapsing and being pressurised to sell or give their take-home prescription to others. Though in one case, a participant had been returned to frequent pick-ups without any clear communication of why this was happening:
“I was still on weekly at the start but changed to Monday to Friday pick up again. I think this is because people were selling methadone. I don’t like it like this and don’t know for sure why I’ve been changed from weekly.” (Area 4).
Participants discussed other new rules that had been adopted by pharmacies due to COVID19, with long queues outside mentioned in all areas. A few individuals did not mind this as felt everyone was being made to queue the same way regardless of what they were there for and thought it showed the pharmacist was sticking to social distancing guidelines. However, for most participants, the queuing outside was negative as they felt more stigmatised while waiting:
“I was feeling awkward standing in the queue outside and have experienced people shouting abuse at me while waiting. I feel that this happened because people thought I was there to pick up methadone, when in fact I had been waiting to collect my mental health medication.” (Area 3).
There were also examples of individuals being given or even made to consume their OST whilst still in the queue, as explained here by someone who had other issues with the pharmacy as well:
“I had to self-isolate two months ago for two weeks due to possibly having Covid. I don’t have any friends or family who could go to the pharmacy to pick up my methadone prescription and because of this I was struck off. I understand that this is because of [service name] but I feel that the pharmacy could have offered to bring my prescription to me. There has been no support from the pharmacy if you are unable to collect your prescription in person. The pharmacy is also making people take their methadone outside on the street. They are asking people to drink it in front of the pharmacy staff. I’m extremely embarrassed by this and would like the respect and privacy that other members of the public have.” (Area 3).
Overlap between quantitative and qualitative dataOverall, there was a high degree of overlap between the findings of the thematic analysis and the multilevel modelling. The structure of the interview asked participants to first provide a quantitative rating, and then to provide an explanation and a context for the quantitative rating. The qualitative data provided key insights into the mechanisms underpinning the positive and negative ratings, while the statistical analysis provided greater certainty around the overall trends in ratings. For example, there were frequent thematic pros and cons given in relation to change in pharmacy procedures during COVID by each participant, but the MLM suggests that changes were received positively overall, and the mechanisms through which the positive changes took place.
Reflection on the project frameworkThe ICAROS project was initially designed to align with the principles of a Transdisciplinary Complex Adaptive System (T-CAS) approach to health improvement [9]. In practice, it was not possible to achieve this fully. Without large scale funding, it wasn’t possible to capture data at multiple time points in each area, so we provided a single round of feedback to each area rather than initiating learning cycles. At the strategic level, engagement with the findings from the rapid reports varied, with ongoing engagement in some areas, and the report being noted for information in others. In a time and resource-constrained environment, the capacity to develop new networks to support a T-CAS learning cycle was limited. At the community level, the lived experience and academic co-production activity around designing the study provided an effective toolkit for both data collection and practical assessment. For example, data collection identified an individual with a very negative rating for injecting equipment provision, which was explained by the lockdown removing the individual’s peer supply of IEP. The peer team were able to signpost the participant to nearby services at the end of the interview. T-CAS provided a useful guiding framework for considering action and information sharing at multiple levels of the system, and while the project did not initiate positive system disruption and sustained learning cycles, it did provide positive mitigating actions against the wider disruption introduced by the pandemic and lockdown.
留言 (0)