Subject
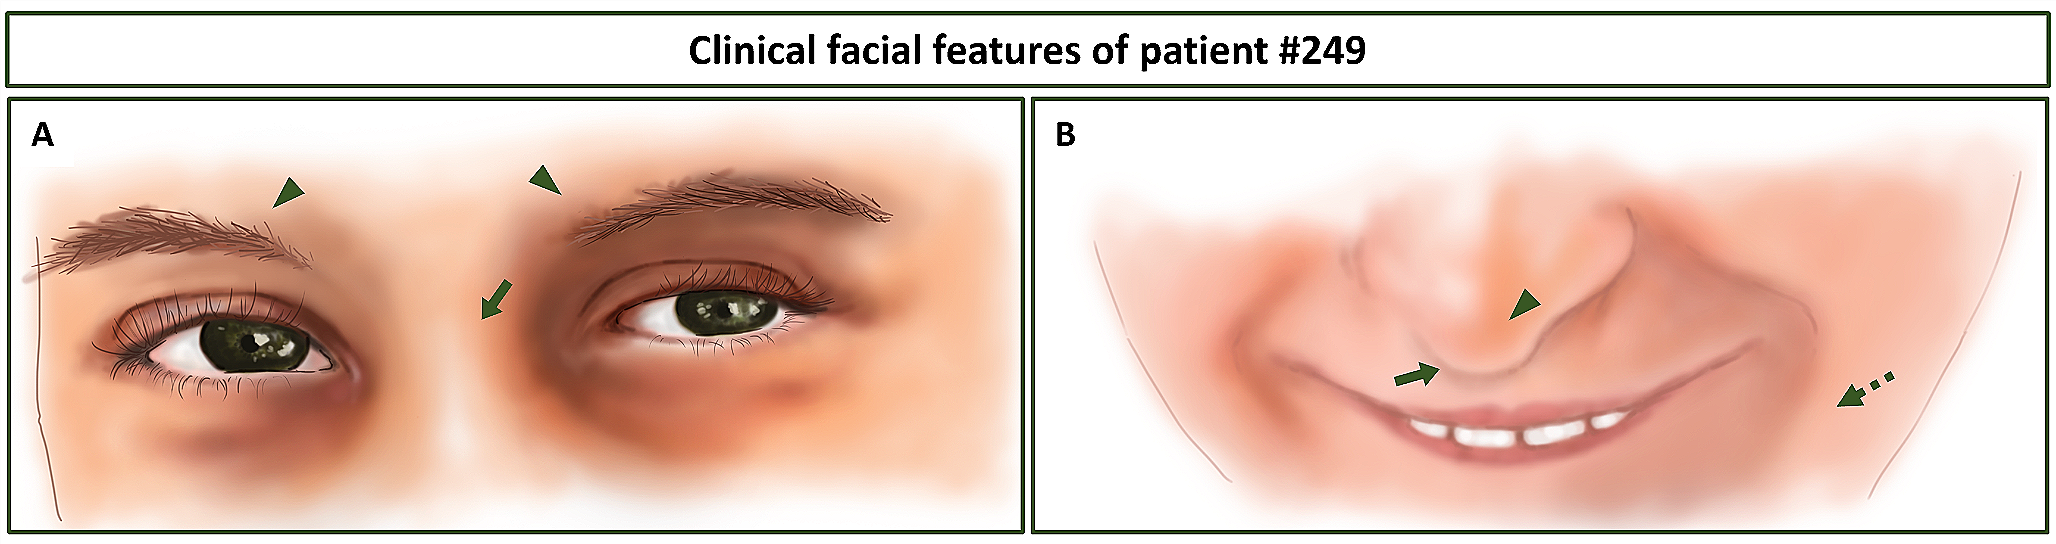
Patient #249 was clinically and phenotypically evaluated by an expert clinical geneticist (DM) who proposed a clinical diagnosis of RSTS. The subject and its family gave informed consent.
Exome sequencing and variant validation
Genomic DNA of patient (#249) and its parents was extracted from blood and saliva samples by Wizard Genomic DNA Purification Kit (A1120, Promega) and Quick-DNA Miniprep Plus Kit (D4068, Zymo Research) respectively. DNA obtained from whole blood was used for library preparation and exome enrichment with Agilent SureSelect V7 kit according to manufacturer protocol and an indexed 150 bp paired-end sequencing was carried out on Illumina HiSeq3000 instrument at CRS4 NGS facility. Data were analyzed exploiting an analysis pipeline based on public tools and reported in Di Fede et al. 2020 (Di Fede et al. 2020).
Extracted blood and saliva DNA of the family trio was used for PCR reactions according to the protocol of GoTaq Flexi DNA Polymerase (M8296, Promega). After PCR amplification, Sanger sequencing was performed with the same pair of primers to confirm the variant of interest identified through exome sequencing, using ENST00000519065.6 (NM_001527.4) as reference for HDAC2. In addition, RNA of patient was extracted isolating PBMC from whole blood by Ficoll-Paque™ PLUS (#11,768,538, Cytiva-Danaher Corporation) and performing the RNA extraction according to TRI Reagent® protocol (#93,289, Merck KGaA). RNA was retrotranscribed using SensiFAST™ cDNA Synthesis Kit (BIO-65,054, Meridian Bioscience) according to manufacturer’s protocol and analysis of the transcript was carried out by RT-PCR followed by Sanger sequencing. HGVS nomenclature guidelines were observed for sequence variant which was reported as individual ID #00442016 in the LOVD website (https://databases.lovd.nl/shared/individuals/00442016).
Cell culture
Patient #249, three RSTS patients with CREBBP mutations (CREBBPmut) and six healthy donors (HD) lymphoblastoid cell lines (LCLs) were obtained in synergy with Telethon Network of Genetic Biobanks (Gaslini Genetic Bank, Genova, IT) (Table 1) (Lopez-Atalaya et al. 2012; Spena et al. 2015; Baldo et al. 2016). Ethics Committee of Università degli Studi di Milano approved the use of these cell lines (Comitato Etico number 99/20, 17 November 2020). Cells were cultured in RPMI 1640 medium supplemented with L-glutamine (L0498-500, Aurogene s.r.l), 20% fetal bovine serum (ECS0180L, Euroclone), and penicillin/streptomycin (ECB3001, Euroclone), with 5% CO2 and at 37 °C.
Table 1 Patients-derived LCLs used in the present workImmunocytochemistry
At least 1.5 × 10⁴ cultured LCLs were seeded in duplicate on SuperFrost Plus slides (#10,149,870, Thermofisher Scientific) through cytospin for 5 min at 500 rpm. Slides were incubated with PFA 4% for 10 min and washed three times with PBS (Phosphate-Buffered Saline). In a wet chamber cells fixed on slides were firstly permeabilized with PBT (PBS with 0,2% Triton) for 10 min at RT and then incubated with a blocking solution (PBT supplemented with 10% FBS) for 30 min at RT. Incubation with anti-HDAC2 antibody (1:500, ab137364 Abcam) was performed overnight at 4°C. Slides were washed with PBT, incubated for 1 h and 30 min with Alexa-488 anti-Rabbit secondary antibody (1:250, #6441-30 SouthernBiotech), washed again in PBT and mounted with Everbrite Mounting Medium with DAPI (#23,002, Biotium). For each sample, about ten images of randomly selected fields were acquired by confocal microscopy A1/A1R (Nikon Corporation) at 60x magnification and an average number of 102 cells was counted for each cell line. Images were blinded-counted and analyzed with ImageJ software (National Institute of Health) by three different operators. Five degrees of HDAC2 localization were set (from 0 to 4, where 0 means HDAC2 signal is absent while 4 is strongly present in the nucleus) and number of cells assigned to each degree (HDAC2 + cells) was normalized on the total cell number per image acquired.
Protein extraction and fractionation
Cellular pellets were washed two times in PBS and centrifuged 5 min 2,500-3,000 rpm at 4 °C, resuspended in cold S300 buffer (50 mM HEPES pH 7.6, 300 mM NaCl, 0.1% NP40, 2 mM MgCl2, 10% glycerol) supplemented with protease inhibitors cocktail (P8340, Sigma-Aldrich) and nuclease (SC-202,391, Santa-Cruz Biotechnology) and left on ice for 1 h. Samples were centrifuged at maximum speed (13,000 rpm) for 10 min at 4 °C and the supernatant was quantified with Bradford assay (Bio-Rad) following the manufacturer’s instructions. Protein samples were finally denatured in Laemmli sample buffer 4x (LSB, #1,610,747, Bio-Rad) supplemented with β-mercaptoethanol and boiled for 10 min at 100 °C before they could be loaded on gel.
For fractionation LCLs cellular pellets were split equally in two recipients: for total lysate (Total) and cytoplasm/nuclei fraction. Pellet for total lysate was resuspended in S300 buffer for protein extraction for 30 min on ice. Pellet for cytoplasm/nuclei fraction was washed in cold hypotonic buffer (10 mM Tris HCl pH 7.6, 1.5 mM MgCl2, 10 mM KCl, 340 mM sucrose), centrifuged 5 min at 2,500 rpm at 4 °C, resuspended in hypotonic buffer (1:5) and put on ice for 10–15 min. Then 1/30 of Triton X100 10% was rapidly added to the solution which was left on ice for 5 min and centrifuged at maximum speed for one minute at 4 °C. At this point supernatant was collected for cytoplasmic fraction (Citosol), while cellular pellet corresponding to nuclei fraction was washed again in hypotonic buffer, lysed in S300 buffer added with protease inhibitors cocktail and nuclease, and left resting on ice for 30 min. Nuclei and total lysate were extracted as reported below and centrifuged at maximum speed for 10 min at 4 °C for removing debris. After quantification LSB with β-mercaptoethanol (#1610710 Bio-Rad) was added to fractions. Fractionation experiments were performed in triplicates with three different pairs (#249 and HD) of LCLs samples.
Western blot
Denatured protein samples were separated by SDS-PAGE (Running buffer 1x diluted from 10x made of 3% Tris HCl, 14,4% Glycine and 1% SDS), transferred to nitrocellulose membranes in Transfer buffer 1 × (20% methanol and 10% Transfer buffer 10x, composed of 3% Tris HCl and 14,4% Glycine). Membranes were washed with TBS (TBS 1x diluted from 10x made of 3% Tris HCl, 8,7% NaCl and 0,2% KCl) supplemented with 0.1% Tween (TBS-T), blocked for 1 h at RT with 5% milk in TBS-T and then with primary antibody diluted in blocking solution for 1 h at RT (rabbit anti-H3, 1:10000, ab1791 Abcam, RRID: AB_302613; rabbit anti-GAPDH, 1:2000, #5174 Cell Signaling Technology, RRID: AB_10622025) or overnight at 4 °C (rabbit anti-HDAC2, 1:1000, ab137364 Abcam, RRID: AB_3073990; rabbit anti-HSP90, 1:1000, #4874 Cell Signaling Technology, RRID: AB_2121214; mouse anti-p53, 1:500, #MA5-12557 Thermo Fisher Scientific, RRID: AB_10989883). After washing, membranes were incubated with goat anti-rabbit or anti-mouse IgG horseradish peroxidase (HRP)-conjugated antibody (#1706515 or 1706516, Bio-Rad, RRID: AB_11125142 or RRID: AB_2921252) diluted in 5% milk in TBS-T for 1 h at RT, they were washed again and chemiluminescence signals were detected through ECL (#1705061 Bio-Rad) incubation and captured by Chemidoc Imaging System. Data obtained from western blot, performed in seven biological and a minimum of two technical replicates, were analyzed by Image Lab Software (Bio-Rad) and expressed as ratio between values from protein of interest (HDAC2, H3ac or p53) and reference protein (GAPDH or H3). Fractionation ratios were calculated comparing nuclear or cytoplasmatic fraction to total lysates.
RNA extraction and gene expression analysis
RNA extraction from #249 and five HD LCLs pellets was obtained following TRIzol reagent protocol (#15596026 Invitrogen). Briefly, 1mL of TRIzol was added to each pellet for nucleoprotein complexes dissociation. Total RNA was purified and precipitated with chloroform and isopropanol respectively, and RNA pellets were washed two times with 75% ethanol. Once dried, pellets were resuspended in nuclease free water and RNA quantified by Nanodrop. Reverse transcription (RT) was performed using All-In-One 5X RT MasterMix (G592 Applied Biological Materials Inc., abm) according to manufacturer’s protocol, in order to retrotranscribe 1µg of RNA per sample into cDNA. RT reactions were diluted with H2O and quantitative real time PCR (RT-qPCR) was carried out using TB Green Premix Ex Taq (Tli RNase H Plus) (#RR420A, Takara Bio Inc.) and the CFX Opus 96 Real-Time PCR System (Bio-Rad). Experiments were assayed in biological and technical triplicates and HDAC2 or TP53 levels were quantified relatively to the expression of three housekeeping genes (GAPDH, RPLP0, RPL13A) using a comparative Ct quantification method. The following primers were used for RT-qPCR: HDAC2 5’-AGGCAAATACTATGCTGTC-3’ and 5’-TGAAACAACCCAGTCTATC-3’; TP53 5’-CTATGAGCCGAGGTTG-3’ and 5’-AGAGGAGCTGTGTTGG-3’; GAPDH 5’-AGCCACATCGCTCAGACAC-3’ and 5’-GCCCAATACGACCAAATCC-3’; RPLP0 5’-TCTACAACCCTGAAGTGCTTGAT-3’ and 5’-CAATCTGCAGACAGACACTGG-3’; RPL13A 5’-CCTGGAGGAGAAGAGGAAAGAGA-3’ and 5’-TTGAGGACCTCTGTGTATTTGTCAA-3’.
AlphaLISA® assay
An amount of 1 × 10⁴ cells/well from #249, three CREBBPmut, and five HD LCLs was resuspended in 60 µl of RPMI for AlphaLISA assay (PerkinElmer) (Di Fede et al. 2021). Acetylation assessment was carried out according to AlphaLISA Cellular Detection Kit protocols for Acetylated-Histone H3 Lysine 27 (H3K27ac) (AL720, PerkinElmer) and unmodified Histone H3 Lysine 4 (H3K4) (AL719, PerkinElmer), used for normalization. Briefly, after incubation of biological triplicates with Cell-Histone Lysis buffer and Cell-Histone Extraction buffer for 15 and 10 min respectively, technical triplicates were incubated with Acceptor mix for 1 h at room temperature (RT), followed by addition of Donor mix and incubation overnight at RT. Signal was detected at PerkinElmer Ensight™ plate reader.
RNA-sequencing
RNA previously extracted from #249, one RSTS and two HD LCLs were used for whole-transcriptome RNA-sequencing (RNA-Seq) analysis performed by next-generation sequencing, using the Universal RNA-Seq kit (Tecan) with targeted transcript depletion with AnyDeplete (Tecan) for ribosomal and globin genes. The yields of final libraries were assessed by Qubit 4.0 fluorimeter, and their sizes were measured by Agilent Bioanalyzer. The libraries were analyzed by paired-end sequencing on NextSeq2000 Illumina platform, 2 × 50. FASTQ files are available in the BioStudies-ArrayExpress database (https://www.ebi.ac.uk/biostudies/ArrayExpress/studies) under accession number E-MTAB-14,042. Raw FASTQ sequences were quality-tested with FastQC (https://www.bioinformatics.babraham.ac.uk/projects/fastqc/) and aligned against the GRCh38/hg38 reference human genome with the splice-aware aligner STAR v2.7.10b (Dobin et al. 2013). Sorted, indexed BAM alignment files were used for quantification with featureCounts (v2.0.0) (Liao et al. 2014) considering only uniquely mapped reads. GRCh38 Ensembl Release 108 annotation was used as reference. The Bioconductor package DESeq2 v1.30 (Love et al. 2014) was used to perform differential gene expression analysis in addition to custom shell and R scripts. Significant gene sets were selected based on nominal p value less than 0.05 and absolute log2(0.58) which translates to an actual foldchange higher than 1.5 or lower than 0.67.
Statistical analysis
Data were analyzed using Prism software (GraphPad Software) and expressed as mean ± Standard Error of the Mean (SEM) or ± Standard Deviation (SD). Statistical test used for comparing means of cells counts (HDAC2 + cells) for five degrees of nuclear localization was multiple t-tests, with significant p value determined through Holm-Sidak method as post-hoc test (α = 0.05) (* p < 0.05; ** p < 0.01; *** p < 0.001). Statistical analysis on both western blot and RT-qPCR data was performed using Student t-test, considering significance for p value < 0.05. Variance of means of three groups in AlphaLISA assay was compared using one-way ANOVA, with p < 0.05 considered significant (* p < 0.05; ** p < 0.01; *** p < 0.001).

留言 (0)