
記住我


Coronary artery bypass grafting (CABG) is one of the most effective treatments for coronary artery disease (CAD) patients.[1–5] CABG patients remain at a high risk for experiencing long-term events, with reported 10-year rates for major cardiovascular events ranging from 26.1% to 47.6%.[6–11] While several preoperative cross-sectional variables have been identified as being associated with long-term prognosis in CAD patients, few tools are available that help physicians to evaluate surgical efficacy and tailor treatment over time.[12–18] This information is particularly crucial for CABG patients, as significant changes occur across various domains following the surgery,[19–22] which should be monitored by serial assessments.
An ideal serial assessment tool should meet certain criteria, such as being well-validated, interpretable, sensitive to clinical and surgical changes, and easy to implement. Health-related quality of life (HRQoL) fits these criteria and holds potential as a candidate for a serial assessment. HRQoL is defined as the perception of the discrepancy between actual and desired functional status and the overall impact of the disease on well-being.[23] It has been found to be valuable not only as an outcome measure but also as a predictor for multiple cardiovascular diseases.[12,23–26]
Studies have shown that changes in health status provide additional prognostic information beyond baseline measurements in patients with heart failure.[12] As a self-perceived indicator, HRQoL can be used to evaluate the broad impact of a disease on a patient and the effectiveness of interventions, which is closely related to therapeutics, but may not reflect in objective assessments, for example, the clinical impression of one's "wellness", physical capacity, or mental status.[26] CABG patients typically experience an improvement in HRQoL after surgery, particularly within the first 6 months, making it a sensitive indicator for serial assessment.[2,12,19–21,23] The Short-Form 36 (SF-36) is one of the most widely used and validated measurements for HRQoL and researchers had demonstrated that HRQoL measured by SF-36 is predictive of cardiovascular outcomes even after adjusting for demographic and clinical variables.[26] For CABG patients, a single preoperative SF-36 measurement could predict 6-month mortality.[26] However, it remains to be determined whether serial HRQoL assessments using SF-36 can provide additional information for long-term prognosis in CABG patients. Further research is needed to explore this potential.
To this end, our study aimed to examine the association between changes in SF-36 scores and long-term mortality and cardiovascular outcomes in a cohort of CABG patients followed for more than 6 years. Our hypothesis was that patients with poorer preoperative HRQoL and less improvement in HRQoL after undergoing CABG would have a higher risk of mortality and cardiovascular events.
Methods Study designThe study had been approved by the Ethics Committee of Fuwai Hospital (No. 2019-1140) and adheres to the Declaration of Helsinki. Written informed consent was obtained from all participants. The current study derived from a perspective study aiming to provide evidence regarding the effects of statin therapy on perioperative depression in CABG patients (registered at clinicaltrials.gov, No. NCT01624857). Briefly, consecutive patients admitted for their first CABG at Fuwai Hospital between July 2012 and November 2013 were screened and 433 were included. Patients <18 years of age, undergoing emergency or urgent surgery, with concomitant operations other than CABG were excluded.
Health status measurementsAfter enrollment, patients were interviewed for demographic information and medical history. Routine preoperative examinations were performed to obtain baseline clinical variables. HRQoL was measured with Mandarin version SF-36.[27] The SF-36 measured physical and mental health status using 8 multi-item scales (36 items in total), which includes Physical Functioning (PF, 10 items), Role-Physical (RP, 4 items), Bodily Pain (BP, 2 items), General Health (GH, 5 items), Vitality (VT, 4 items), Social Functioning (SF, 2 items), Role-Emotional (RE, 3 items), and Mental Health (MH, 5 items). The 8 scales can be aggregated into two summary scores, named Physical Component Summary (PCS, mainly composed of PF, RP, BP, and GH) score and Mental Component Summary (MCS, mainly composed of VT, SF, RE, and MH) score.[28] Calculation of PCS and MCS scores followed the methods described by Ware et al[28]. It has been reported that PCS and MCS scores had advantages over the original 8 scales.[28,29] For both PCS and MCS scores, higher values indicate better performance. The Mandarin version SF-36 was translated according to lifestyle of Chinese and has been validated in several Chinese population with good validity.[27,30–32] Assessments of patients' health status with SF-36 were performed preoperatively, 1-month, and 6-month after surgery. Six-month measurement was chosen because it was reported that HRQoL after CABG improved 3–6 months postoperatively and remained stable through 3 years.[21]
Assessments of health status changesTo calculate the change in HRQoL between the preoperative period and the 6-month postoperative follow-up, we subtracted the preoperative PCS or MCS scores from the corresponding 6-month PCS or MCS scores, respectively. Larger values of the resulting ΔPCS (change in PCS scores between the preoperative period and the 6-month postoperative follow-up) and ΔMCS (change in MCS scores between the preoperative period and the 6-month postoperative follow-up) indicated greater improvements in HRQoL. It was important to note that patients who died within 6 months after surgery were excluded from the analyses of ΔPCS and ΔMCS.
Since CABG patients were expected to experience dramatic changes both physically and mentally during the perioperative period,[19–21] we also measured PCS and MCS scores 1-month after CABG. Subsidiary analyses were conducted by subtracting 1-month PCS or MCS scores from 6-month PCS or MCS scores to obtain respective ΔPCSsubanalysis and ΔMCSsubanalysis.
Study endpointsThe primary endpoint of the current study was all-cause mortality and the secondary endpoint was a composite outcome of all-cause death, myocardial infarction (MI), stroke, and repeat revascularization at the last follow-up. Included patients were followed at 6 time points (at discharge, 1 month, 6 months, 12 months, 3 years, and 6 years after CABG) by trained research nurses to obtain outcome information. All endpoints were adjudicated by a critical events committee.
Statistical analysisContinuous variables were expressed as mean ± standard deviation (SD) and compared using one-way analysis of variance (ANOVA). Categorical variables were presented as counts and percentages and compared using the chi-squared or Fisher's exact test as appropriate. Preoperative PCS, MCS scores and ΔPCS, ΔMCS were standardized using the z-transform. Pearson correlation analyses at each timepoint were conducted to quantify the relations between PCS and MCS scores. First, we investigated the association of baseline PCS and MCS scores with each outcome so that the additional prognostic value of follow-up measurement and ΔPCS or ΔMCS could be demonstrated. The associations between baseline PCS and MCS scores with each outcome were tested by Cox regression analysis adjusted for clinical variables. The covariates in the adjusted model (model 1) included age, sex, body mass index (BMI), prior smoker, hypertension, diabetes mellitus, prior stroke or transient ischemic attack, peripheral vascular disease, chronic obstructive pulmonary disease, preoperative left ventricular ejection fraction (LVEF), prior MI, chronic heart failure, on- or off-pump CABG, and number of conduits. In model 2, baseline PCS or MCS scores were incorporated in addition to those of model 1 to illustrate the predictive value of baseline MCS or PCS scores.
The crude (adjusted for baseline PCS score or MCS score only, respectively) association between ΔPCS and ΔMCS with each outcome was also tested using Cox regression analysis (model 3). To demonstrate whether ΔPCS and ΔMCS were independent predictors for long-term prognosis, clinical variables were further adjusted in the final model (model 4). Additionally, ΔPCS and ΔMCS were stratified into quartiles to facilitate clinical interpretability of change in SF-36 summary scores. All analyses were conducted with R version 4.2.1 (R Core Team, Vienna, Austria). A P <0.05 was considered statistically significant.
ResultsThe current study included a total of 433 participants who were followed for an average of 6.28 years. During this follow-up period, 35 patients (35/433, 8.1%) experienced mortality, and 88 patients (88/433, 20.3%) suffered from the composite outcome. Four patients who died within the first 6 months after CABG were excluded from the analyses specifically concerning ΔPCS and ΔMCS.
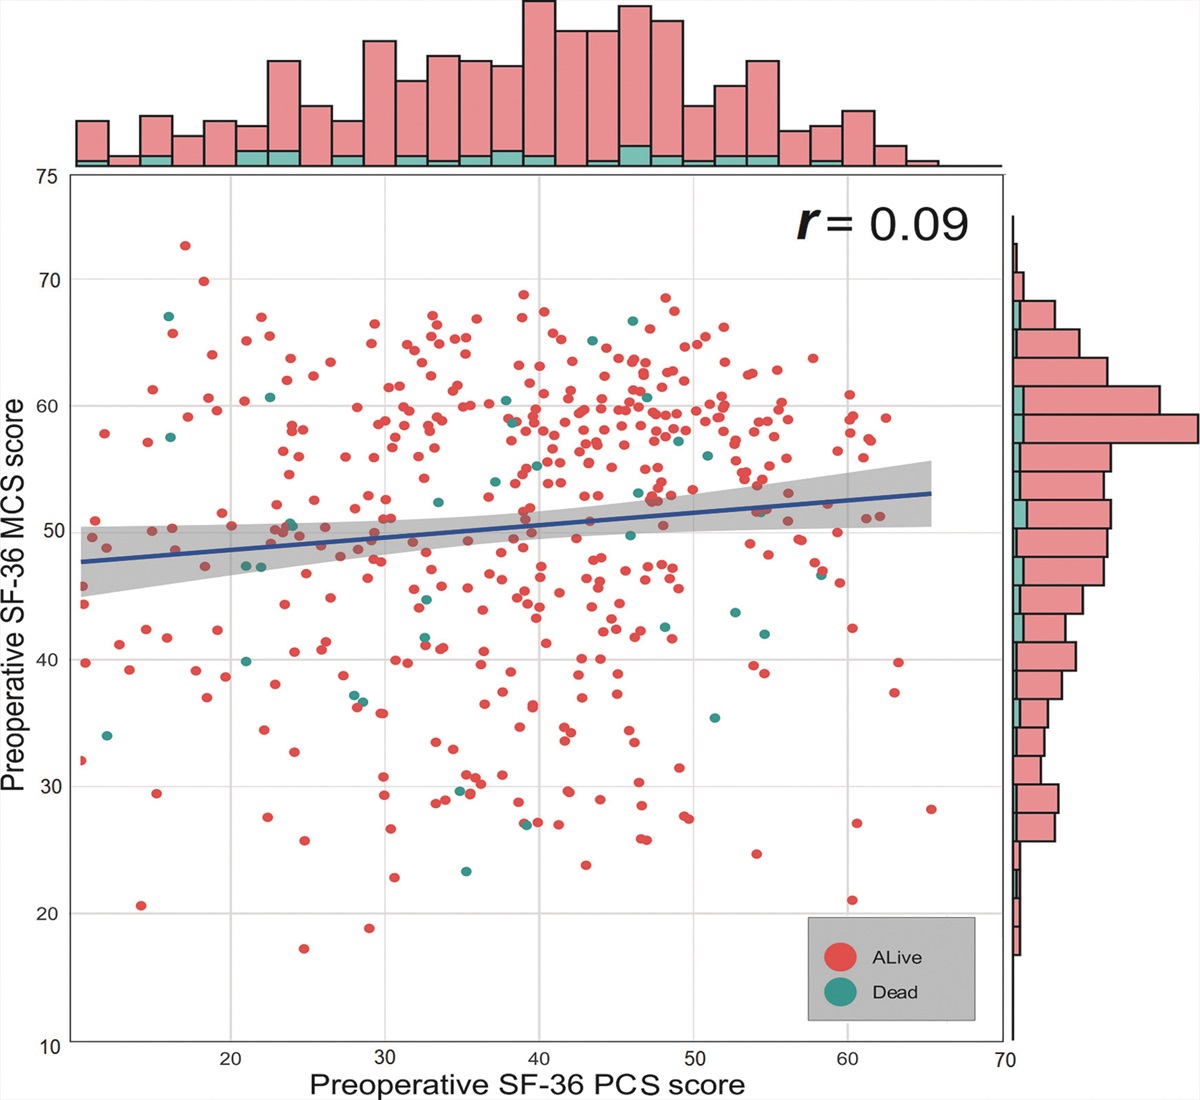
PCS and MCS scores at baselineThe average preoperative PCS and MCS scores in our study were found to be 37.6 and 50.1, respectively. These scores were comparable to those reported by Lam et al[27] in a Chinese CAD population, where the PCS score was 36.0 and the MCS score was 49.2. Figure 1 illustrated the correlation between preoperative PCS and MCS scores, demonstrated no significant correlation between the two summary scores. At 1-month after surgery, a weak correlation between PCS and MCS scores was observed (Pearson r = –0.14, P = 0.011) [Supplementary Figure 1, https://links.lww.com/CM9/B728].
 Figure 1:
 Correlation of preoperative SF-36 PCS scores and MCS scores. The blue line is the fitted line for the PCS scores and MCS scores. MCS: Mental Component Summary; PCS: Physical Component Summary; SF-36: Short-Form 36.
Baseline characteristicsThe baseline characteristics of the current study were demonstrated in Table 1. The mean age was 60.3 years and 79.9% (346/433) of patients were men. Half of the patients (53.1%, 230/433) received on-pump CABG, and averagely 3.2 conduits were bypassed. When comparing the deceased patients with the surviving ones, it was observed that the deceased patients were older (64.6 ± 8.0 vs. 59.9 ± 8.4, t = –3.309, P = 0.002) and had a higher proportion of diabetes (51.4% vs. 32.2%, χ2 = 5.344, P = 0.021) and prior MI (60.0% vs. 28.4%, χ2 = 15.040, P <0.001). It was also found that these patients had lower PCS scores at the 1-month post-surgery assessment (31.0 ± 13.5 vs. 36.2 ± 12.5, t = 1.997 P = 0.046). Patients grouped by composite outcome obtained similar results except for diabetes and 1-month PCS socres [Supplementary Table 1, https://links.lww.com/CM9/B728].
Table 1 - Baseline characteristics of all the participants. Variables All (n = 433) Alive (n = 398) Dead (n = 35) Statistics values P-value Demographics Age (years) 60.3 ± 8.5 59.9 ± 8.4 64.6 ± 8.0 –3.309* 0.002 Male 346 (79.9) 316 (79.4) 30 (85.7) 0.800† 0.371 BMI (kg/m2) 25.9 ± 3.1 25.9 ± 3.1 26.6 ± 3.0 –1.429* 0.154 Smoker 110 (25.4) 103 (25.9) 7 (20.0) 0.587† 0.444 Comorbidities Hypertension 295 (68.1) 268 (67.3) 27 (77.1) 1.425† 0.233 Diabetes mellitus 146 (33.7) 128 (32.2) 18 (51.4) 5.344† 0.021 Stroke or TIA 50 (11.5) 44 (11.1) 6 (17.1) 1.167† 0.272 PVD 9 (2.1) 8 (2.0) 1 (2.9) 0.113† 0.535 COPD 4 (1.0) 3 (0.8) 1 (2.9) 1.555† 0.287 Disease severity LVEF (%) 60.9 ± 8.4 61.3 ± 8.2 55.4 ± 8.8 4.050* <0.001 Disease severity MI 134 (30.9) 113 (28.4) 21 (60) 15.040† <0.001 CHF 10 (2.3) 8 (2.0) 2 (5.7) 1.957† 0.190 Baseline HRQoL Preoperative PCS 37.6 ± 13.2 37.9 ± 13.6 35.2 ± 13.4 1.087* 0.277 Preoperative MCS 50.1 ± 11.3 50.4 ± 11.5 48.4 ± 11.1 0.873* 0.383 1-month PCS 35.9 ± 11.7 36.2 ± 12.5 31.0 ± 13.5 1.997* 0.046 1-month MCS 57.6 ± 8.4 57.6 ± 8.7 55.9 ± 10.1 0.972* 0.333 Surgical information ONCAB 230 (53.1) 210 (52.8) 20 (57.1) 0.248† 0.619 Number of conduits 3.2 ± 1.0 3.2 ± 1.0 3.3 ± 0.9 –0.696* 0.487 Vein grafts 2.3 ± 1.0 2.3 ± 1.0 2.5 ± 0.8 –1.205* 0.229 Atrial grafts 1.0 ± 0.1 1.0 ± 0.2 0.9 ± 0.3 1.554* 0.129Data are presented as n (%) or mean ± standard deviation. *The statistics were calculated using Student's t-test. †The statistics were calculated using chi-squared test. BMI: Body mass index; CHF: Chronic heart failure; COPD: Chronic obstructive pulmonary disease; HRQoL: Health-related quality of life; LVEF: Left ventricular ejection fraction; MCS: Mental Component Summary; MI: Myocardial infarction; ONCAB: On-pump coronary artery bypass grafting; PCS: Physical Component Summary; PVD: Peripheral vascular disease; TIA: Transient ischemic attack.
At 1-month after undergoing CABG, the patients experienced a temporary decrease in PCS scores, with an average decline of 1.7 points compared to the preoperative level (35.9 vs. 37.6, t = 1.952, P = 0.047). Conversely, MCS scores showed improvement, with an average increase of 7.5 points (57.6 vs. 50.1, t = 9.750, P <0.001). These changes reflect a temporary limitation in physical activity but a relief in mental stress for the patients.
By the 6-month postoperative mark, PCS scores demonstrated a significant improvement compared to the 1-month assessment, with an average increase of 12.5 points (48.4 vs. 35.9, t = 14.055, P <0.001). However, there was no significant difference in MCS scores between the 6-month and 1-month assessments (57.0 vs. 57.6, t = 1.267, P = 0.210), and on average, the MCS scores decreased by 0.6 points compared to the 1-month level [Figure 2].
 Figure 2:
 Change of PCS and MCS scores during the first 6 months after surgery. The PCS scores showed a slight decrease one month after the surgery but significantly improved after six months. On the other hand, the MCS scores significantly improved one month after the surgery compared to preoperative levels and remained stable at this level for six months post-surgery. MCS: Mental Component Summary; PCS: Physical Component Summary.
Prognostic value of preoperative PCS and MCS scoresPCS and MCS scores were standardized using the z-transform. To assess the predictive value of preoperative MCS and PCS scores, we conducted unadjusted and adjusted analyses. As shown in Tables 2 and 3, in unadjusted analyses, lower preoperative MCS scores were found to be predictive of 6-year all-cause mortality (hazard ratio [HR] for a 1-SD decrease, 1.64; 95% CI, 1.10–2.46), and showed a marginal association with the composite outcome (HR for a 1-SD decrease, 1.24; 95% CI, 0.97–1.58). However, preoperative PCS scores were not predictive of all-cause mortality (HR for a 1-SD decrease, 1.17; 95% CI, 0.85–1.61) or the composite outcome (HR for a 1-SD decrease, 1.17; 95% CI, 0.96–1.44).
Table 2 - Univariable and multivariable predictors for all-cause mortality. Variables Univariable Multivariable-model 1-PCS Multivariable-model 1-MCS Multivariable-model 2 HR 95% CI χ 2 P-value HR 95% CI χ 2 P-value HR 95% CI χ 2 P-value HR 95% CI χ 2 P-value Demographics Age (years) 1.08 1.03–1.13 9.365 0.002 1.08 1.03–1.13 6.192 0.013 1.09 1.04–1.14 11.271 0.001 1.08 1.03–1.14 9.529 0.002 Male 1.52 0.59–3.92 0.751 0.386 1.34 0.49–3.64 0.260 0.610 1.30 0.48–3.54 0.248 0.618 1.25 0.45–3.45 0.170 0.681 BMI (kg/m2) 1.08 0.97–1.20 1.907 0.167 1.13 1.01–1.27 3.858 0.049 1.17 1.04–1.31 6.254 0.012 1.16 1.03–1.31 3.901 0.048 Smoker 0.72 0.32–1.65 0.600 0.438 0.73 0.29–1.81 0.418 0.518 0.75 0.30–1.88 0.368 0.544 0.77 0.71–4.77 0.271 0.603 Comorbidities Hypertension 1.64 0.75–3.61 1.512 0.219 1.70 0.74–3.92 1.625 0.202 1.68 0.74–3.82 1.655 0.198 1.64 0.72–3.75 1.317 0.251 Diabetes mellitus 2.14 1.10–4.14 5.032 0.025 2.16 1.11–4.22 5.215 0.022 2.19 1.12–4.29 6.712 0.010 2.54 1.23–5.28 5.244 0.022 Stroke or TIA 1.68 0.68–3.94 1.207 0.272 1.65 0.64–4.23 1.373 0.241 1.61 0.64–4.09 1.490 0.222 1.84 0.71–4.77 2.145 0.143 PVD 1.44 0.20–10.54 0.131 0.718 0.93 0.07–12.64 0.037 0.848 0.87 0.65–11.49 0.035 0.852 0.74 0.06–8.56 0.115 0.735 COPD 3.21 0.44–23.44 1.319 0.251 2.55 0.19–35.24 0.392 0.531 2.28 0.17–31.11 1.113 0.291 3.53 0.28–43.79 1.273 0.261 Disease severity LVEF (%) 0.94 0.91–0.97 15.016 <0.001 0.96 0.93–1.00 4.210 0.040 0.96 0.92–1.00 4.801 0.028 0.95 0.91–0.99 4.371 0.035 MI 3.48 1.77–6.84 13.054 <0.001 2.91 1.40–6.04 8.973 0.003 2.80 1.33–5.90 7.012 0.008 2.77 1.31–5.89 8.382 0.004 CHF 2.63 0.63–10.94 1.757 0.185 1.76 0.36–8.73 0.553 0.457 1.70 0.34–8.38 0.273 0.601 1.53 0.31–7.59 0.334 0.563 Baseline HRQoL Preoperative PCS* 1.17 0.85–1.61 0.072 0.788 1.05 0.77–1.44 0.108 0.743 – – – –
留言 (0)