Materials
The standardized hydroalcoholic C. sinensis leaf extract was provided by Arjuna Remedies in Kerala. Leciva S70 (Phospholipid) was provided by VAV Life Sciences Pvt. Ltd, Mumbai Sigma-Aldrich supplied Epigallocatechin 3 gallate (EGCG), scopolamine HBr (hydrobromide), and piracetam. The dialysis membrane 60 was provided by Analab Fine Chemicals. Ethanol, methanol, n-octanol, and chloroform were furnished by Sigma-Aldrich Corporation. The rest of the materials were of superb analytical quality.
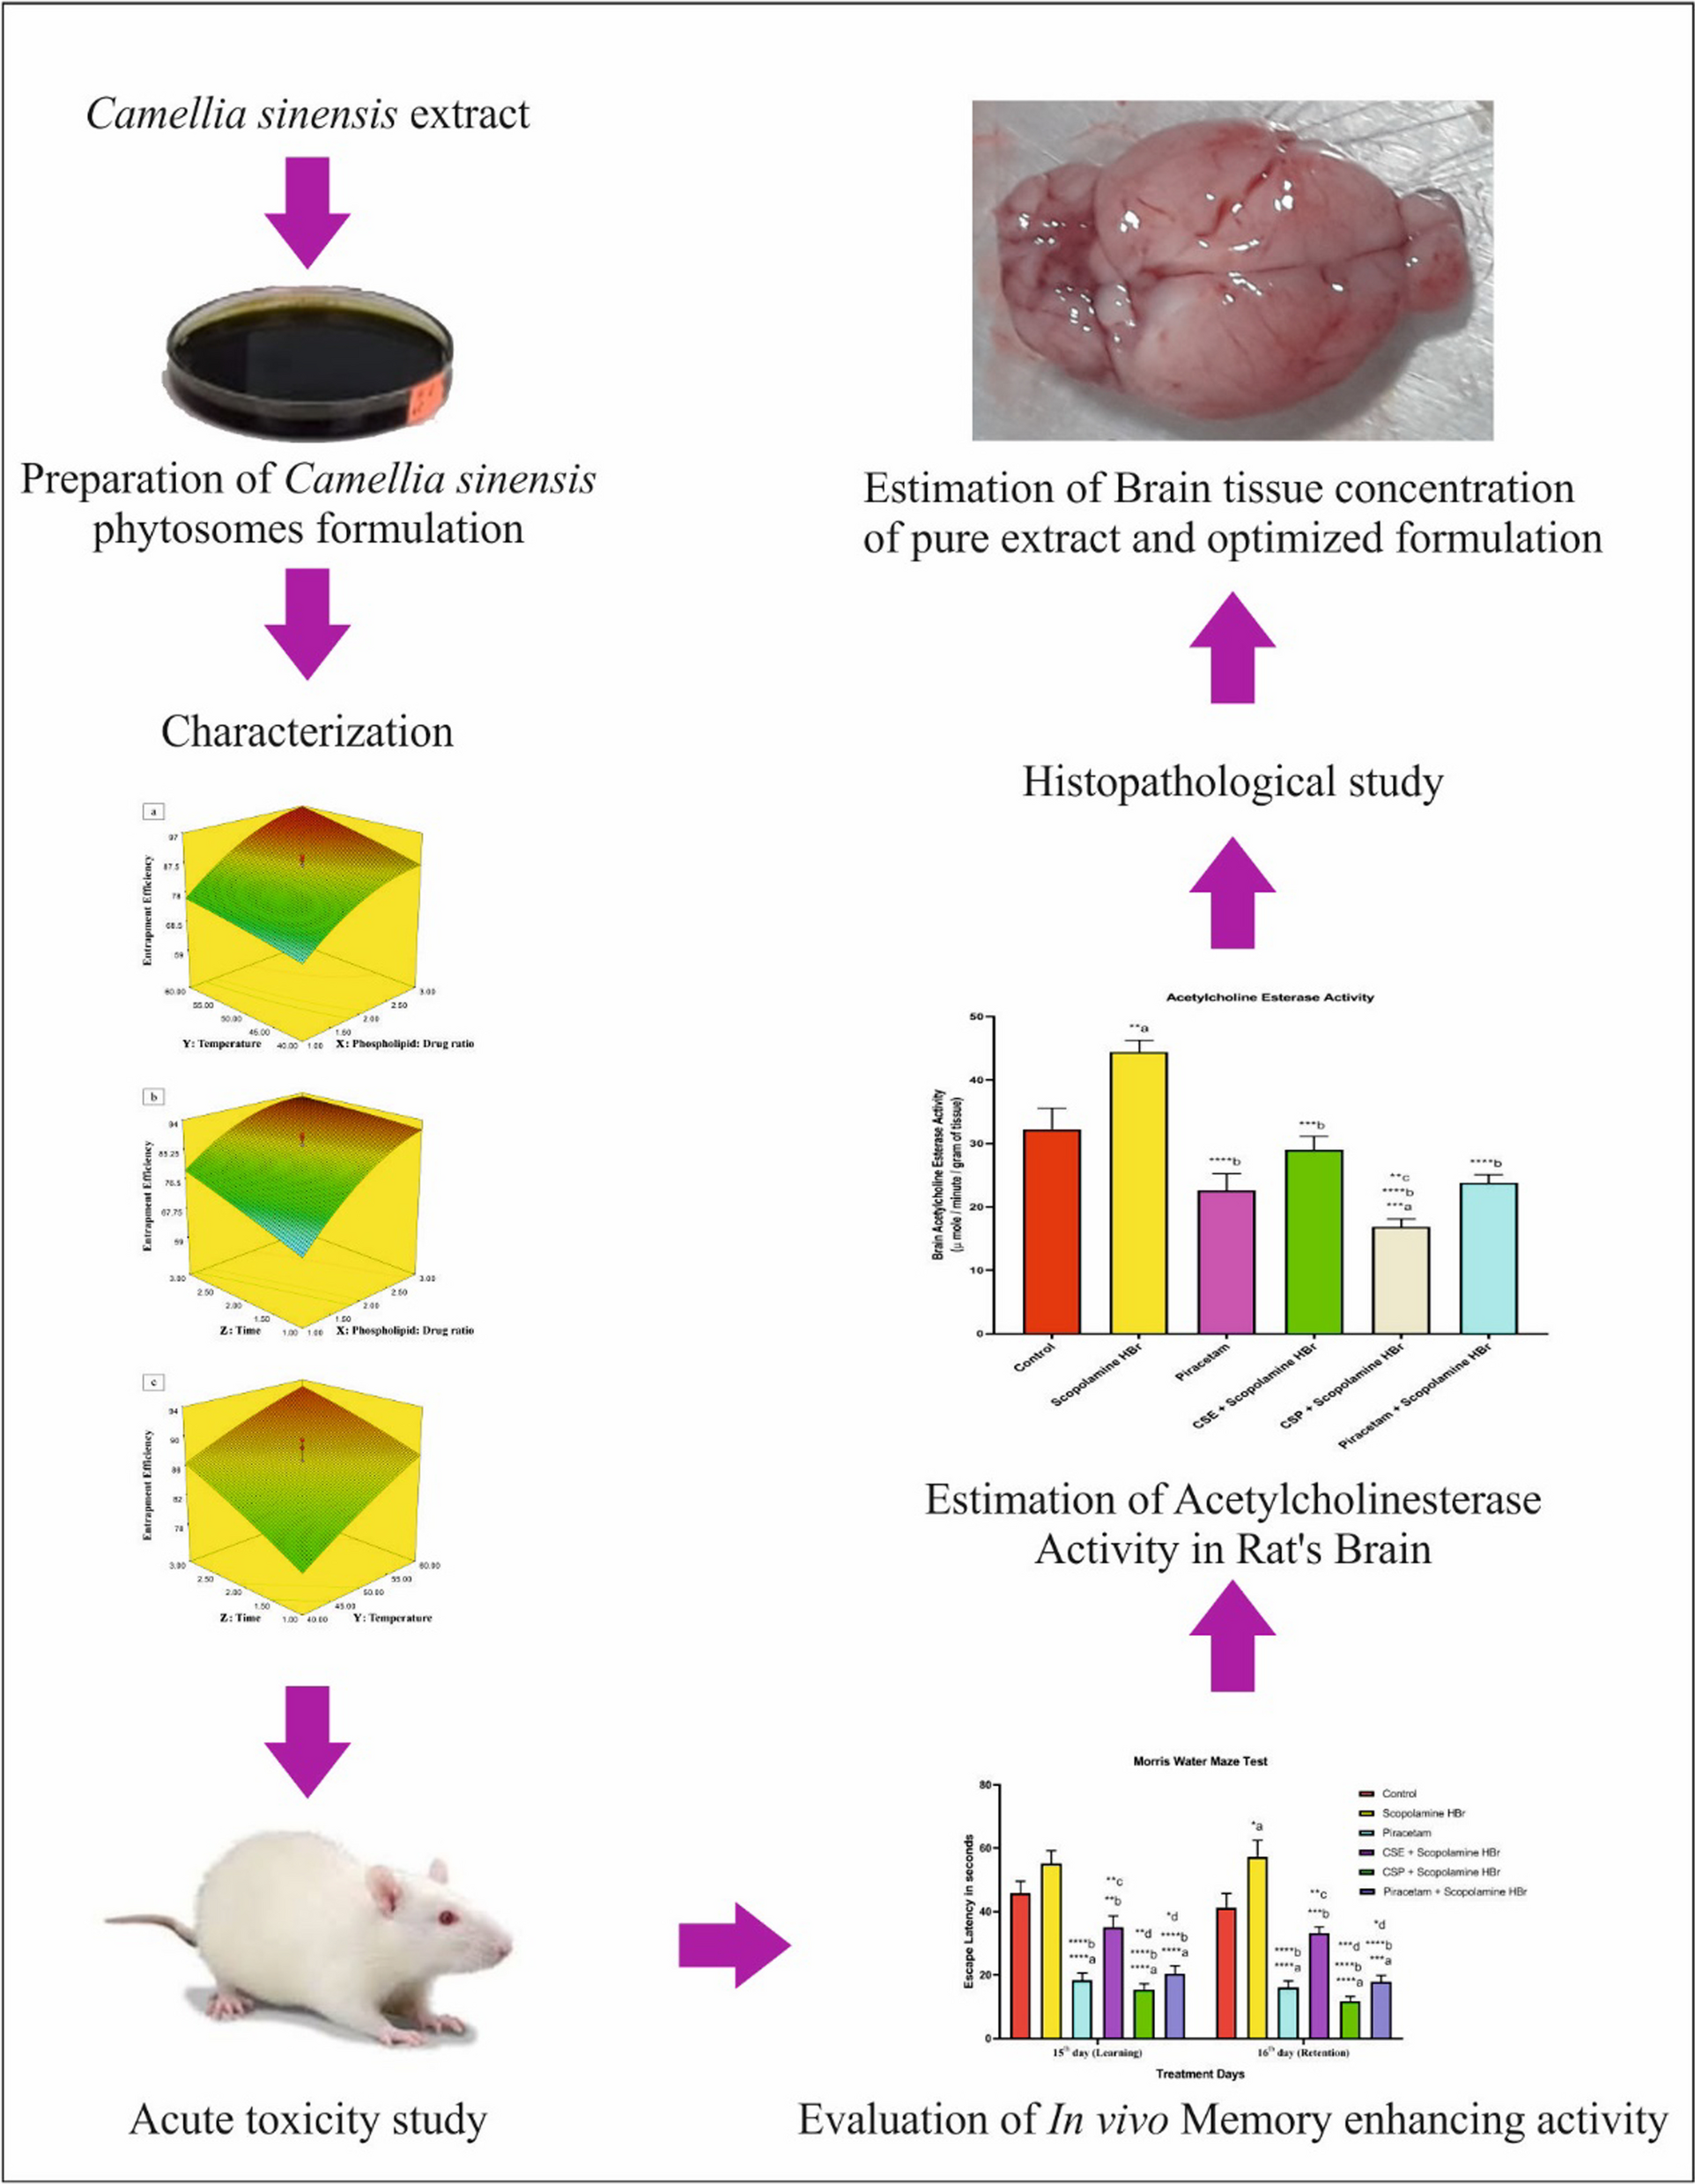
MethodsPreparation of C. sinensis phytosomes
The formulations for the C. sinensis leaf extract-loaded phytosomes (CSP) were developed using solvent evaporation techniques. 250-ml round-bottom flasks were filled with various ratios of C. sinensis extract (CSE) and Leciva S70 (1:1, 1:2, and 1:3). Then, 50 ml of ethanol was added to this. The reaction was conducted by maintaining the RBF-containing reaction mixture at different temperatures (40, 50, and 60 °C) for a predetermined time (1/2, 3 h), following the CCD. During heating, the reaction mixture was stirred. The solution was then evaporated and stored in a vacuum desiccator for a night to remove any trace of solvent that might have been left over after the initial incubation. The dry mixture was held in an amber bottle for later use [20].
Experimental design and statistics
The effects of independent parameters like drug ratio (% w/w), temperature (oc), and time (Hr), on entrapment efficiency (EE), were analyzed using central composite design (CCD), an optimization tool based on the response surface methodology. Using Design Expert 7.0.0 software, the experimental data were analyzed. Table 1 lists the levels of the considered independent variables and their experimental ranges for EE (% w/w).
Table 1 Experimental central composite design factors at three levels regionsEntrapment Efficiency (EE)
The efficiency of the developed phytosomes was assessed through a solvent extraction method as described previously. One hundred mg of the formulation was weighed and evenly dispersed throughout 10 ml chloroform. The produced phytosomes and Leciva S70 were dissolved in chloroform making CSE insoluble. The resulting mixture was centrifuged (Remi, Mumbai) at 5000 RPM. The sediment was removed from the transparent supernatant solution. Alcohol (ethanol) was used as the solvent in a UV/VIS spectrophotometer (UV 3000 + , LAB INDIA) for non-aggregated CSE which showed a peak at 274 nm. Finally, a calibration curve was used to estimate the Epigallocatechin 3 gallate concentration using the Y = 0.02275x + 0.017429 regression equation.
Particle size
Particle size distribution and mean particle size of the optimized batch of CSP were determined at a constant temperature of 25 °C using Malvern Instrument, Malvern, UK (Model: ZEN 3600). The water was used to distribute the particles evenly. The polydispersity index (PDI) was used to determine the extent to which size distributions varied [21].
Zeta potential determination
The zeta potential was analyzed using the Scientific SZ-100 HORIBA (for Windows [Z Type] Ver2.40) analyzer. The optimum CSP formulation was tested for stability by zeta potential analysis. The average zeta potential, charge, and mobility of optimized CSP were measured after 60 s of study [22].
FTIR spectroscopy
The FTIR spectra of CSE, physical mixture (PM), CSP, and Leciva S70 (phospholipid) were obtained using an FTIR-7600 (Lambda Scientific) spectrophotometer. All samples were dried in a hot air oven at 50 °C for two hours to remove moisture. Each sample (~ 1 mg) was evenly mixed with potassium bromide (approximately 100 mg), then compressed at a pressure of 10 Ton/nm2 to form a disk-shaped pellet. The resulting pellet was placed inside the sample container and scanned from 4000 to 500 cm-1 at a resolution of 4 cm-1.
Powder X-ray diffraction (XRD)
The polymorphic states of CSE, Leciva S70, PM, and CSP were investigated utilizing a powder X-ray diffractometer (Model: D8 Advance, Bruker AXS, USA) equipped with a Bragg–Brentano geometry (θ/2) optical setup to record X-ray diffraction patterns. The samples were scanned between 3 and 60 degrees, with a setup angle range of between 0.2 and 2θ and a count time of 0.5 s.
Solubility analysis
The solubility of CSE, PM, and CSP was determined by using the method already described [23]. Briefly, the excessive amount of samples was dissolved in either water or n-octanol (10 ml) in airtight glass containers at room temperature (25 °C). The glass bottles containing the solutions were shaken with an orbital shaker (RIVOTEK) for 24 h and centrifuged for 20 min at 4000 RPM (REMI, India). The clear supernatant was isolated and passed through a membrane filter (0.45μ). 1 ml of this filtrate was then diluted appropriately and analyzed at 274 nm using a UV/ VIS spectrophotometer (UV 3000 + , LAB INDIA).
In Vitro release studies
The in vitro release of CSE, PM, and CSP was performed using a dialysis membrane (MW cut off > 12,000 KDa). Before filling the samples, the dialysis membrane was soaked in distilled water for 1 min. Fifty mg of CSE was dissolved in a buffer solution (4 ml) to form a suspension. Under the same conditions, an equivalent amount of CSP was dispersed into to buffer solution. The dialysis bag was filled with the prepared dispersions and tied from both ends. The dialysis membrane bag containing the sample was suspended in a mixture of phosphate-buffered saline (PBS) (200 ml, pH 7.4) and Tween 20 (1% w/v) in a glass beaker. The buffer solution was stirred under magnetic stirring at 100 RPM maintaining a temperature of 37 ± 0.5 °C. The samples (5 ml) were withdrawn at a predetermined time interval and replenished with an equal volume of freshly prepared buffer to maintain the sink condition. The aliquots were filtered using a 0.45-micron membrane filter before being measured at 274 nm (Telange et al. 2017) using a UV/VIS spectrophotometer (UV 3000 + , LAB INDIA). In addition to these studies, we have performed Differential scanning calorimetry (DSC), Scanning electron microscopy (SEM), Proton Nuclear Magnetic Resonance and stability study. The detailed experimental methods of these studies is provided in Additional file 1.
Acute toxicity study
All animal handlings and experiments were approved by the Animal Ethical Committee of Crystal Biological Solution, Pune, with approval number CRY/2122/070. Acute toxicity testing was performed on healthy, non-pregnant, and nulliparous female Wistar rats. Four experimental groups of 12 female rats (n = 3) were formed. Groups I and II were given CSP formulations at 300 mg/kg bw, while groups III and IV received 2000 mg/kg bw. The dose titration was done with the population from each group’s safety in mind. The Wistar rats were starved for three hours before and after the dosage. Throughout the trial, water was available at all times. Individual animals were monitored for the first 30, 60, 120, 180, and 240 min following treatment and once a day for the next 14 days [24].
Dosing and sampling schedule
For the in vivo memory-enhancing activity investigation, 36 Wistar rats of both sexes (male and female) weighing 175–240 gm were employed. The animals were divided into six groups each containing 6 in each groups. As per CPCSEA guidelines, rats were provided with free access to food and water and kept in an animal house with standard laboratory conditions (constant room temperature (25 ± 2 °C), relative humidity (50–70% RH), and a 12-h light/dark cycle). Carboxymethyl cellulose (CMC) 0.5% (10 ml/kg bw) was administered to Group I (Control) for 15 days, (Negative control) Scopolamine HBr (0.4 mg/kg bw) was received to Group II (Negative control) by i.p. route on the 15th day. In Group III (the Positive control group), subjects were given piracetam orally at a regular dose (200 mg/kg body weight) for 15 days. Group IV received an oral dose of C. sinensis extract (CSE) (250 mg/kg bw) for 15 days, followed 45 min later by an i.p injection of scopolamine HBr (0.4 mg/kg bw). After 15 days of oral administration of CSP formulation (equal to 250 mg/kg bw of CSE), scopolamine HBr (0.4 mg/kg bw) was injected (i.p.) after 45 min of CSP formulation administration in Group V, 15 days of oral piracetam (200 mg/kg bw) were followed by 45 min of injection (i.p) of scopolamine HBr (0.4 mg/kg bw) in Group VI.
In 0.5% (w/v) CMC solution, CSE, CSP, and piracetam solutions were produced. All animals were treated according to the schedule and exposed to a behavioral analysis study. Simultaneously, the same groups were employed for three different models. Animals were pre-treated with MWMT, EPMT, and PCT on alternating days before the tests. On day 15, 90 min following the administration of the relevant dose, the transfer latency (TL)/ or the escape latency (EL) was determined. Both of these measurements took place. After 24 h had passed since the last session, the retention of all learned tasks was assessed [25].
In vivo memory-enhancing/boosting activity
In this study, the term “memory-enhancing/boosting activity” means to elevate the memory and cognitive functions which were determined using various behavioral tests including Morris Water Maze Test, Elevated Plus Maze Test, Pole Climbing Test, and the measured outcomes like escape latency, transfer latency, acetylcholine, serotonine, and dopamine levels. The memory-enhancing efficacy of optimized CSP in contrast to CSE was compared.
Elevated plus maze test
Using an exteroceptive behavioral paradigm, the EPMT was utilized to examine the effects of training on rat memory and learning (where the stimulus was external to the body). The apparatus had two bare arms (each 50 cm × 10 cm) and two covered arms (each 50 cm × 40 cm × 10 cm). Extending the arms from a central platform, the maze was raised to 50 cm from the floor (10 cm × 10 cm). On day one, the rats were placed one by one at the very tip of the open arm, with their backs to the platform in the middle. The rat’s opposite gender was identified in any covered areas to see if the test rat’s retentive memory caused it to go quicker toward that region. The TL was determined by recording the time it took the rat to move inside any of the covered arms containing the opposing gender while using all four of its legs. On the first day, each animal’s TL was noted. Within the first 90 s, the animal was allowed to enter one of the covered arms. If it did not, it was coaxed into gently entering one of the arms. A time limit of 90 s was imposed there. After the rat had explored the maze for ten more seconds, it was put back in its cage. The retention of this learned task was evaluated 24 h after the last dose or on day 16 of treatment. A considerable decrease in the TL value of retention showed memory improvement [26].
Morris water maze test
The MWMT was performed in a circular swimming pool of 100 cm in diameter and 50 cm in height. The circular pool was built with filling and draining facilities and installed on a framework with the water level at waist height. The circular tank’s floor was divided into four equal quadrants. Up to a depth of 30 cm of water was added. One of the pool’s four corners has a plastic platform dug 2 cm below the water’s surface (9 cm in diameter and 28 cm in height). The milk was used to make the pool opaque. The trial platform was consistently situated in the same spot.
The rats were trained to swim without a platform on the first day of the test. Then, after a brief introduction, the animals were released into the tank and given 10 s to explore the exhibit, including sitting on the secret platform. After 90 s, if the rat still had not found the platform, it was placed on it and left there for 10 s. On alternating days, rats were trained for 15 days. The trial was successful when the rat sat on the hidden platform within 90 s. If rats spend more than three minutes looking for the hidden platform, that is a mistake. Throughout the investigation, the experimental setting remained the same. Memory improvement was indicated by a considerable fall in the EL value [27].
Pole climbing test
The cognitive processes of learning and memory retention were studied using Cook’s pole climbing equipment. The apparatus consists of a soundproof experimental chamber (25 × 25 × 25 cm) with a floor grid. The chamber’s floor grid is made of stainless-steel rods. The chamber’s floor grid received a scrambled shock (6 mA). A hole at the room’s center top was used to suspend a pole with a diameter of around 2.5 cm. Wistar rats were placed in the chamber and given 45 s to investigate their surroundings. The buzzer served as the conditioned stimulus (CS), and the 45 s of electrical shock through the grid floor served as the unconditioned stimulus (US). Once the animal connected the sound of the buzzer to the impending foot shock, it could avoid the pain by climbing the pole after the signal was given. A record of the EL quantity was kept. The animals were initially screened using this paradigm, and only those who exhibited an escape response on at least one of the trials were included [26].
Estimation of acetylcholinesterase activity in rat’s brain
On the 16th day, after conducting MWMT, EPMT, and PCT, Five Wistar rats from each group were anesthetized by giving an intramuscular injection (Ketamine Hydrochloride IP) and decapitated. Instantaneously after removal, the brains were washed in icy saline and frozen at -800C for later use. 0.1 M phosphate buffer (pH 8.0) was used to homogenize the tissue after measuring its weight (0.1 gm of tissue per ml of phosphate buffer). Two and a half milliliters of buffer and one hundred microliters of DTNB 5,5-dithio bis (2-nitrobenzoic acid) were placed in a cuvette. Then, 4 ml aliquots of the homogenate were added. The resulting mixture was well mixed, and the absorbance was measured in a photometric calorimeter at 412 nm. After recording the basal measurement, 20 ml of the substrate (i.e., acetylthiocholine) was added to the solution mentioned above when the absorbance reached a steady value. The change in absorbance was measured every two minutes for 10 min. [27].
Estimation of dopamine concentration in Rat’s brain
DA GENLISA™ ELISA kit was used for the quantitative determination of dopamine in Wistar rat brain homogenate solution by sandwich ELISA technique. Fifty µl of prepared rat dopamine (DA) standard solutions of 0.3, 0.6, 1.2, 2.4, 4.8, and 9.6 ng/ml was added to respective standard wells. These standard solutions were used for the construction of the calibration curve. Forty µl of Wistar rat brain homogenate sample solution from groups I to VI was added to respective sample wells. Ten µl of biotinylated DA antibody was added to the respective sample wells. The biotinylated DA antibody was not added to standard wells because the standard solution contains the biotinylated antibody. Fifty µl of streptavidin-HRP conjugate was added to all sample wells. Mixed well. The plate was covered with a sealer and incubated for 60 min at 37 °C. The plate was aspirated, washed four times with diluted wash buffer (1X), and the residual buffer was blotted by firmly tapping the plate upside down on absorbent paper. Wipe out all liquid from the bottom outside of the microtiter wells, as any residue can interfere with the reading step. Fifty µl TMB Substrate A was added followed by 50 µl TMB Substrate B in all the wells. The plate was covered and incubated at 37 °C for 10 min. The wells had turned bluish. Fifty µl of stop solution was added to all wells. The wells were turned from blue to yellow. Absorbance was recorded at 450 nm with a microplate reader within 10–15 min after the addition of the stop solution [28].
Estimation of serotonin concentration in rat’s brain
The Rat Serotonin, ST GENLISA™ ELISA kit was used for the quantitative determination of serotonin in Wistar rat brain-homogenated solution by sandwich ELISA technique. Fifty µl of prepared serotonin (ST) standard solutions of 7.5, 15, 30, 60, 120, and 240 ng/ml was added to respective standard wells. These standard solutions were used for the construction of the calibration curve. Forty µl of Wistar rat brain homogenate sample solution from groups I to VI were added to respective sample wells. Ten µl of biotinylated ST antibody was added to the respective sample wells. The biotinylated ST antibody was not added to standard wells because the standard solution contains the biotinylated antibody. Fifty µl of streptavidin-HRP conjugate was added to the respective sample wells and also the standard wells. The streptavidin-HRP conjugate was not added to the blank well. Mixed well. The plate was covered with a sealer and incubated for 60 min at 37 °C. The plate was aspirated and washed four times with diluted wash buffer (1X), and the residual buffer was blotted by firmly tapping the plate upside down on absorbent paper. Wipe out all liquid from the bottom outside of the microtiter wells, as any residue can interfere with the reading step. Fifty µl TMB Substrate A was added, followed by 50 µl TMB Substrate B in all the wells. The plate was covered and incubated at 37 °C for 10 min. The wells had turned bluish. Fifty µl of stop solution was added to all wells. The wells were turned from blue to yellow. Absorbance was recorded at 450 nm with a microplate reader within 10–15 min after the addition of the stop solution [29].
Histopathological study
One animal from each group received an intramuscular dose of Ketamine Hydrochloride IP at the end of the treatment session, rendering it unconscious so that its brain could be dissected. The removed brain was stored in a 10% (v/v) formalin solution. A hematoxylin and eosin reagent was used to stain between 3- and 5-μ-thick sections. The brain slices were studied with an optical microscope, and pictures were taken with the microscope’s attached digital camera at a magnification of 400x.
Procedure for estimation of the concentration of CSE and CSP in brain tissue
The concentration of CSE and CSP in brain tissue was determined using a brain-homogenated solution (4 ml) from animal groups IV and V. The homogenized brain solutions were placed into two distinct 5-ml centrifuge tubes and spun for 15 min at 10,000 rpm. CSE and CSP clear supernatants were separated and used for HPLC analysis.
High-Performance liquid chromatography (HPLC)
Epigallocatechin 3 gallate was used as a marker to estimate the CSE and CSP in brain tissue. A bioanalytical HPLC (Model: Waters 2695 alliance) approach was developed for the Epigallocatechin 3 gallate marker. A Zorbax SB C18 5μ (4.6 × 150) mm column was utilized. This experiment was conducted using the chromatographic gradient technique. As a mobile phase, water with 0.1% (v/v) formic acid and acetonitrile (ACN) with 0.08% (v/v) formic acid were observed. Mobile phase filtration was performed using a 0.45-m millipore filter. The mobile phase flow rate was maintained at 1.0 ml/min, and the column temperature was held at 30°c. At 274 nm, a PDA-type detector was utilized [30]. (Regression Equation: Y = 44,929.71 X–4900.50 and Retention time: 7.417 Minutes).
Comparative pharmacokinetic study of CSP and CSE in the blood plasma compartment
18 Wistar albino rats (both sexes) weighing between 240 and 370 g were used in the pharmacokinetic study. Wistar albino rats were housed in a standard laboratory setting and provided free access to food and water as per CPCSEA guidelines. For the study, animals were fasted overnight until 2 h after medication and then given food. Animals were divided into three groups containing six in each group. Group I (Control): 0.5% (w/v) CMC solution (10 ml/kg bw), Group II: CSE (250 mg/kg bw and Group III: CSP formulation (equivalent to 250 mg/kg bw of CSE). CSP and CSE were dissolved individually in a 0.5% (w/v) CMC solution and given to the different groups orally. All Wistar rats were anesthetized with Ketamine Hydrochloride IP (intramuscular injection). The retro-orbital vein was punctured to collect blood samples (0.5–0.7 ml) and collected in Eppendorf tubes at intervals of 0, 0.5, 1, 2, 3, 4, 6, 8, 12, and 24 h. Plasma was separated using centrifugation (Remi, Mumbai, India) at 10,000 rpm for 10 min, and the sample was then frozen at -40°c for further drug analysis [31].
Preparation of plasma samples for HPLC analysis
One ml of purified plasma and 2 ml of methanol were placed in the centrifuge tube. After 30 s of vigorous agitation, centrifugation at 10,000 rpm for 10 min, and collection of the clear supernatant, the tube was discarded. The protein-free solution was stored in a tube at -40°c in the freezer until HPLC analysis was done.
Estimation of pharmacokinetic parameters
A protein-free clear supernatant (20 μl) was put into the chromatographic system that had been designed. The calculated concentration at each time was based on the obtained peak area. Then, directly from plasma concentration–time data estimated by one extravascular compartment model using PK Solver, the pharmacokinetic parameters (maximum plasma concentration) C max, (area under the concentration–time curve) AUC, (corresponding time) t max, (half-life, clearance) CL/F, and (volume of distribution) V/F were calculated.


留言 (0)