Model description
The Core Obesity Model (COM) version 18, a validated Markov-state transition cohort model in Excel, was used to estimate the cost-effectiveness of semaglutide 2.4 mg in combination with D&E compared to D&E alone for the treatment of adults with obesity (BMI ≥ 30 kg/m2) with one or more weight-related comorbidities (Supplementary Figure S1). The model was designed to evaluate the costs and health outcomes associated with the development of obesity-related complications based on risk factors including BMI, lipids, systolic blood pressure (SBP), and glycemic levels/status. Obesity-related complications included in the model were: T2D, myocardial infarction (MI), unstable angina, stroke and transient ischemic attack (TIA), sleep apnea, colon cancer, post-menopausal breast and post-menopausal endometrial cancers, and knee replacement surgery following osteoarthritis. Complications were selected to respond to weight loss having substantial consequences on healthcare resources and costs, patients’ quality of life, and/or life expectancy, based on an unpublished systematic review of the literature [16]. The impact of treatment on comorbidities was assessed by modeling changes in surrogate endpoints that are known to increase the risk of these conditions, such as BMI, SBP, glycemia, and lipids. STEP clinical trials provided data on these surrogate endpoints, while the relationship between surrogate endpoints and actual health outcomes was incorporated into the model using risk equations. These equations explored the association between these risk factors and the incidence of various diseases. In the model, each health state is assigned a cost and a utility decrement for as long as the cohort remains in that particular state. Events such as knee replacement surgery, stroke, TIA, MI, unstable angina, and bariatric surgery incur a one-time cost and lead to a disutility. These event-related costs and utility decrements are applied in the cycle in which the event takes place. A cycle length of 3 months was used in the first year, allowing for more accurate representation of treatment effects and to account for discontinuation due to non-response. Annual cycles were applied after the first year where half-cycle correction was used to estimate occurrence of state transitions in the middle of each cycle. A detailed description of the model and external validation can be found in previous publications [17, 18]. The perspective of the Portuguese National Health Service (NHS) was adopted. Future costs and quality-adjusted life-years (QALYs) were discounted at 4% yearly. Outcomes were modelled over a lifetime horizon corresponding to 40 years. Model outputs included life-years (LYs), QALYs, and total and disaggregated costs (estimated in 2021 EUR). Incremental cost-effectiveness ratios (ICER) were calculated to express the incremental difference in costs and QALYs between semaglutide 2.4 mg and the D&E alternative. The ICER was judged against a willingness-to-pay (WTP) threshold of 20,000 EUR per additional QALY gained, given that there is no established WTP threshold in Portugal. This study adheres to the guidelines in the Consolidated Health Economic Evaluation Reporting Standards (CHEERS) [19].
Modelled population
The modelled population was based on a subsample of patients (n = 1,470) from the total STEP 1 trial population, corresponding to adults aged 48 years on average with BMI ≥ 30 kg/m2 with one or more obesity-related comorbidity eligible for treatment with semaglutide 2.4 mg. The cohort profile is available in Supplementary Table S1.
Model inputsTreatment effects and parameter progression
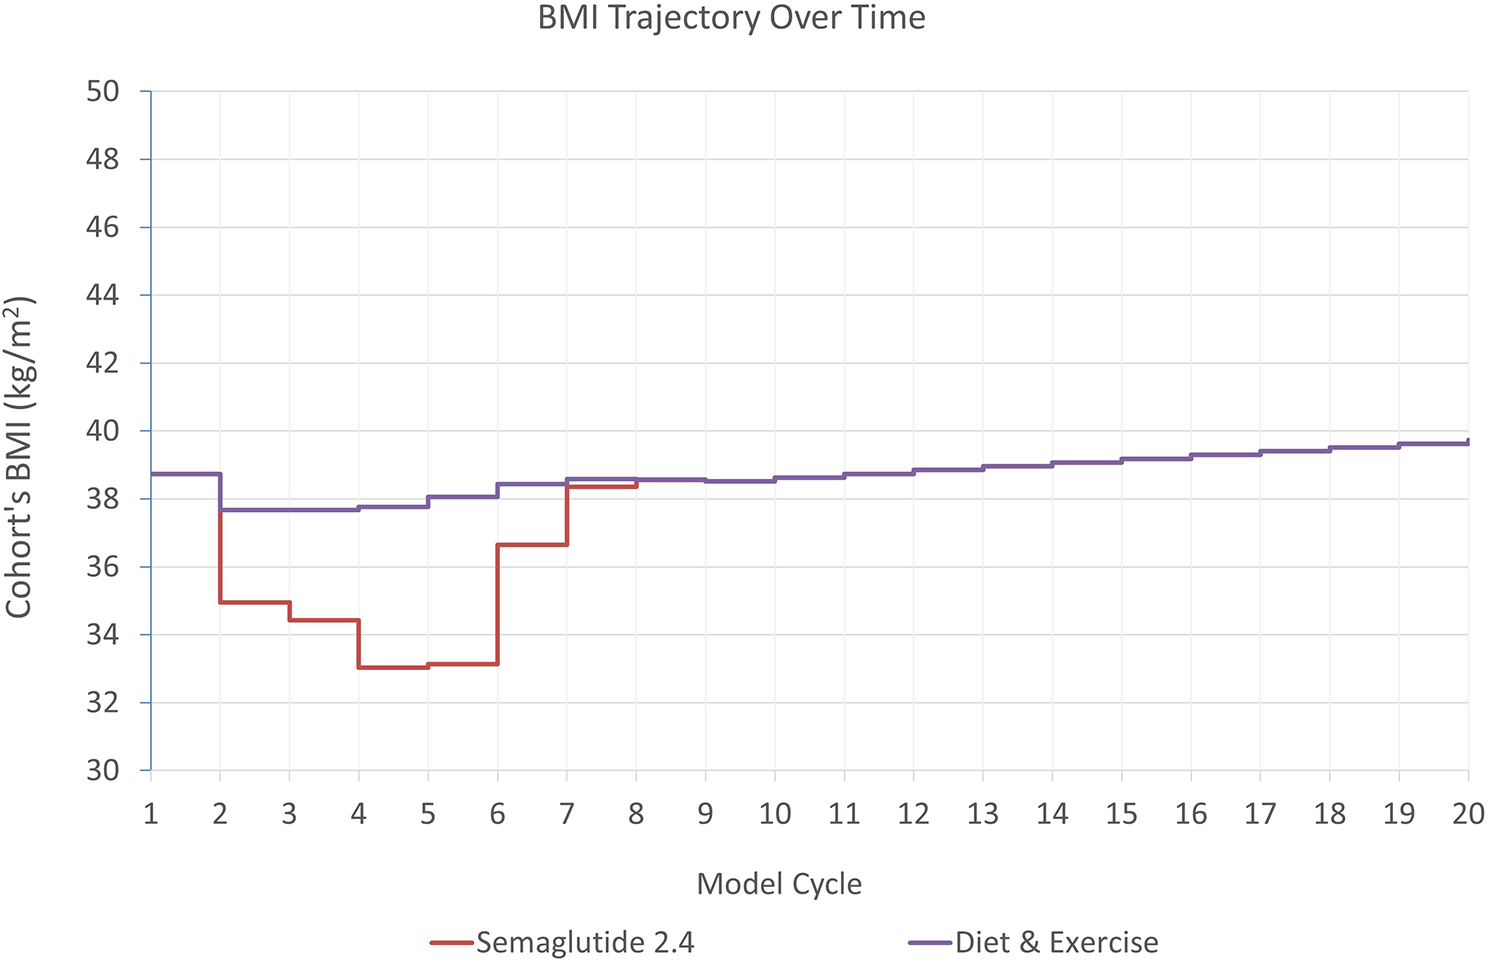
Treatment efficacy estimates were sourced from two of the STEP trials. Changes from baseline in BMI, SBP, total cholesterol, HDL, glycemic status, and the proportion of treatment responders (achieving a ≥ 5% weight loss) were sourced from STEP 1 trial [14], at 28- and 68 weeks. In the base case analysis, treatment duration was assumed to last 2 years and estimates from an intention-to-treat analysis were used (treatment policy estimand). Treatment effect based on an analysis of the full sample was applied in cycle 2 of the model (3–6 months) and treatment effect based on analysis of treatment responders achieving ≥ 5% weight loss was applied in cycles 3 and 4 (6–9 and 10–12 months). A stopping rule was applied where treatment was discontinued for patients not achieving the minimum weight loss criteria for treatment response. Non-responders (16.3%) were attributed an efficacy estimate from analysis of the full sample of patients in the D&E arm, assuming all patients continue following a D&E program irrespective of treatment response. Treatment waning effect beyond the STEP 1 trial was sourced from the 104-weeks STEP 5 trial (n = 304) [20]. In cycle 5 (year 2), a ratio of change in the risk factor (weight, proportion responders, SBP, and glycemic status) observed in the STEP 5 trial between week 68 and week 104 was computed and applied to the risk factor change observed at week 68 in STEP 1. This adjustment was made based on the efficacy demonstrated by early responders in STEP 5. Starting from cycle 6 (year 3) and each subsequent cycle, the ratio of risk factor change observed in the full analysis set of STEP 5, between week 68 and week 104, was calculated and applied accordingly (Supplementary Table S1). The changes observed at week 68 from STEP 1 trial were assumed to be maintained for total cholesterol and HDL change as assessment of these risk factors was not performed at this time point.
A catch-up rate was applied after treatment cessation to bring the values of the treatment efficacy on the risk factor endpoints back to their baseline values or to a value on their progression with D&E, depending on whether the cohort remains on D&E (Supplementary Table S3). Natural progression beyond this point was assumed for weight to increase with 0.402 kg/year and 0.486 kg/year in males and females respectively (0.463 on average for the cohort) [21] up to a maximum age of 68 years. For glycemic status, a proportion of the cohort with prediabetes status at baseline was assumed to temporarily revert to normal glucose tolerance in cycle 2 only; the maintenance of prediabetes reversal during treatment was also informed by STEP 5 and a catch-up rate was applied post treatment stop.
Treatment discontinuation was assumed for patients not responding to treatment (i.e. not achieving weight loss of ≥ 5% in 28 weeks) and applied from cycle 3 for semaglutide 2.4 mg. Non-responders received efficacy estimates from D&E. (Supplementary Table S4).
Bariatric surgery was used as next line therapy post-treatment. The proportion of the cohort eligible for bariatric surgery was determined by the annual incidence rate of bariatric surgery applied during post-treatment. Eligibility was met when the average BMI of the cohort, corresponded or exceeded the BMI threshold outlined in national guidelines. The efficacy of bariatric surgery in the model results in reductions in BMI, SBP, and lipid levels in the corresponding cycles. Efficacy of bariatric surgery on weight loss was derived from the Swedish Obese Subjects Study [22], taking into account the average effect observed with gastric bypass, laparoscopic banding, and gastrectomy procedures. The efficacy of bariatric surgery in reducing SBP and lipid levels was sourced from a prospective study involving patients who underwent gastric bypass surgery in the UK [23] (Supplemental Table S5).
Treatment related adverse events (AEs) were included in the base-case analyses for semaglutide 2.4 mg including severe gastrointestinal events (e.g., nausea, vomiting, diarrhea, etc.) and non-severe hypoglycemia (Supplementary Table S6).
Complications
Transition probabilities between health states and the incidence of health events were derived from published risk equations accounting for factors such as physiological parameters (e.g., BMI), medical history, and demographics. Briefly, first-occurring CV events were predicted using the QRisk3 [24]. Recurrent events were predicted using the Framingham Recurrent CHD [25]. The incidence of T2D was predicted using the QDiabetes risk prediction algorithm [26]. The prevalence of sleep apnea was calculated using data from a multicenter cohort, namely the Sleep Heart Health Study [27]. The incidence of knee replacement was predicted using data from the Hospital morbidity database and Statistics Portugal [28] along with baseline risks from a case-control study [29]. The incidence of colon cancer, post-menopausal breast and post-menopausal endometrial cancers were sourced from the International Agency for Research on Cancer [30], and hazards ratios by BMI for colon cancer from Schlesinger et al. [31] and for post-menopausal breast and endometrial cancers from two systematic reviews and meta-analyses [32, 33].
Mortality
Sex and age specific all-cause mortality for the general population was sourced from Portuguese life Table [34]. All-cause mortality was adjusted to exclude deaths due to obesity-related complications by subtracting those from all-cause mortality and obtaining non-disease-specific mortality. The non-disease-specific mortality was then adjusted using hazard ratios (HRs) per unit change in BMI, sourced from a study conducted on a large cohort of adults from the UK Clinical Practice Research Datalink (CPRD) database (N = 3.6 million) [35], to account for the increased mortality associated with overweight and obesity. Additionally, case fatality rates specific to MI, unstable angina, stroke, knee replacement and bariatric surgery, as well as HRs representing higher mortality rates post-acute coronary syndrome, stroke, and diabetes, observed in the general population, were applied in the model in the cycle in which each event occurred (Supplementary tables S7, S8, S9). These later, are considered under disease-specific mortality.
Utilities
Utility values varied by BMI level, sex, age, and the occurrence of comorbid conditions. In the base case analysis, utility valued associated with BMI levels were informed by 36-Item Short Form Survey (SF-36) data collected in STEP 1 trial and mapped onto SF-6D using the Sheffield algorithm with Portuguese population’s preferences [36]. Thereafter, baseline SF-6D scores were linearly regressed against baseline BMI, controlling for age, presence of coronary artery disease, prediabetes, hypertension, and smoking status at baseline in STEP 1. Regression coefficients were used in the model to provide a baseline, complication-free utility dependent on the cohort’s BMI in cycle, age, and sex (Supplementary Tables S10, S11). Event and health state disutilities were sourced from the literature and selected to represent the marginal complication-specific disutility of each complication. These were applied using an additive approach, as the cohort transitioned between comorbidity health states or experienced events, and avoiding double-counting (Supplementary Table 12).
Healthcare resource use and cost inputs
The perspective of the Portuguese NHS was taken on costs, and included the cost of the drug, obesity monitoring, bariatric surgery, and costs of complications and ADs. The price of semaglutide 2.4 mg was provided by Novo Nordisk (Supplementary Table S13). Disease monitoring costs were assumed to consist of 8.28 annual health care visits (including 4.5 medical/surgical, 3.61 general practitioner and 0.16 dietitian visits) on average. The cost of D&E was assumed to be zero to the NHS and fully born by patients. Disease monitoring and D&E costs were applied to both treatment arms. Costs related to treatment of complications were sourced from multiple sources including primary health care and specialized care microdata, published literature and publicly available national unit cost data. These costs were applied either as chronic recurring health state costs, or as one-off events costs. Detailed information on the costs of weight related complications is available in Supplementary Table S14.
Sensitivity analyses
Key model assumptions are described in Supplementary table S15. One-way sensitivity analyses were conducted to investigate the impact of input parameters and assumptions on model outcomes by varying one parameter at a time. Parameters were varied based on reported 95% confidence intervals (CI), when available. For parameters without a 95% CI, a range of ± 25% around the base-case value was used. All values used in the sensitivity analysis are reported in Supplementary table S16.
Scenario analyses were conducted to explore the impact of input and structural assumptions on model results, such as considering disease-specific mortality only, different treatment discontinuation assumptions, longer treatment durations, slower catch-up rates, use of literature-based estimate of BMI-utility (based on Eq. 5D), and using alternative risk equations for modelling the incidence of first and recurrent cardiovascular events (Supplementary Tables S17, S18, S19, S20). In addition, the cost-effectiveness of semaglutide 2.4 mg was examined among subgroup populations, including patients with BMI ≥ 30 and BMI ≥ 35 (Supplementary Tables S22, S23, S24, S25).
Probabilistic uncertainty analysis, using Monte Carlo simulations with 1000 iterations were performed to produce 95% uncertainty intervals (95% UIs) around the cost and effect estimates. In each iteration, inputs were randomly drawn from specified distributions. Uncertainty simulations were presented on a cost-effectiveness plane, representing the joint distribution of costs and QALYs. The probability of semaglutide 2.4 mg being cost-effective against the comparator given different willingness to pay threshold values was represented on a cost-effectiveness acceptability curve (CEAC).


留言 (0)